Categories
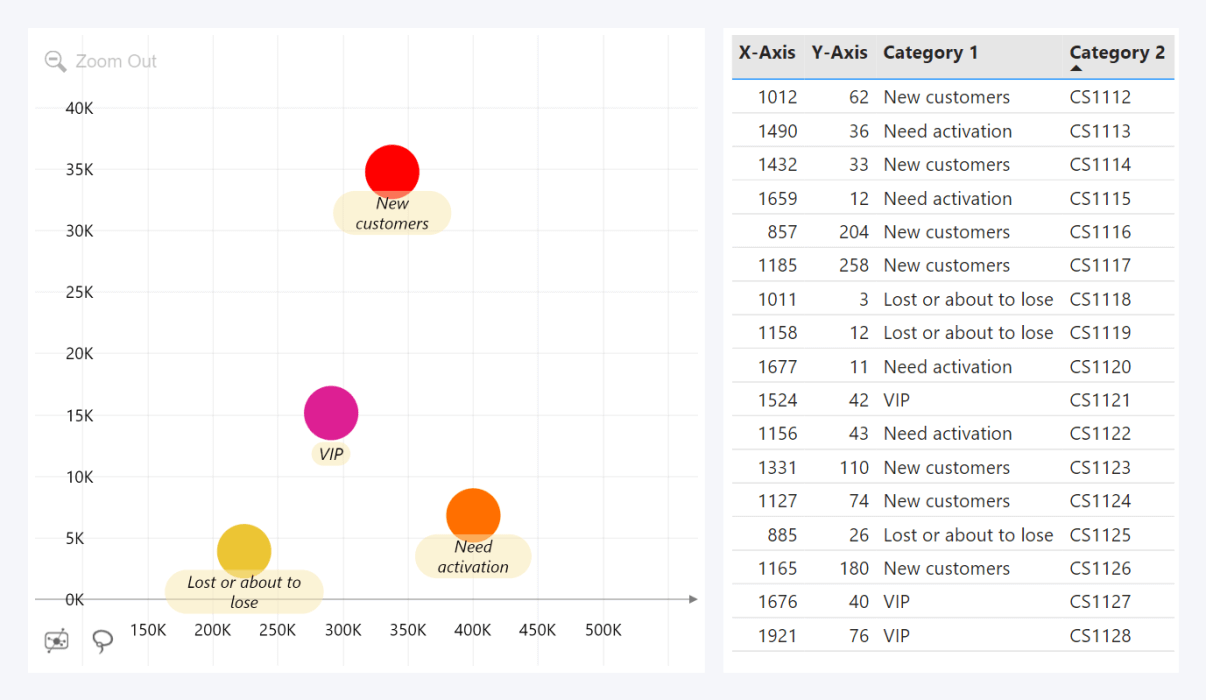
This field may contain one or multiple columns. It is used
to create data points that will be plotted on the scatter chart and establish a
drill down structure.
A data point will be created for each unique category name
in the column. If multiple rows have matching category names, their X-Axis and
Y-Axis field values will be aggregated, and they will be visualized as a
single data point.

You can add multiple columns to the Categories field to create a drill down hierarchy, with level order determined by how the columns are arranged in this field from top to bottom. You can drag and drop columns to rearrange them. Once you have created a drill down hierarchy, the user will be able to click or tap on a data point to reveal all the categories within the next hierarchy level.
Categories field supports the use of field parameters.
If the Categories field contains no data, the visual will use the Legend field to create data points. If neither Categories nor Legend fields are present, the visual will not be able to separate data into data points and instead will display all values as a single data point.
Was this helpful? Thank you for your feedback!
Sorry about that.
How can we improve it?