883
Top Analytics Apps
Top Analytics Apps
Report Author: Norman Reynaldo Sabillon Castro
883
Share template with others
Report submitted for FP20 Analytics ZoomCharts Challenge 18 (August 2024). The report was built with the Mobile Game Analysis dataset and includes ZoomCharts custom Drill Down PRO visuals for Power BI.
Author's description:
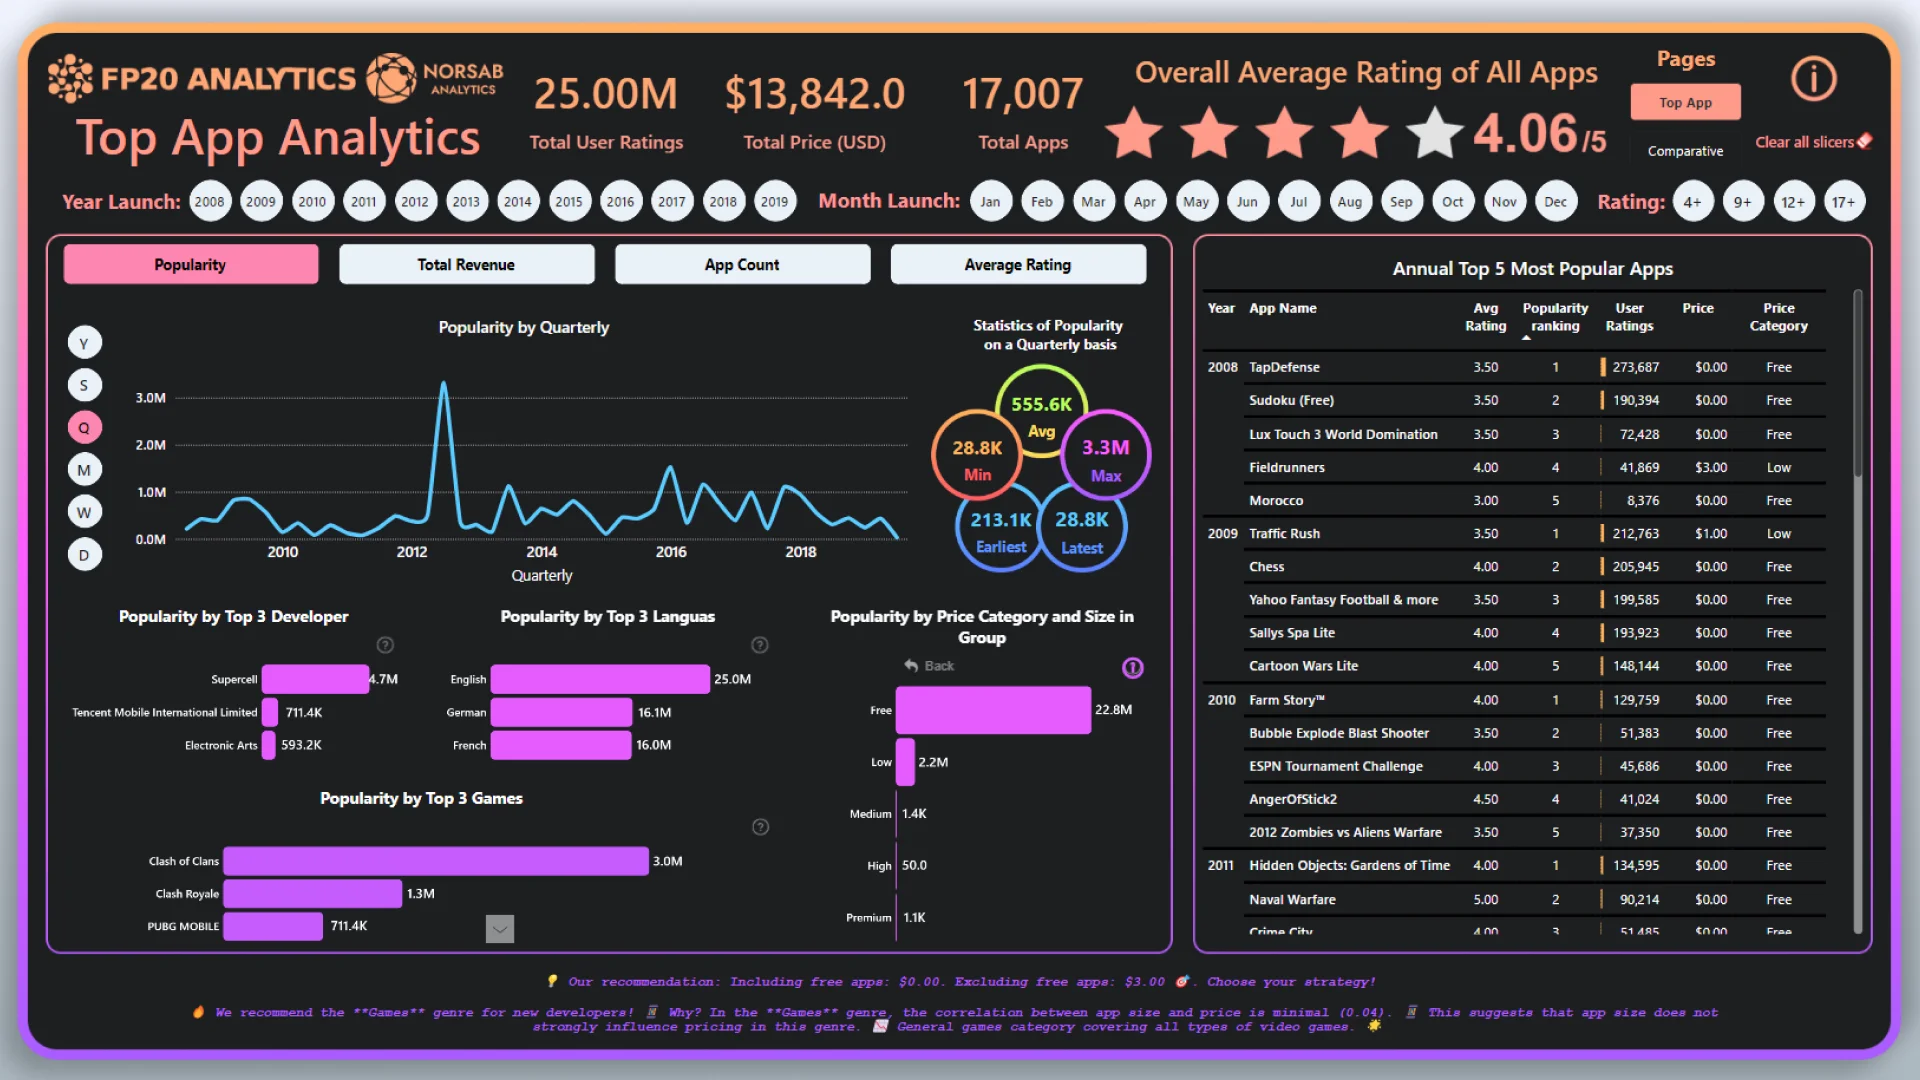
I’ve developed Top App Analytics to give us a clear view of how our apps are performing. This tool helps us understand which apps are the most popular, how much revenue they’re bringing in, and how engaged our users are. You can easily see key metrics like the total number of user ratings, overall sales, and the average ratings across all apps.
The dashboard also allows you to filter by launch year, month, and rating, so you can focus on the data that matters most to you. We’ve included a time-based analysis feature, letting you explore trends over different periods, whether it’s annually, quarterly, or even daily. Additionally, we’ve highlighted the top developers, languages, and apps, along with an analysis of pricing and size categories.
Plus, you can see the top 5 most popular apps each year, along with tailored recommendations based on the insights we’ve gathered.
ZoomCharts visuals used

4U Report Challenges
Participate in data challenges, build and submit reports to get free template downloads.
Join CommunityMobile view allows you to interact with the report. To Download the template please switch to desktop view.
How to use a PBIX template
Preview the interactive report, download the PBIX file, open it in Power BI Desktop, and replace the same data connection with your own dataset.
Preview and download
Explore the report online and download the PBIX template file.
Open in Power BI Desktop
Open the downloaded PBIX file in Power BI Desktop.
Connect your data
Replace the sample data source with your own dataset.
Refresh and adjust
Refresh the model and update fields or visual were needed.
Save and share
Save your report and publish it for your audience.


