4465
Holiday Sales & Campaign ROI Power BIDashboard
Holiday Sales & Campaign ROI Power BIDashboard
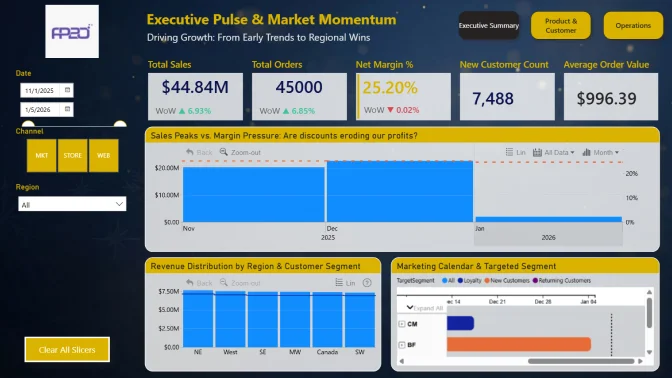
More Report pages
Report Author: Nina Ikpe
4465
Share template with others
Summary
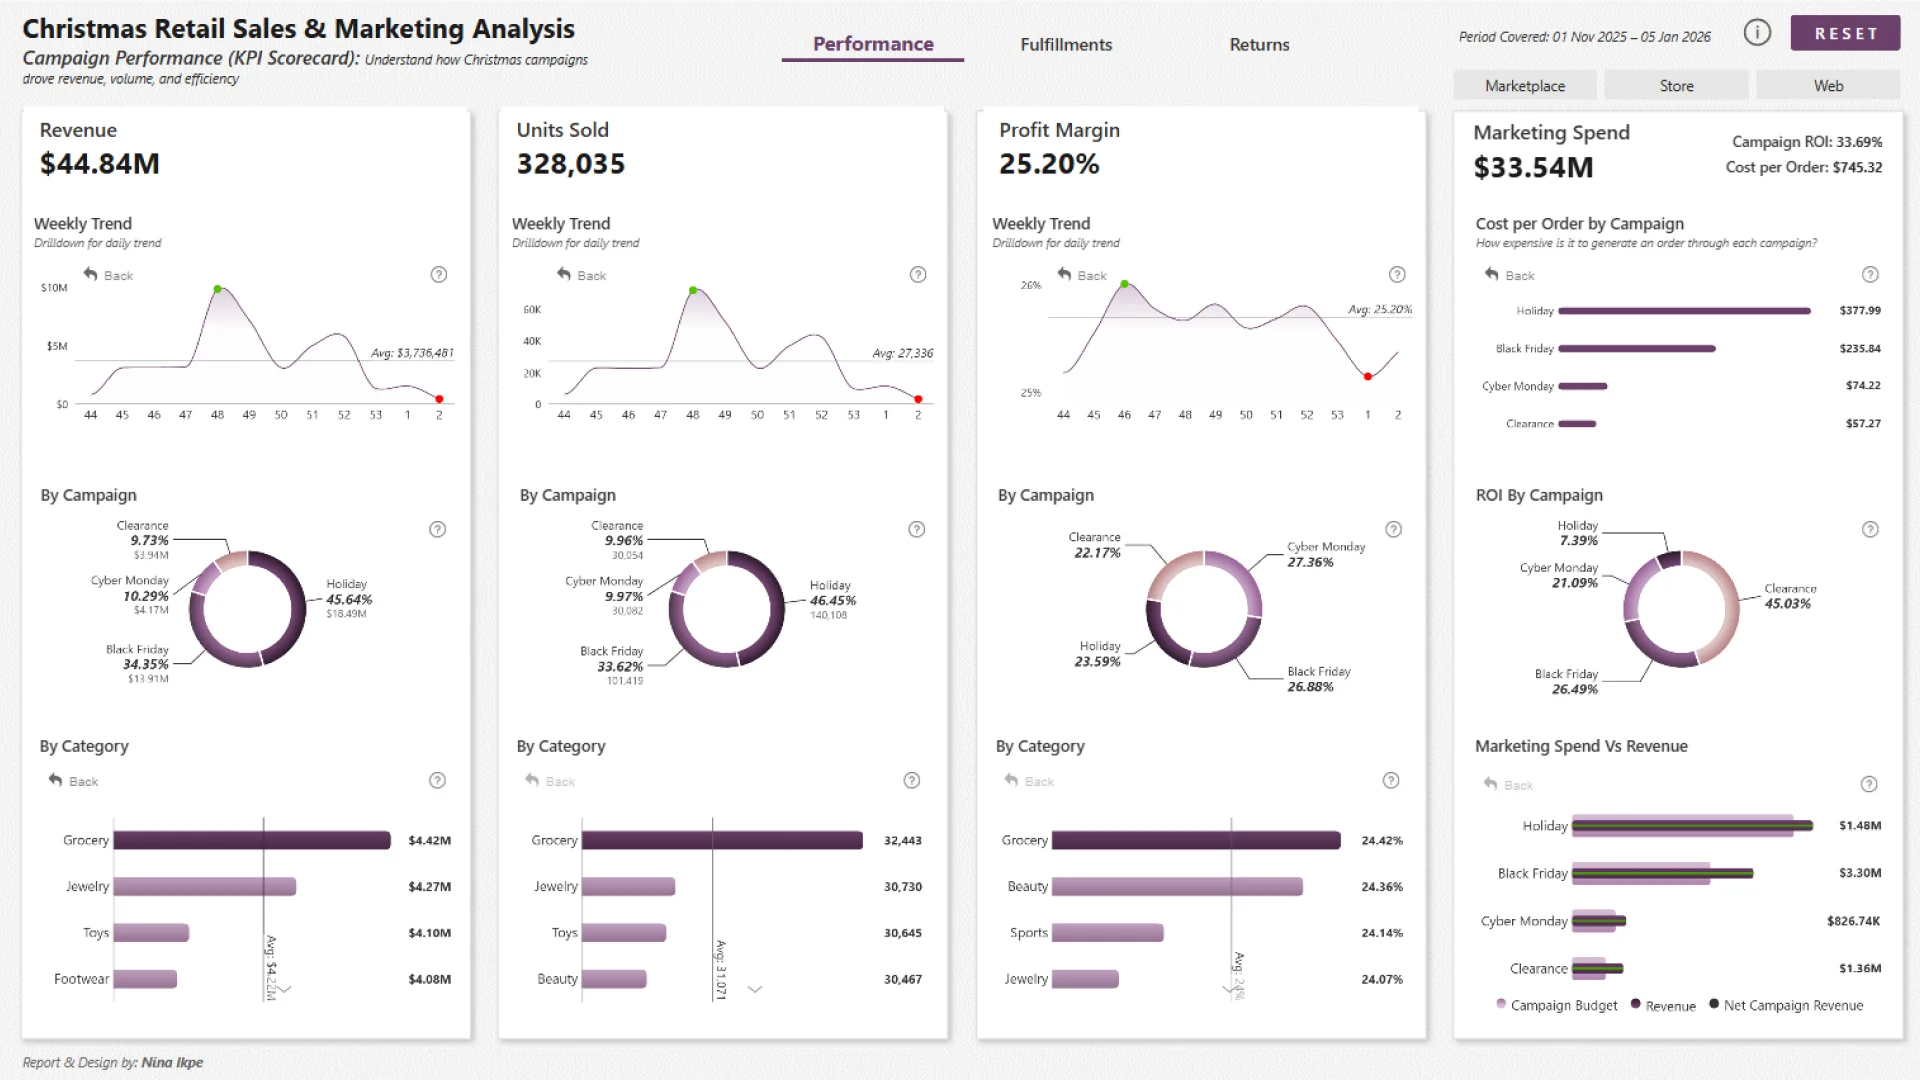
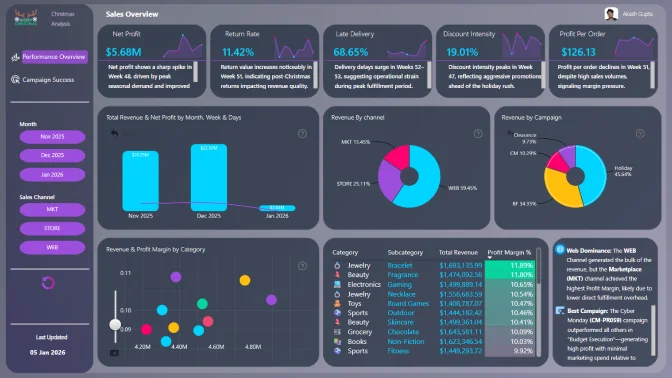
This Power BI holiday sales and campaign performance dashboard analyzes sales, marketing campaigns, fulfillment, and returns during the November–January festive period. It helps retail decision-makers understand what drove seasonal results, where operational problems occurred, and how returns affected revenue and profitability.
The report was created by Nina Ikpe using the Omnichannel Holiday Retail Sales dataset. It was submitted to FP20 Analytics ZoomCharts Data Challenge 33, held from December 2025 to January 2026.
Key Insights of the Power BI Holiday Retail Performance Dashboard
The report is structured in three pages covering campaign performance, fulfillment, and returns. Its main insights include:
- Sales and campaign performance: monitor revenue, quantity sold, profit margin, and campaign ROI
- Promotion and product results: identify which promotions and products performed best during the holiday period
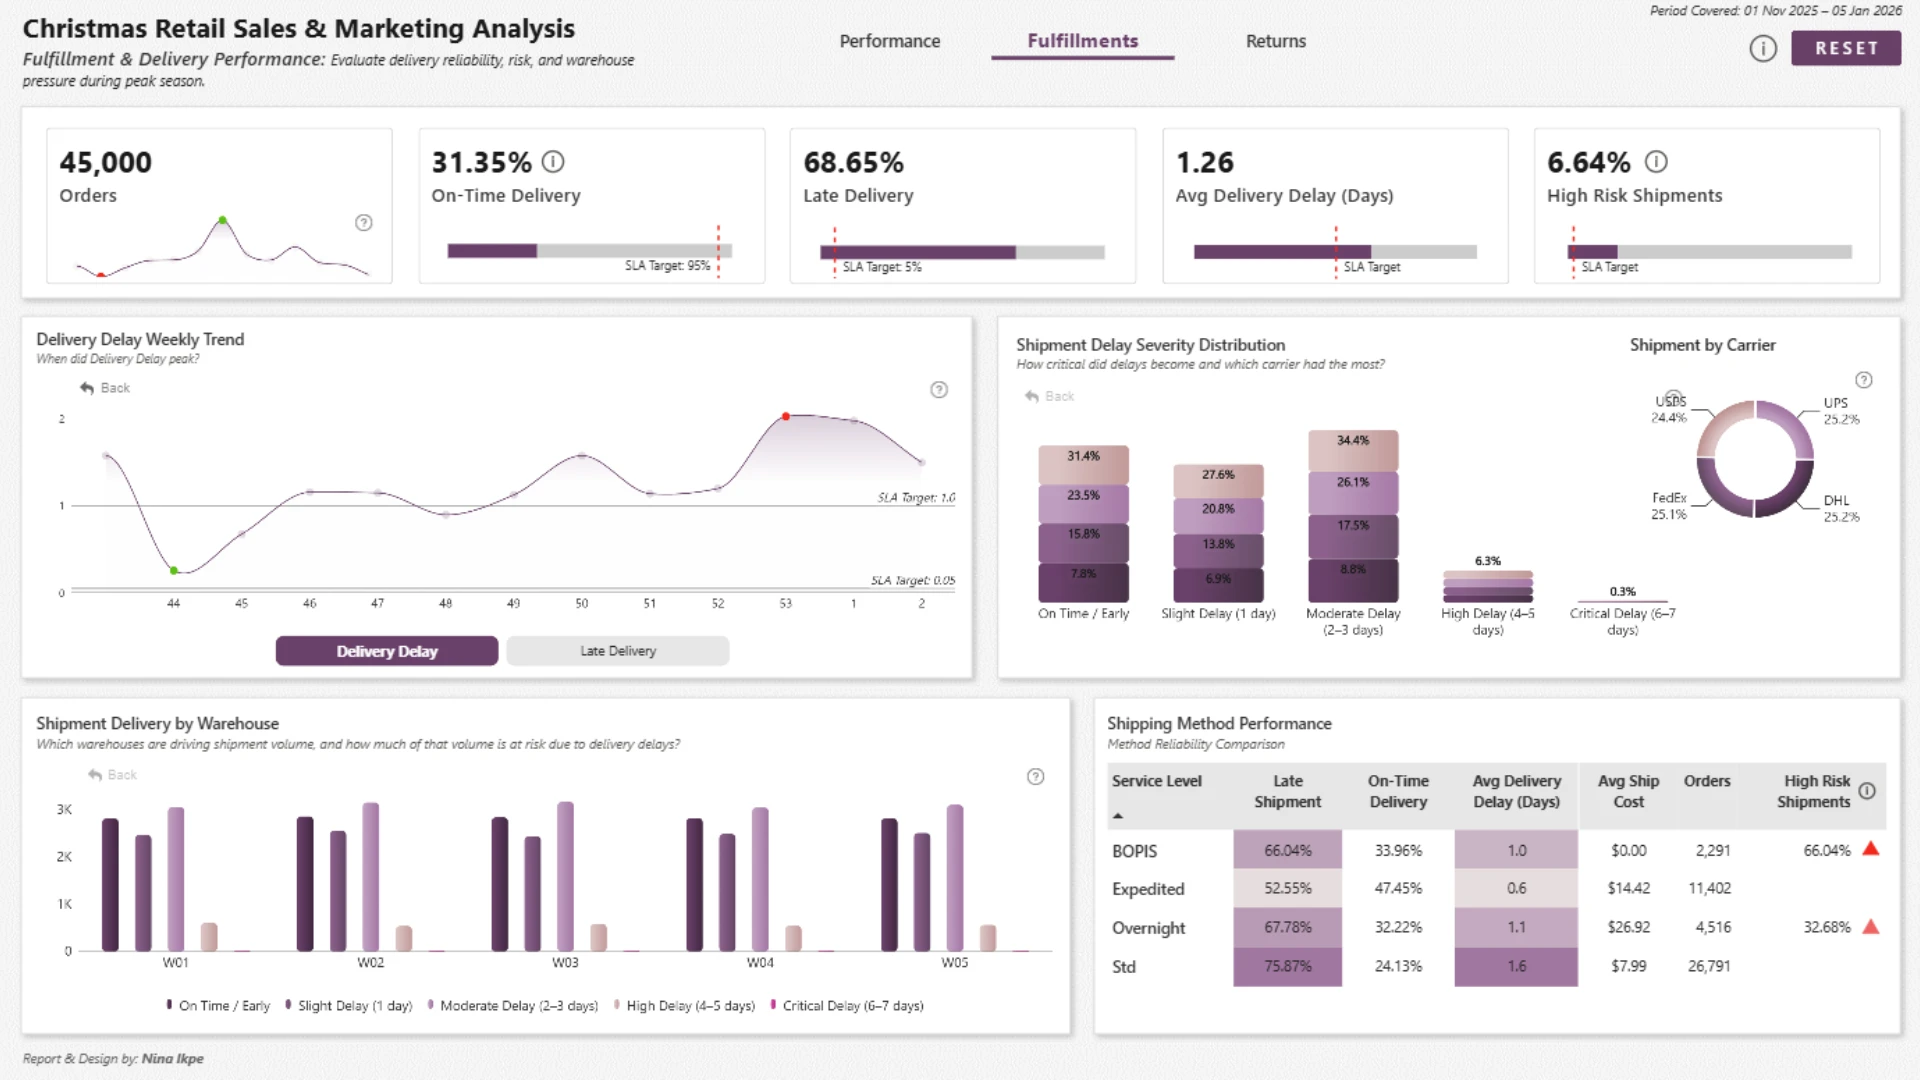
- Delivery performance: analyze on-time delivery, late shipments, and delay severity during peak demand
- Fulfillment operations: investigate warehouse bottlenecks and compare shipping-method performance
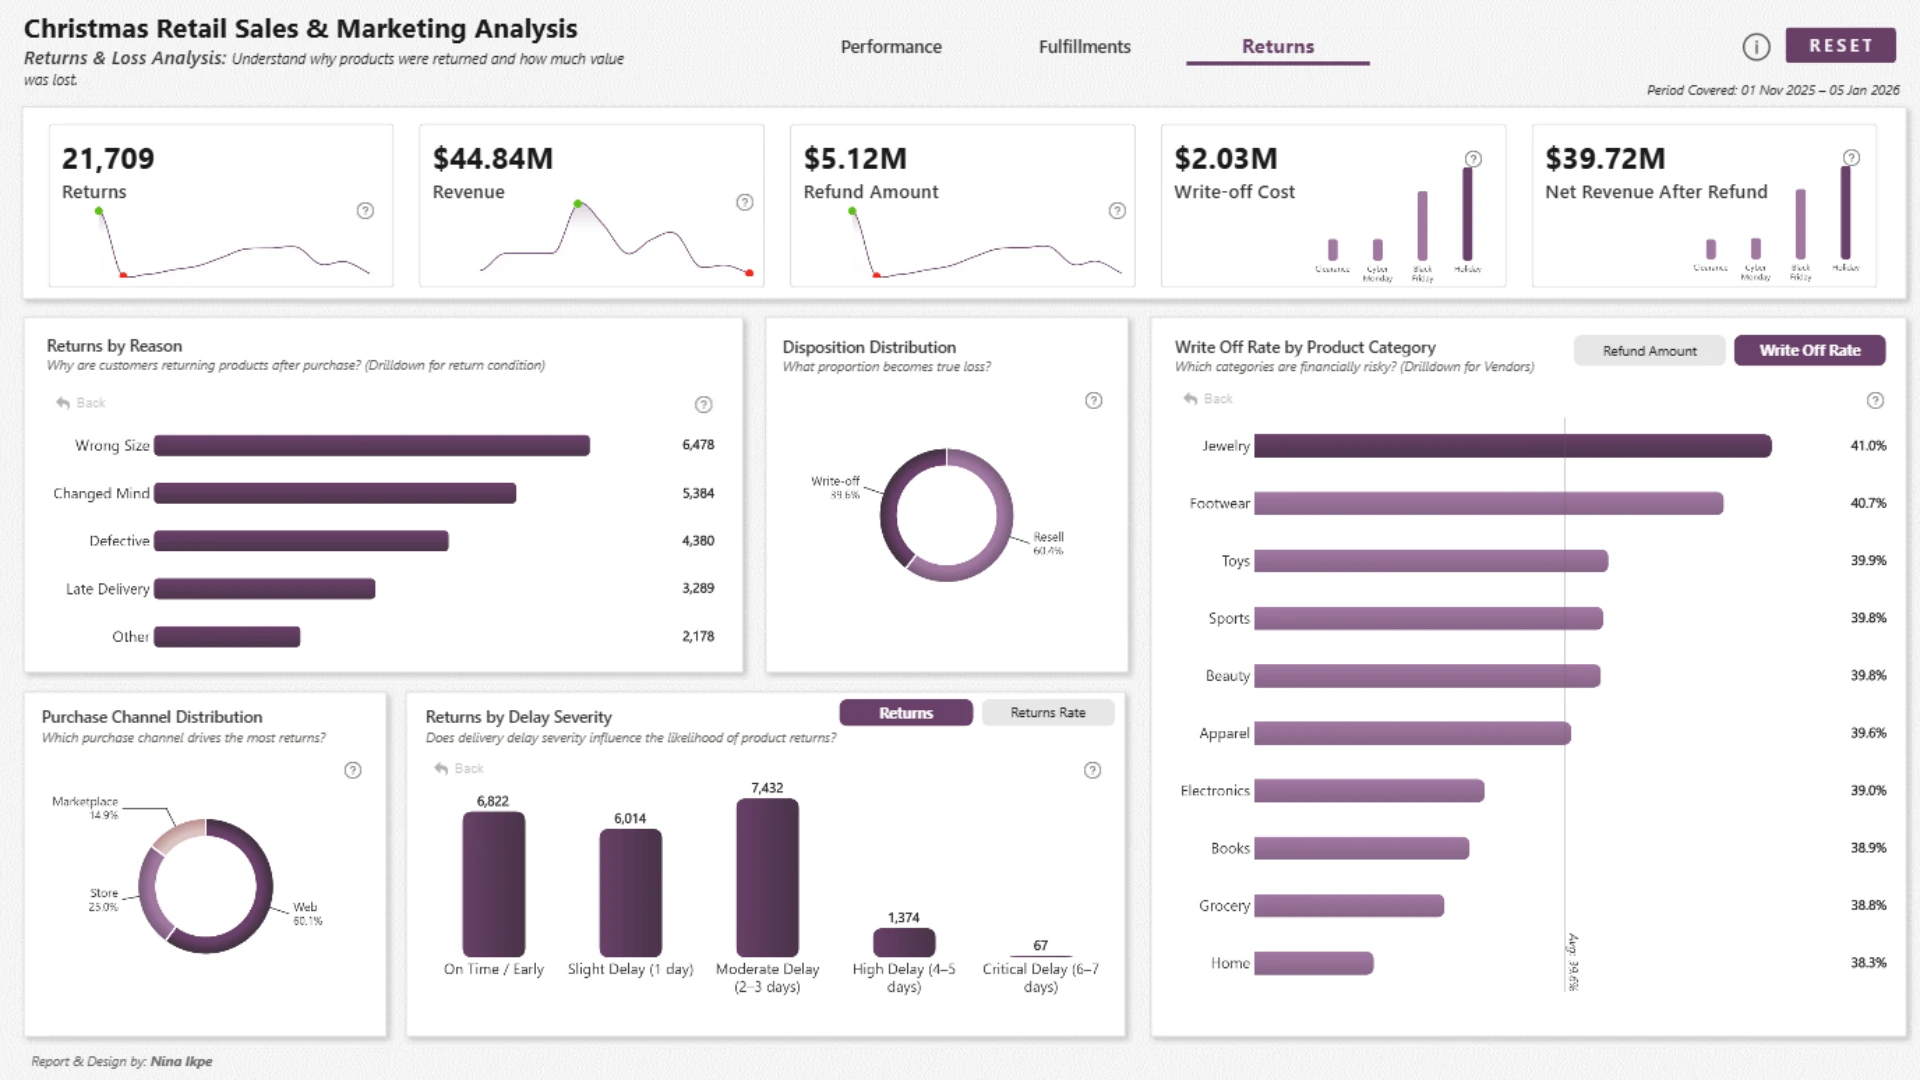
- Returns and losses: examine return rates, reasons for returns, product condition, and write-offs
- Profitability impact: understand where value was created or lost across campaigns, fulfillment, and post-sale activity
Drill Down Combo, Combo Bar, and Donut visuals provide trend, comparison, and category-composition views. Interactive filtering connects marketing, sales, delivery, and returns data, making it easier to investigate performance from multiple perspectives.
How to Use This Power BI Holiday Retail Performance Dashboard
Navigate between the sales and campaign, delivery and fulfillment, and returns and loss pages. Click active chart elements to filter by the available promotions, products, delivery categories, shipping methods, return reasons, or other report dimensions.
Download the PBIX template to review the report structure, calculations, KPI logic, and visual settings in Power BI Desktop. Connect it to your own retail data and adjust the campaign, product, warehouse, fulfillment, and returns fields as needed.



4U Report Challenges
Participate in data challenges, build and submit reports to get free template downloads.
Join CommunityMobile view allows you to interact with the report. To Download the template please switch to desktop view.
How to use a PBIX template
Preview the interactive report, download the PBIX file, open it in Power BI Desktop, and replace the same data connection with your own dataset.
Preview and download
Explore the report online and download the PBIX template file.
Open in Power BI Desktop
Open the downloaded PBIX file in Power BI Desktop.
Connect your data
Replace the sample data source with your own dataset.
Refresh and adjust
Refresh the model and update fields or visual were needed.
Save and share
Save your report and publish it for your audience.


