logo
For Power BI
  • Products
    • Custom Visuals for Power BI
    • Report Templates
  • Resources

      Resources

    • Documentation
    • Report Examples
    • Blog
    • Webinars
    • Video Tutorials
    • Visuals Gallery

    Support

    • ZoomCharts Assistance
    • Contact Sales
    • Contact Support
    • FAQ

    Challenges

    Challenges

    Improve your report creation skills by participating in free challenges for report creators.

    Learn more
    Get Developer License
  • Services
    • Power BI Report Development
    • Custom Visual Development
  • Challenges
  • Pricing
    • Custom Visuals for Power BI
    • Report Templates
Subscribe
Subscribe
Get it now
Go back

Contents

Contest logo
Contest logo
Contest logo
Contest logo
Try Free Now
Go back

Onyx Data May 2024 Challenge

Report Author: Ugochukwu Nwasuruba

33

Technical Support Analysis 5

Report
Report Interact

Combo Combo Bar Map Waterfall Support Customer experience Project Management

Share template with others

Report submitted for Onyx Data DataDNA ZoomCharts Mini Challenge, May 2024. The report was built based on Tech Support Analysis dataset and includes ZoomCharts custom Drill Down PRO visuals for Power BI. 

Author's description:
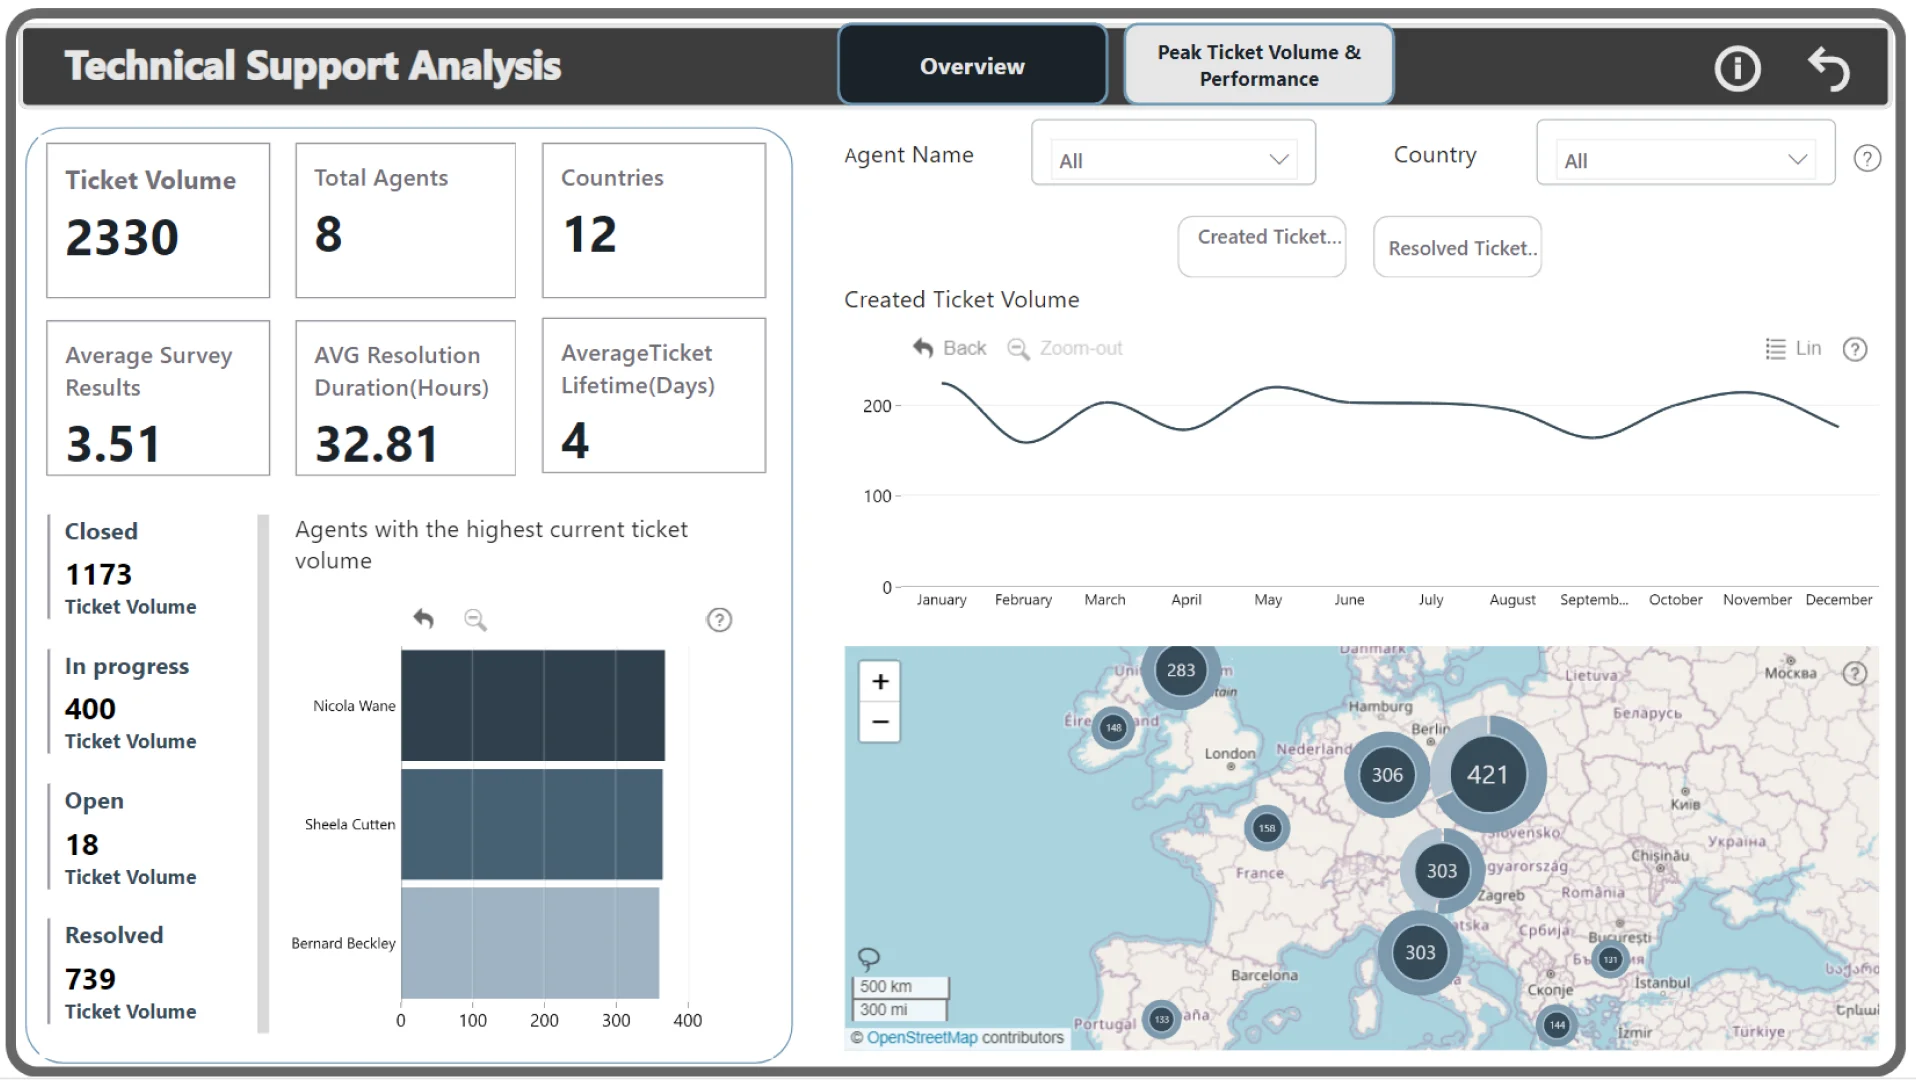
This report looks into various aspects of your technical support operations, offering insights into ticket volume, agent performance, and overall efficiency. Ticket Volume and Trends:
The analysis reveals clear patterns in ticket volume, with weekdays experiencing a significant increase compared to weekends. Within weekdays, a distinct peak emerges at a specific time (3 PM), highlighting potential areas for resource allocation. Ticket volume ranges across a spectrum throughout the week, providing valuable data for staffing and scheduling.
Agent Performance and Customer Satisfaction:
The report evaluates agent performance through two key metrics: average survey results and average number of interactions per agent. This identifies both highly-rated agents like Connor Danielovitch and those with high engagement, such as Michele Whyatt. Customer satisfaction, measured via survey results, is a crucial indicator of support effectiveness. Understanding which product groups or support levels (1st or 2nd line) receive higher satisfaction ratings is valuable.
Additional Support Activities and Considerations:
The report acknowledges the various channels through which agents interact with customers (chat, phone, email). This comprehensive view helps understand the overall workload distribution. Ticket status (open, closed, in progress, resolved) provides valuable insights into support team efficiency and workflow. Analyzing SLA (Service Level Agreement) compliance for first response and resolution times helps identify areas for improvement in meeting customer expectations.
Beyond the Numbers:
The report goes beyond basic metrics to consider customer engagement through topics and priority levels for ticket handling. This uncovers potential areas for knowledge base improvement or proactive support strategies.
Further Exploration:
The report suggests further analysis into specific areas, such as: Distribution of tickets across standard work hours vs. after hours to optimize staffing. Severity distribution of tickets to understand if certain times experience a higher proportion of urgent issues. By analyzing these multiple facets of technical support, this report provides a comprehensive overview that can be used to improve efficiency, enhance customer satisfaction, and optimize resource allocation within your support team.

ZoomCharts visuals used

Drill Down Combo PRO Drill Down Combo PRO
Drill Down Waterfall PRO Drill Down Waterfall PRO
Drill Down Combo Bar PRO Drill Down Combo Bar PRO
Drill Down Map PRO Drill Down Map PRO

Need help?

Send your question to ZoomCharts assistant, and we will respond to you as soon as possible.

Contact Us

Mobile view allows you to interact with the report. To Download the template please switch to desktop view.

Report Overhaul

ZoomCharts Academy

Learn ZoomCharts with experts and become certified!

Go to Academy!
Report Overhaul

Was this helpful? Thank you for your feedback!

Sorry about that.

How can we improve it?

Technical Support Analysis 5

Share

ZoomCharts

Welcome to ZoomCharts

You’re almost there! Create an account to keep your saved reports.

or
Sign up with Microsoft

Verify your email address

We have sent a code to your email address. Please input the code below.

Didn't receive code? Request again (after 30 seconds)

Already have an account? Log in

ZoomCharts

Log in to your ZoomCharts account

Log in with Microsoft
or
Forgot password?

Reset your password

We'll email you instructions on how to reset your password

Don't have an account? Sign up

Please add credits

You have 0 available downloads.
Get more credits or upgrade your plan to continue.

View pricing
logo
[email protected]
+44 204 577 3993
logo

Products

Drill Down Network PRO Drill Down Waterfall PRO Drill Down Graph PRO Drill Down Combo PRO Drill Down Combo Bar PRO Drill Down Donut PRO Drill Down Pie PRO Drill Down TimeSeries PRO Drill Down Timeline PRO Drill Down Map PRO Drill Down Scatter PRO All Visuals

Resources

Report Examples Webinars Blog ZoomCharts Academy Visuals Gallery Documentation Custom Visual Development Subscribe to News

Solutions

Custom Visual Development

Company

Pricing About Us Partners Leave feedback Join PowerGroup EU Funding

Help

ZoomCharts Assistance Contact Sales Contact Support FAQ

Drill Down Network PRO Drill Down Waterfall PRO Drill Down Graph PRO Drill Down Combo PRO Drill Down Combo Bar PRO Drill Down Donut PRO Drill Down Pie PRO Drill Down TimeSeries PRO Drill Down Timeline PRO Drill Down Map PRO Drill Down Scatter PRO All Visuals

Report Examples Webinars Blog ZoomCharts Academy Visuals Gallery Documentation Custom Visual Development Subscribe to News

Custom Visual Development

Pricing About Us Partners Leave feedback Join PowerGroup EU Funding

ZoomCharts Assistance Contact Sales Contact Support FAQ
+44 204 577 3993
[email protected]

Ready to get in touch?

Contact our experts with any question about Power BI and ZoomCharts for Free!

Contact us

© 2025, Data Visualization Software Lab

U.S. Patents No. 11,645,343; 11,921,804; 12,346,389

Cookies
Privacy Policy
Global
Legal
Patent
warning

Error message

success

Success info: Done!

ZoomCharts AI Assistant

We noticed you're using an old OS version.

For the best experience, we recommend upgrading to ensure that all website features display correctly.

Cookie settings

We use necessary cookies for site functionality, as well as statistic, marketing, and preference cookies to enhance your experience. For more information and to manage your preferences, please visit our Cookie policy