731
Student Performance Power BI Report 11
Student Performance Power BI Report 11

More Report pages
Report Author: Nico Rohner
731
Share template with others
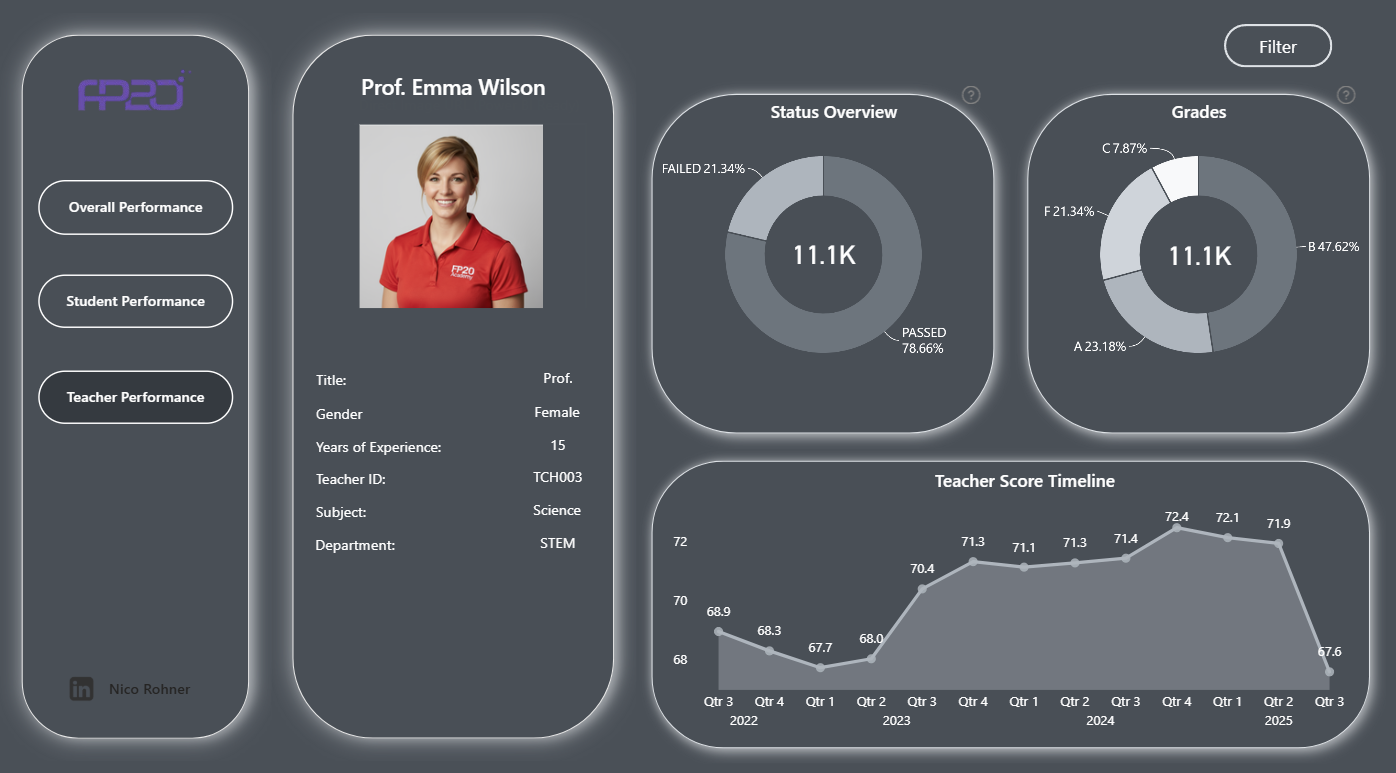
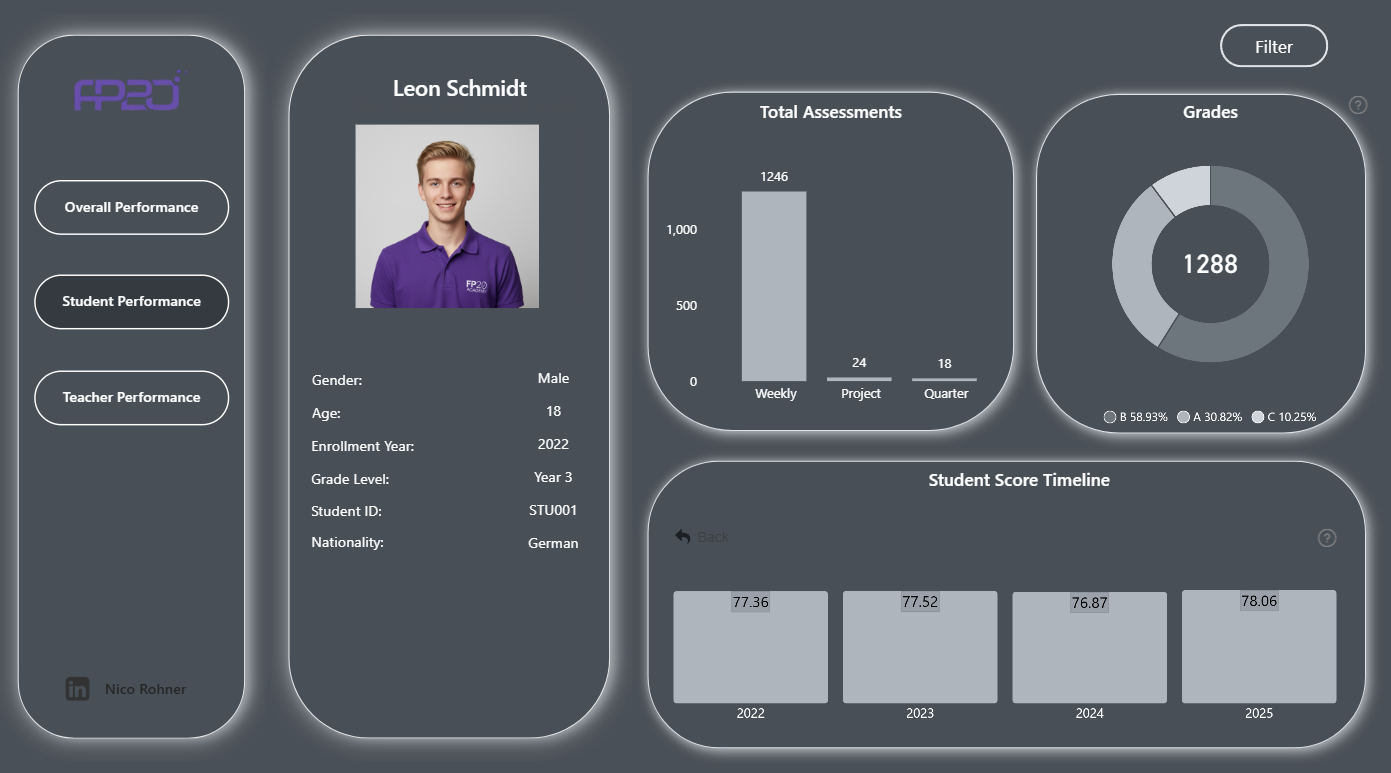
This Power BI report uses the Education/Student Performance dataset and features ZoomCharts Drill Down PRO custom visuals for Power BI. It was submitted to the FP20 Analytics ZoomCharts Data Challenge 31 in October 2025.
Author Description:
I am participating in the FP20 Analytics ZoomCharts Challenge 31, where I developed an interactive Power BI dashboard that visualizes educational performance from three key perspectives: Overall Performance, Student Performance, and Teacher Performance. The dashboard highlights institutional trends, student progress, and teacher effectiveness through dynamic visuals and interactive filtering. It enables users to explore data on enrollment, assessments, grades, and performance timelines in an intuitive and engaging way. Special thanks to Federico Pastor and ZoomCharts for fostering innovation through data.
4U Report Challenges
Participate in data challenges, build and submit reports to get free template downloads.
Join CommunityMobile view allows you to interact with the report. To Download the template please switch to desktop view.


Was this helpful? Thank you for your feedback!
Sorry about that.
How can we improve it?