891
Sport Injuries Analysis
Sport Injuries Analysis
More Report pages
Report Author: Vincensius Prasetyo Adi
891
Share template with others
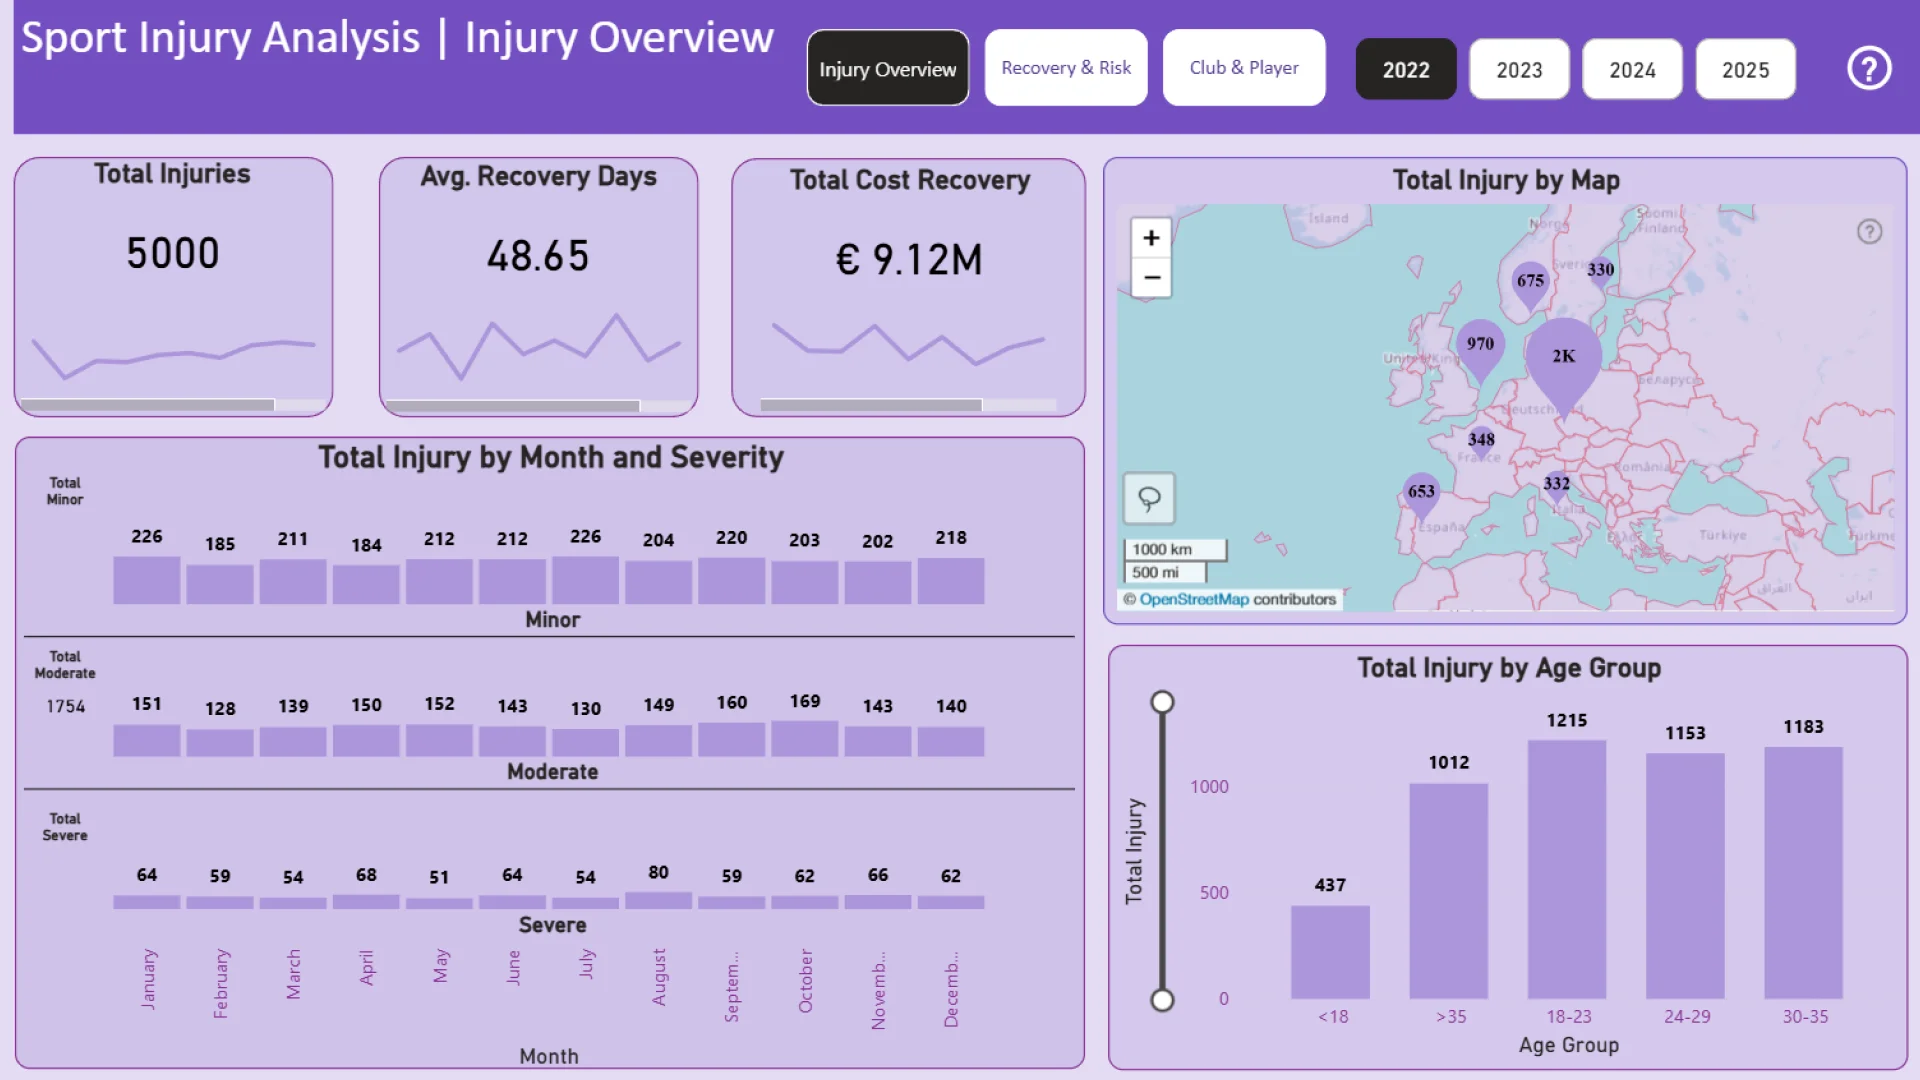
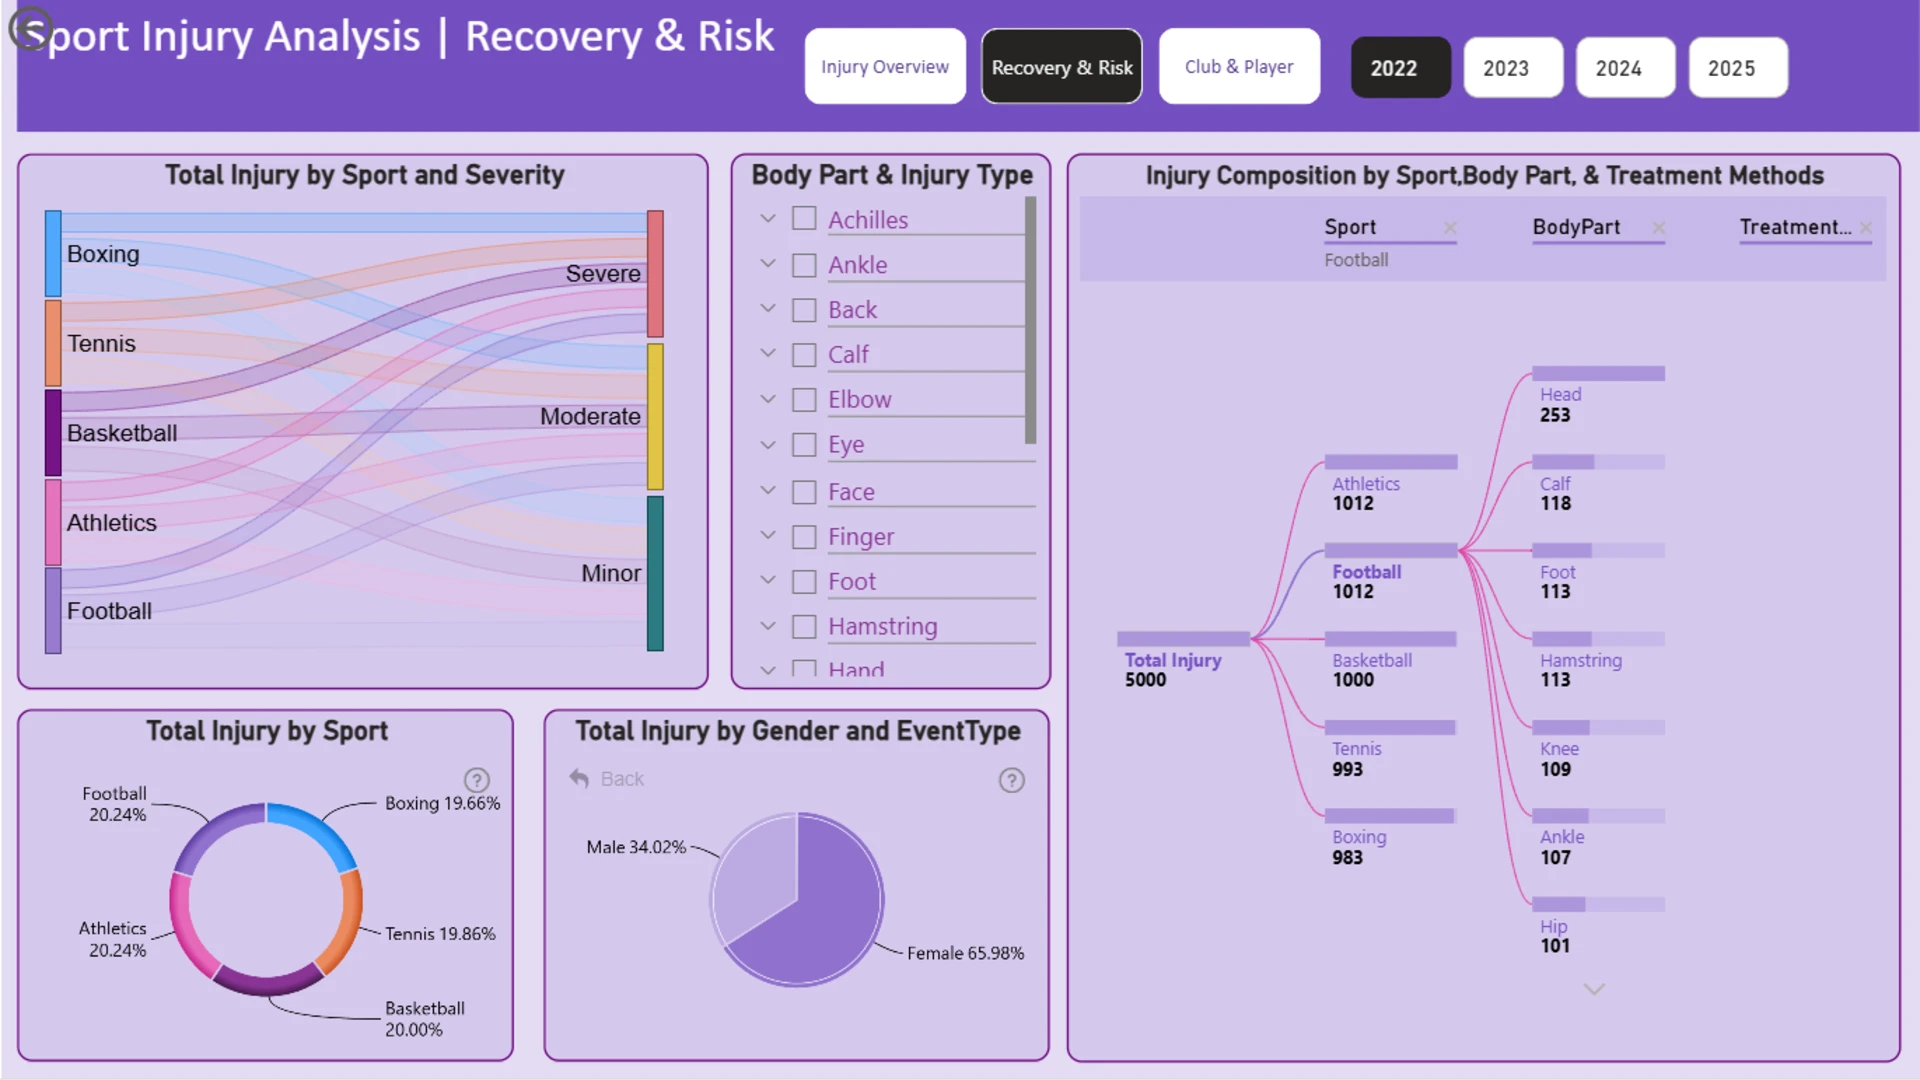
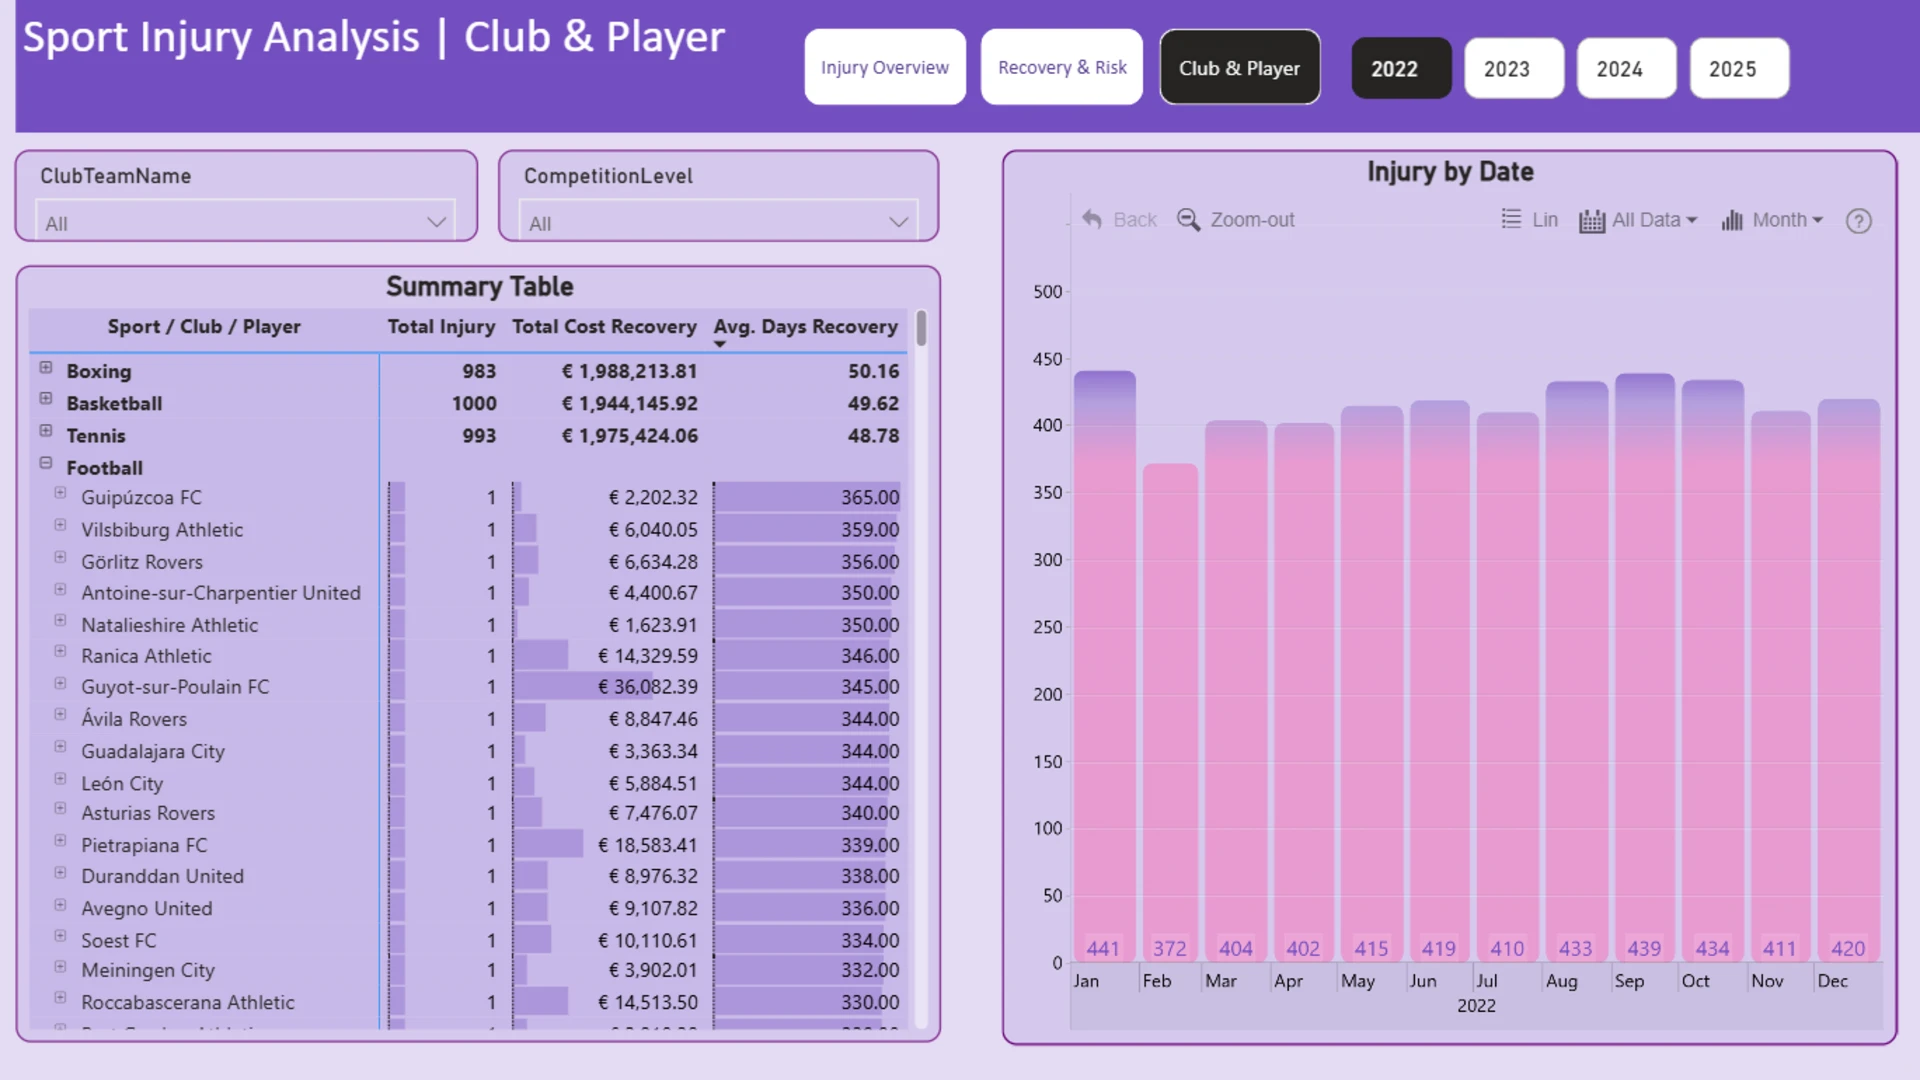
This Power BI report uses the Athlete Health and Injury dataset and features ZoomCharts Drill Down PRO custom visuals for Power BI. It was submitted to the FP20 Analytics ZoomCharts Data Challenge in August 2025.
Author's Description:
I am excited to share my submission for FP20 Analytics Challenge 29. Using Power BI and DAX, I analyzed athlete injury data to uncover key trends across injuries, recovery, and costs. Findings show that France recorded the most injuries, female athletes faced higher risks, and athletics had the highest injury rate, while 2024 marked the longest recovery times. The analysis also highlights the most costly clubs, players with the highest individual recovery expenses, and the longest recovery duration.
ZoomCharts visuals used
4U Report Challenges
Participate in data challenges, build and submit reports to get free template downloads.
Join CommunityMobile view allows you to interact with the report. To Download the template please switch to desktop view.


Was this helpful? Thank you for your feedback!
Sorry about that.
How can we improve it?