52873
Power BI Marketing Content Analysis Dashboard Example
Power BI Marketing Content Analysis Dashboard Example
More Report pages
Report Author: Mariia Drobina
52873
Share template with others
Summary
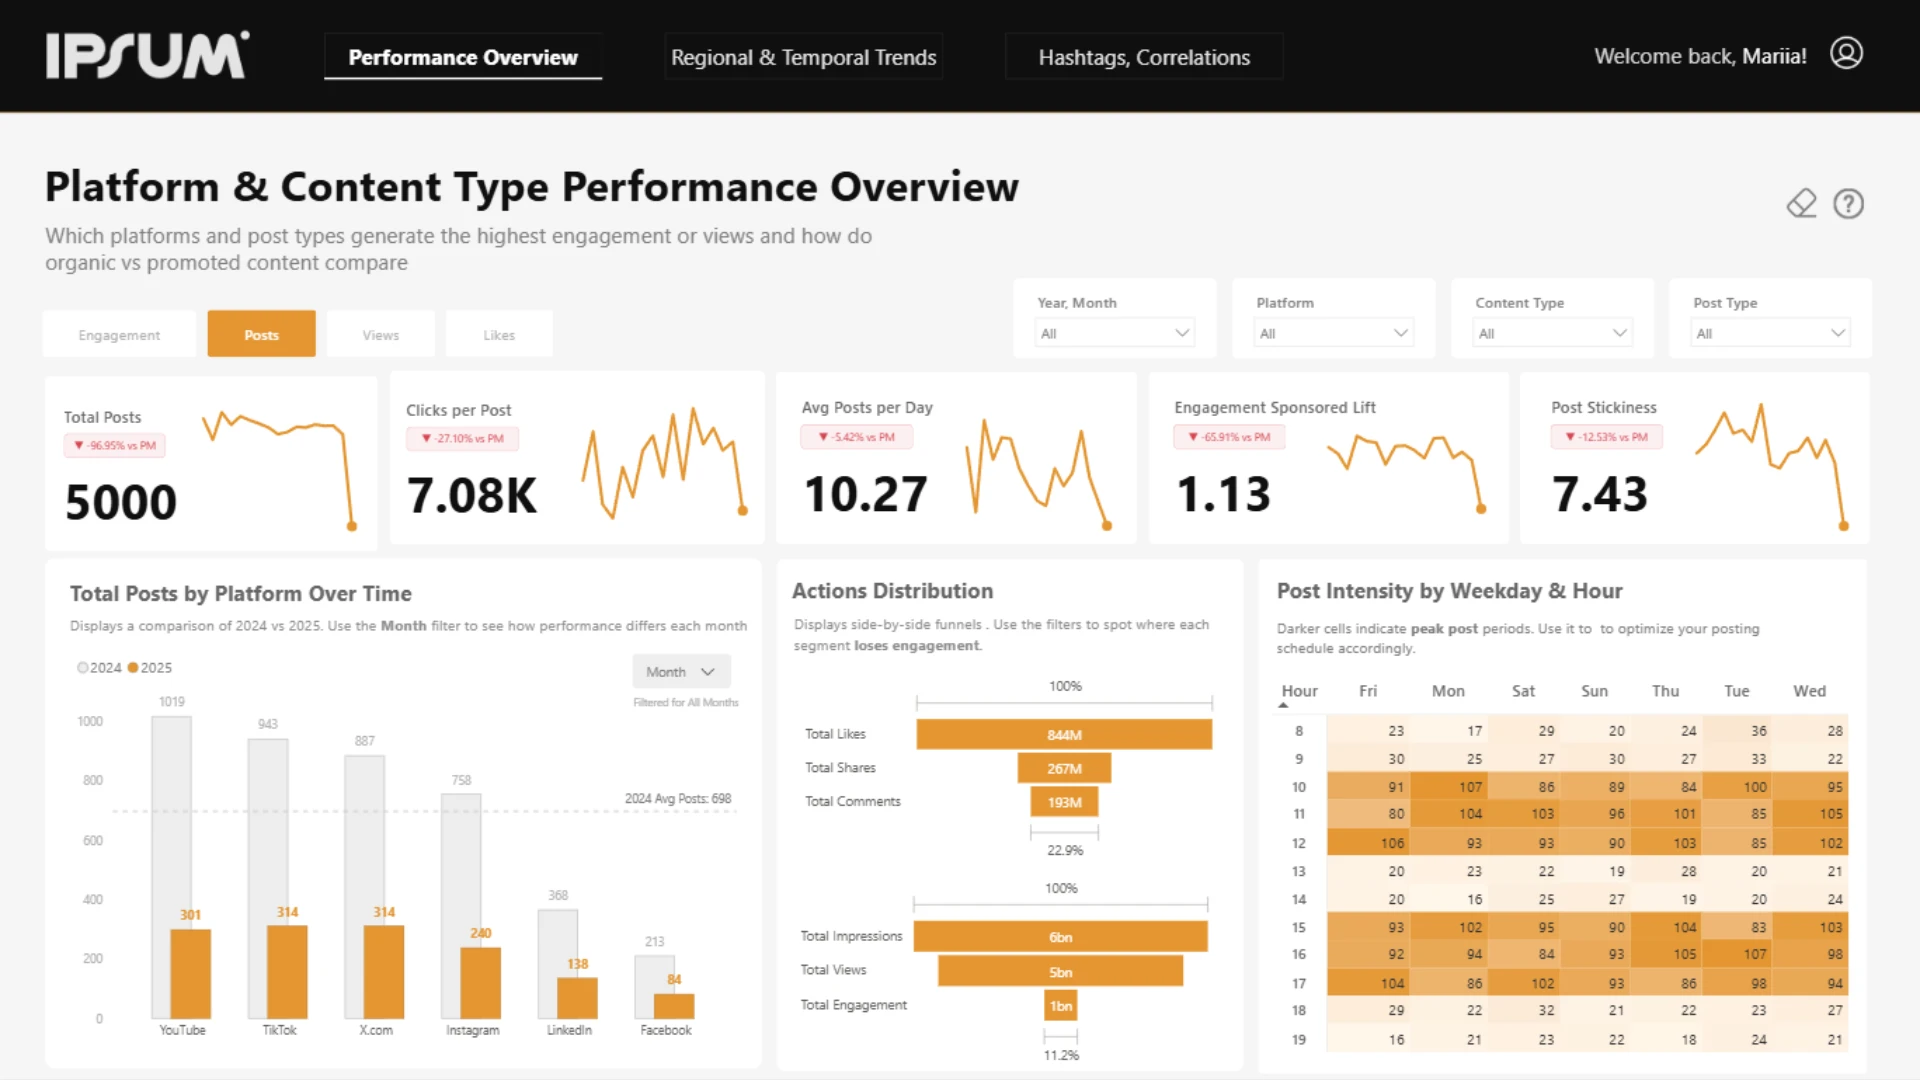
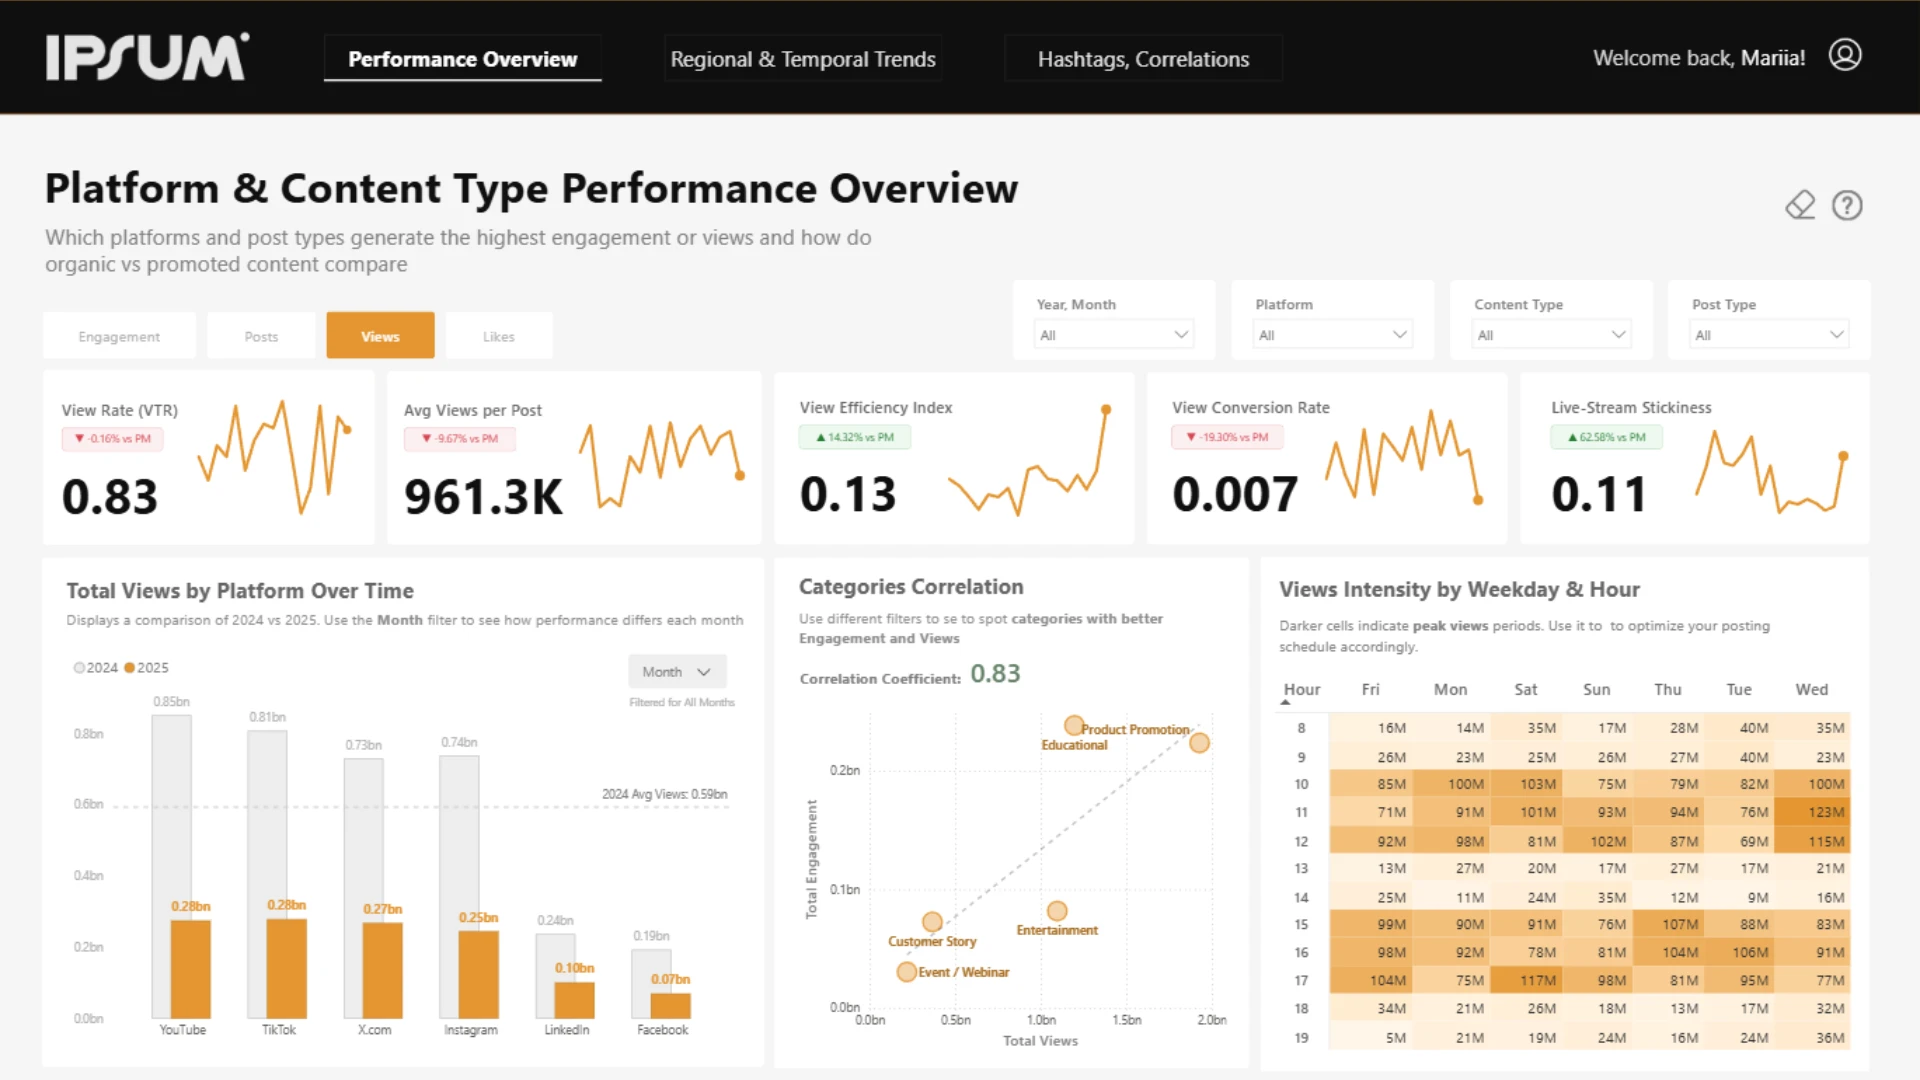
This social media marketing content performance report analyzes how platforms, content types, post formats, timing, and geography affect marketing results. Built in Power BI, it compares engagement, views, likes, and posting activity across YouTube, TikTok, X.com, Instagram, LinkedIn, and Facebook.
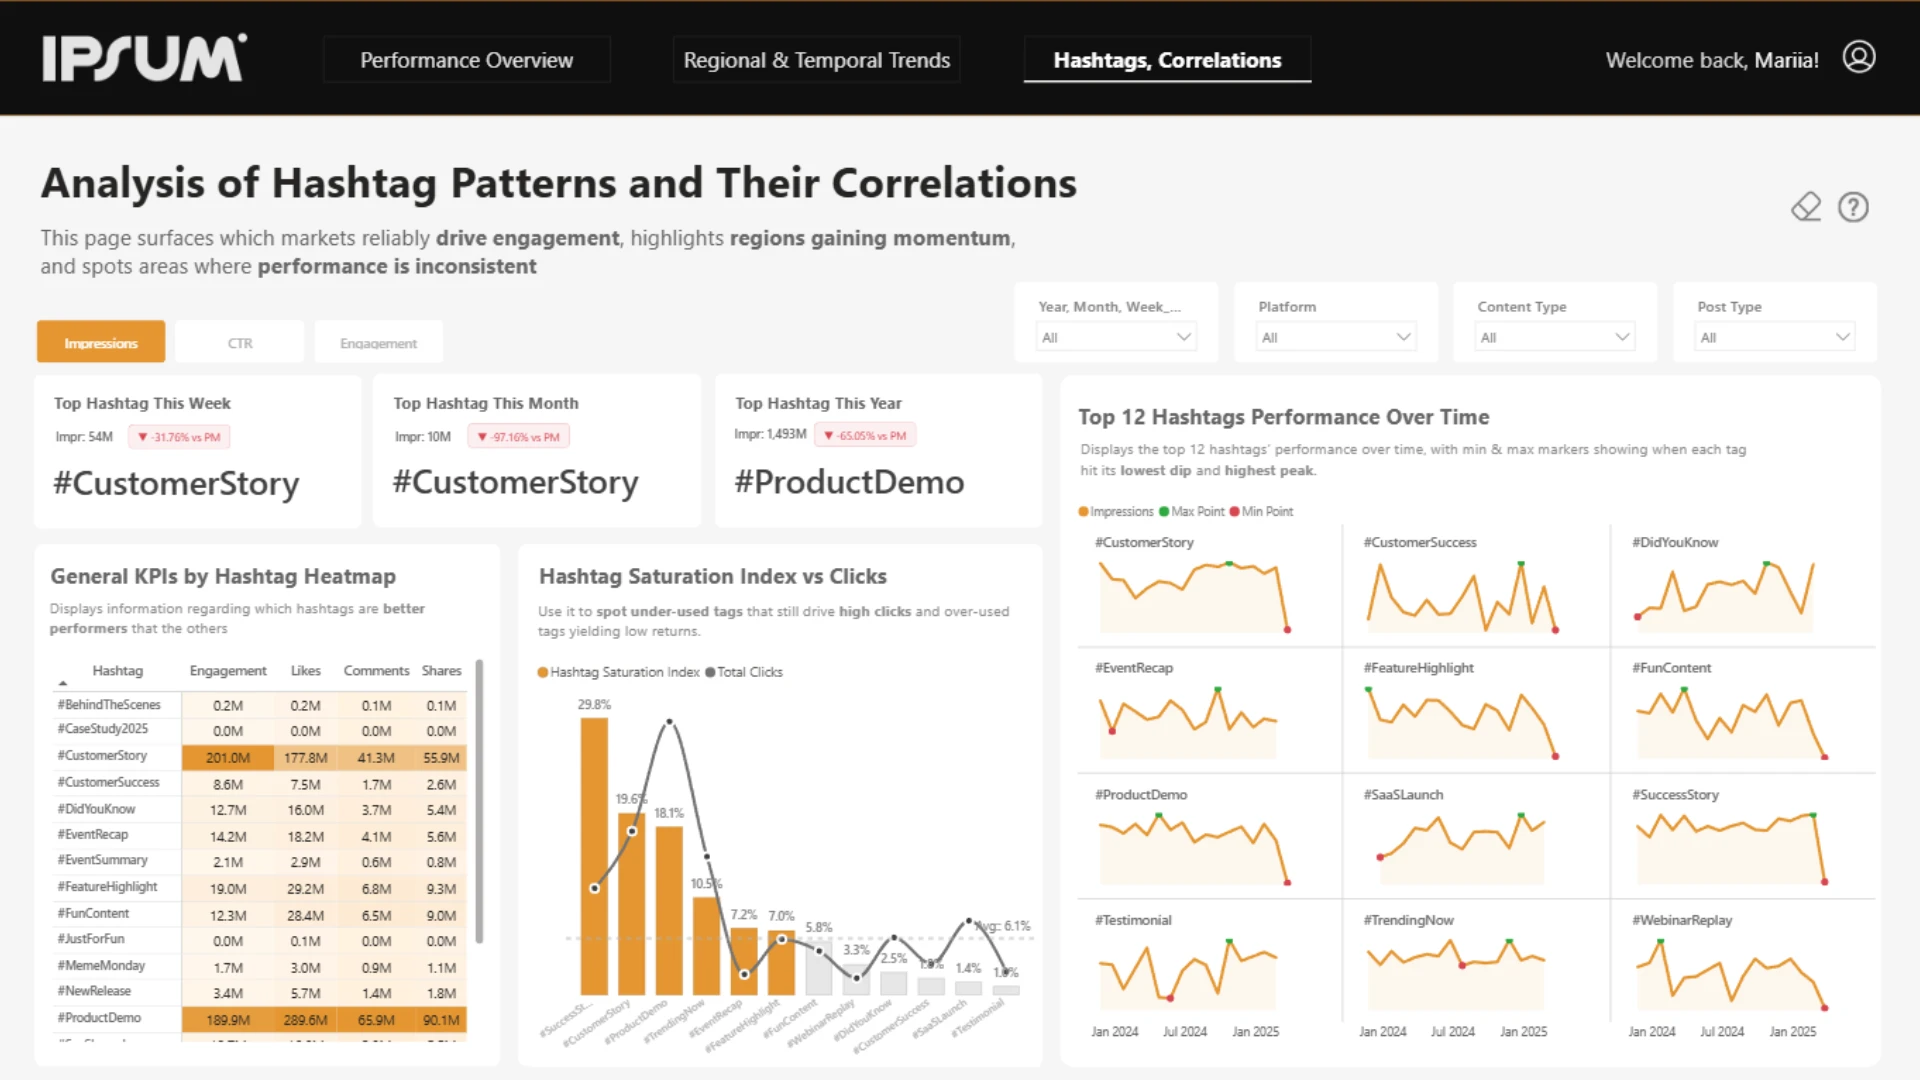
The report is organized into three main sections: Performance Overview, Regional & Temporal Trends, and Hashtags & Correlations.
Key Insights of the Social Media Content Performance Report
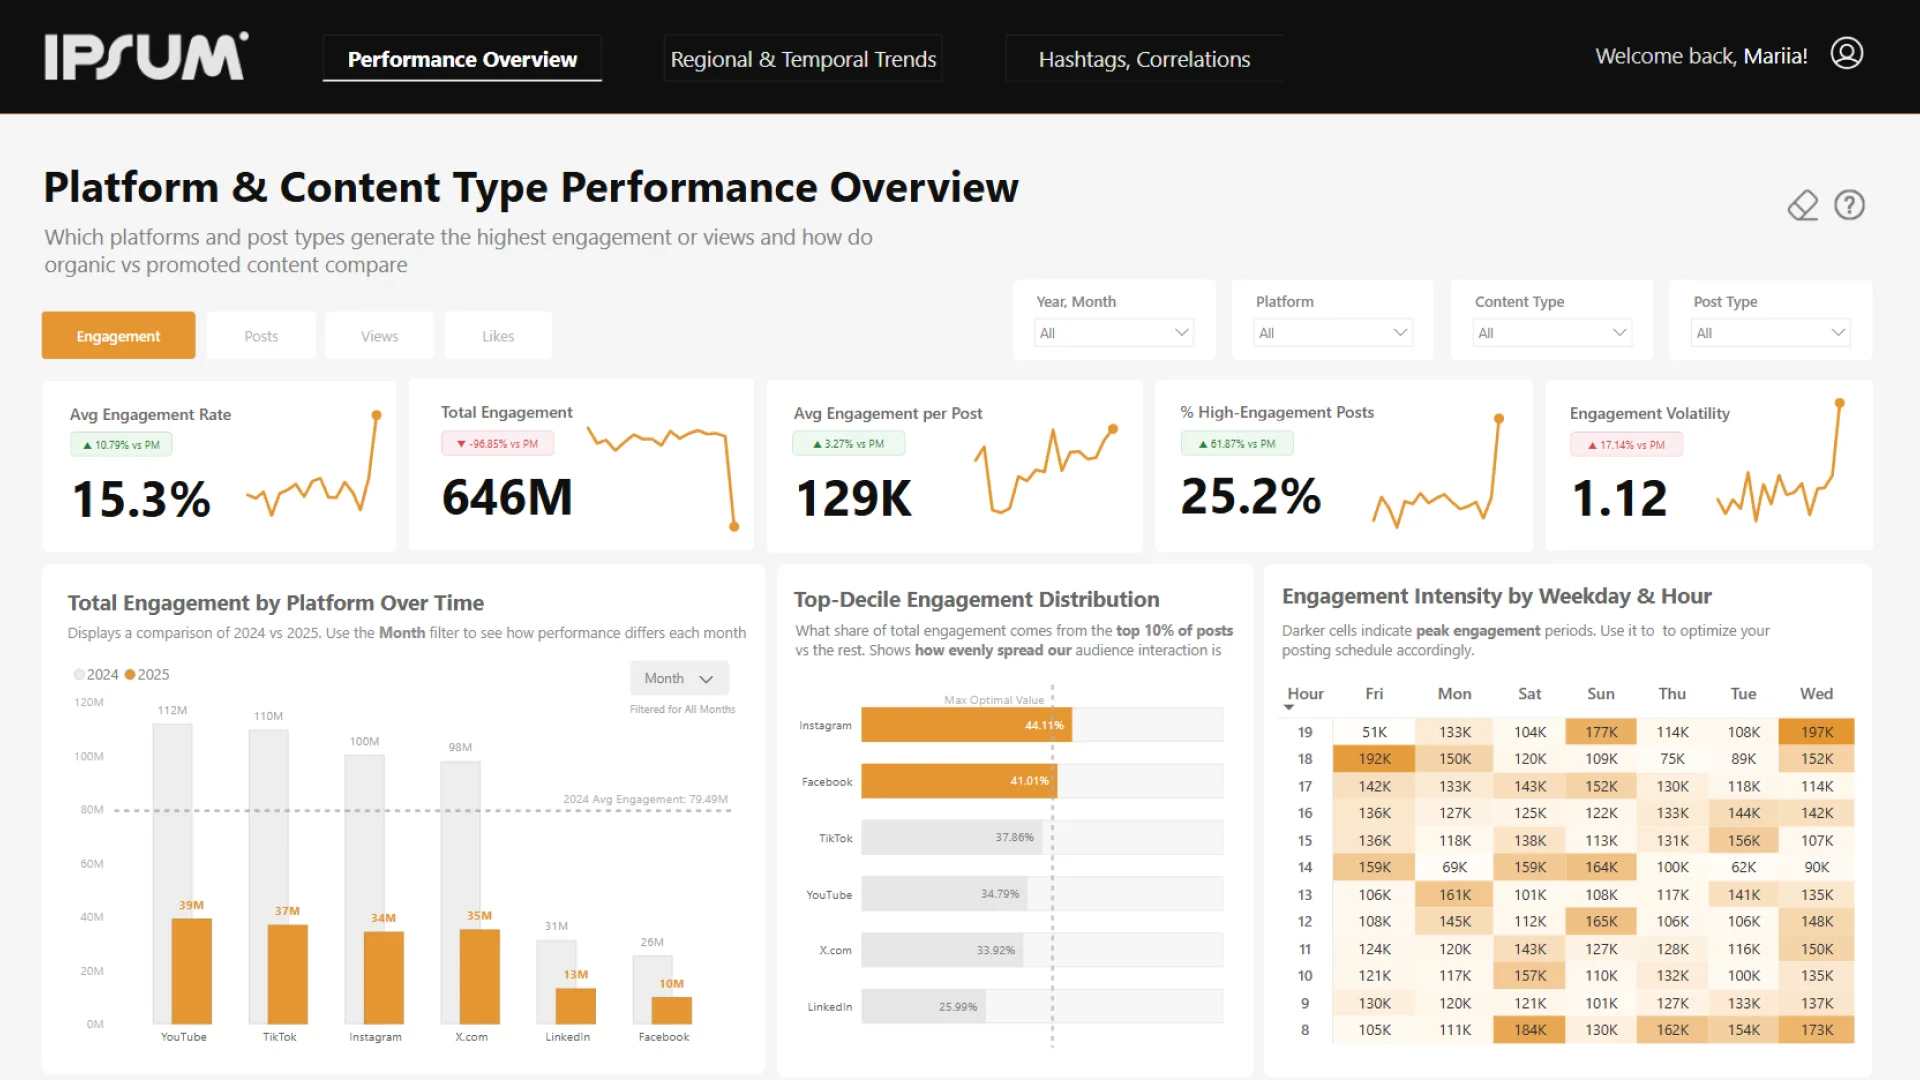
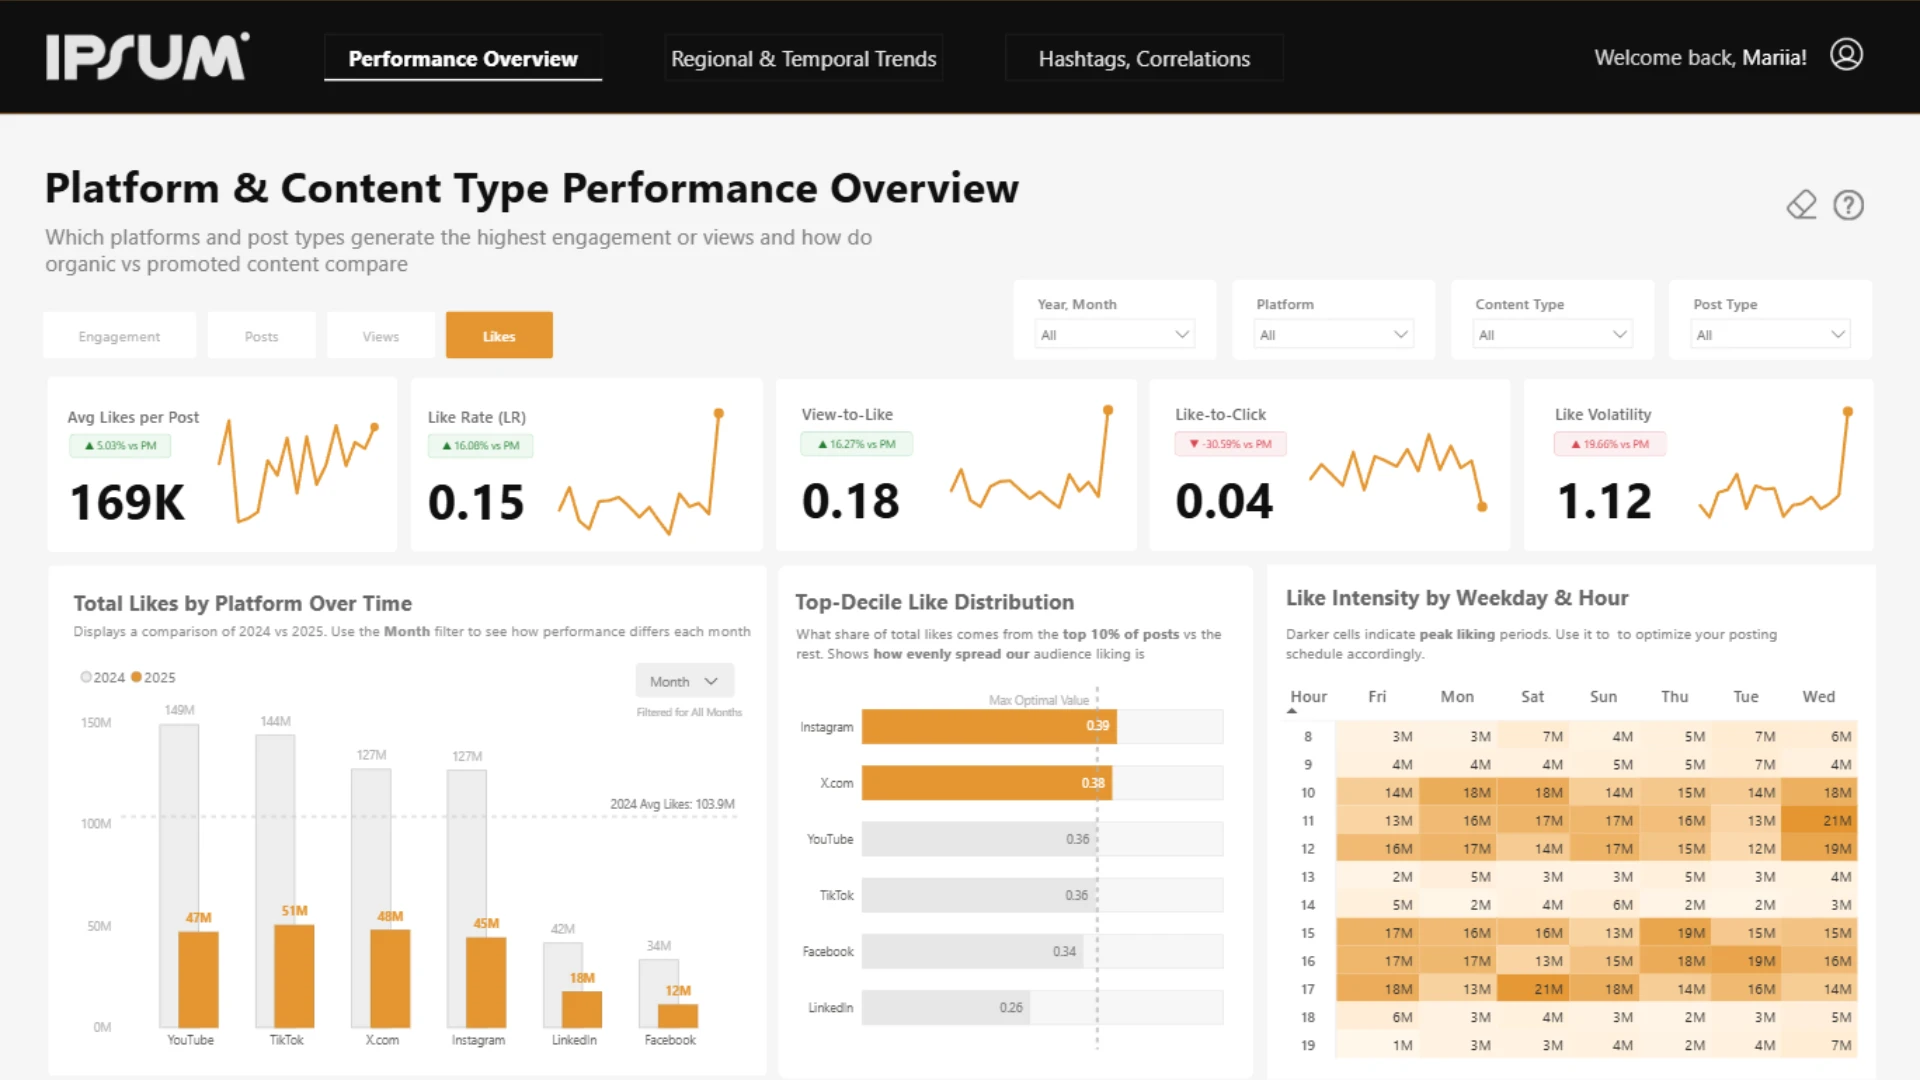
The Performance Overview allows users to switch between engagement, posts, views, and likes. The report provides insights including:
- Platform performance: compare total engagement, views, likes, and posting activity across six social media platforms
- Content performance: analyze post types and content categories, including product promotions, educational content, customer stories, entertainment, and events or webinars
- Engagement KPIs: review average engagement rate, total engagement, engagement per post, high-engagement post share, and engagement volatility
- View and like efficiency: monitor average views or likes per post, conversion rates, efficiency measures, and performance volatility
- Performance over time: compare platform results between 2024 and 2025 and use the month filter for more focused analysis
- Posting-time analysis: identify peak engagement, viewing, and liking periods by weekday and hour
- Top-performing content: see how much engagement or likes come from the top 10% of posts on each platform
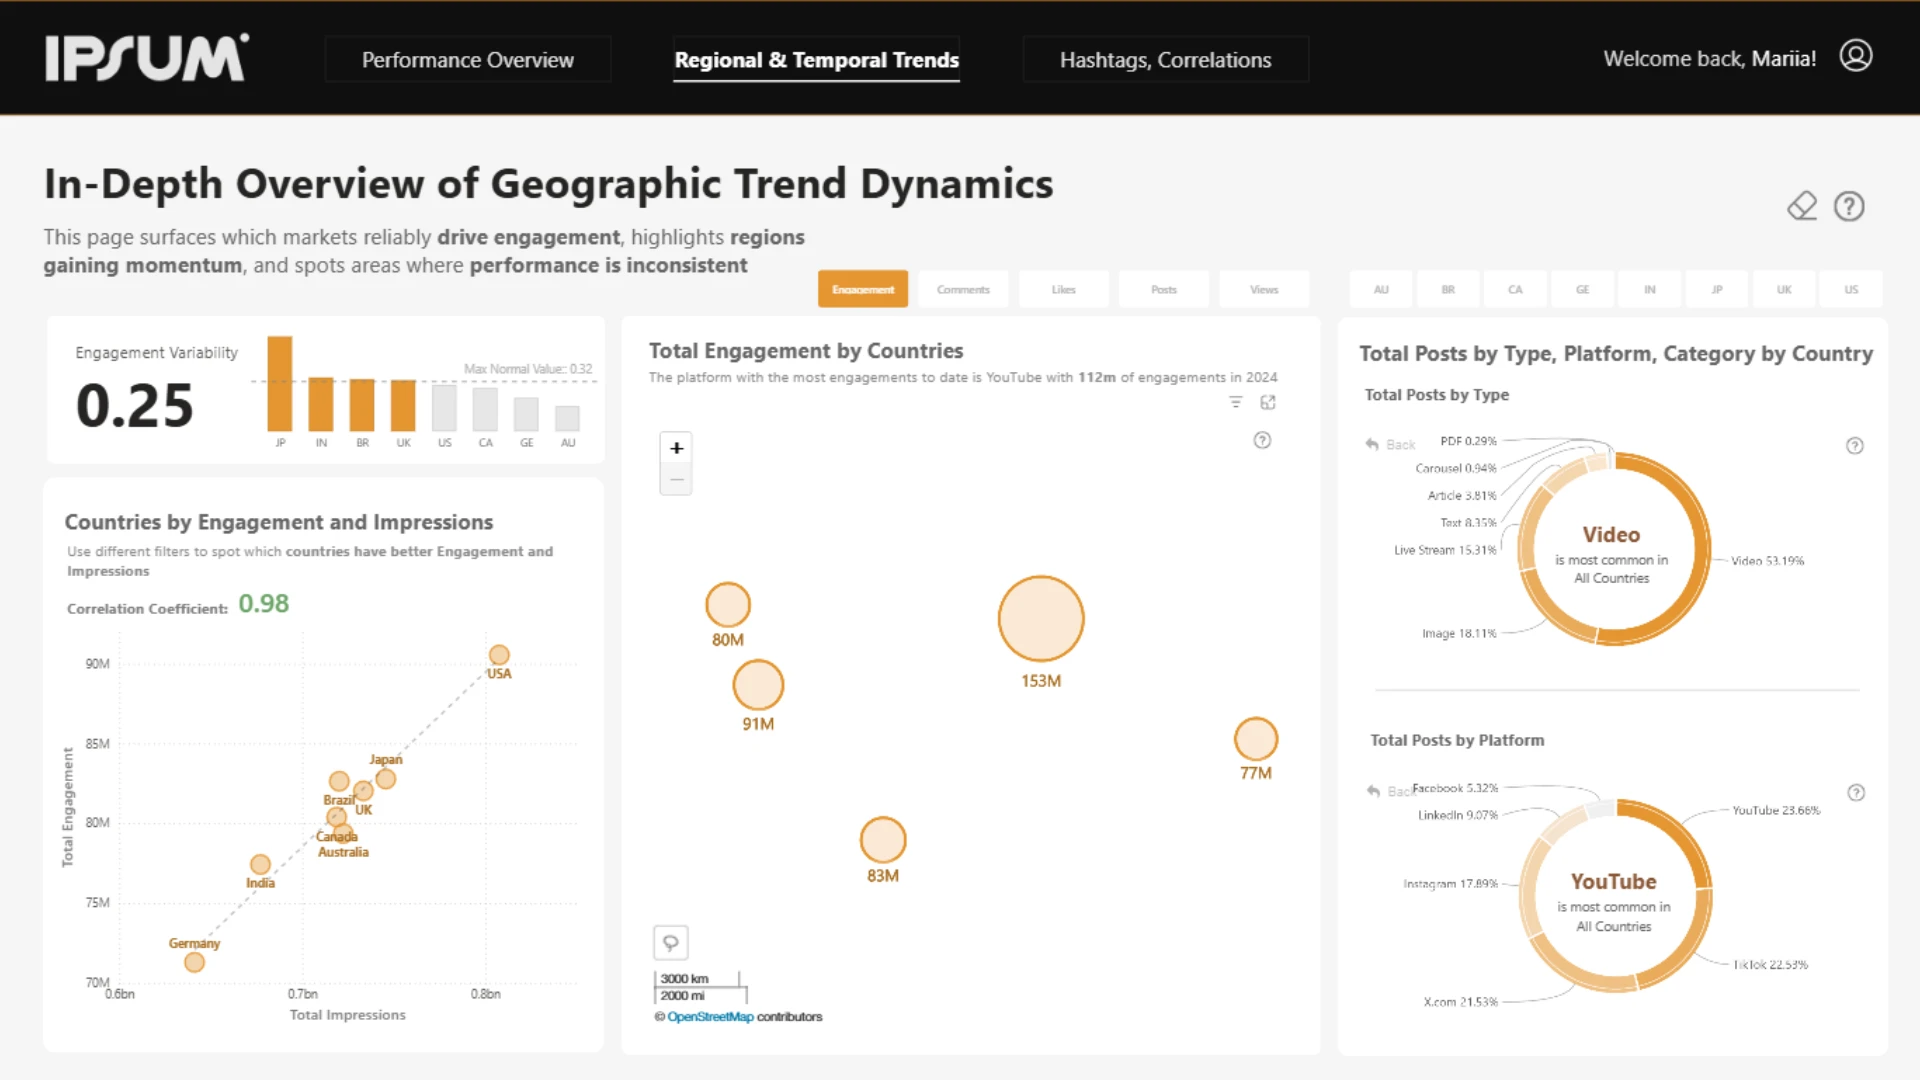
- Regional performance: compare countries by engagement, impressions, content mix, platform use, and performance variability
Interactive charts, heatmaps, correlation plots, geographic maps, and drill-down visuals help users examine social media performance from multiple perspectives.
How to Use This Marketing Content Performance Dashboard Template
Download the PBIX template to customize it and connect it to your own data, or use it as inspiration by reusing its layout and visual elements in your next Power BI design.


4U Report Challenges
Participate in data challenges, build and submit reports to get free template downloads.
Join CommunityMobile view allows you to interact with the report. To Download the template please switch to desktop view.
How to use a PBIX template
Preview the interactive report, download the PBIX file, open it in Power BI Desktop, and replace the same data connection with your own dataset.
Preview and download
Explore the report online and download the PBIX template file.
Open in Power BI Desktop
Open the downloaded PBIX file in Power BI Desktop.
Connect your data
Replace the sample data source with your own dataset.
Refresh and adjust
Refresh the model and update fields or visual were needed.
Save and share
Save your report and publish it for your audience.


