1299
E-Commerce Dashboard 2
E-Commerce Dashboard 2
Report Author: Vishal Motirale
1299
Share template with others
This Power BI report uses the e-commerce sales dataset from a global software retailer that sells subscriptions and add-ons across analytics, design, collaboration, and AI. The report features ZoomCharts Drill Down PRO custom visuals for Power BI. It was submitted to the Onyx Data DataDNA ZoomCharts Mini Challenge in October 2025.
Author description:
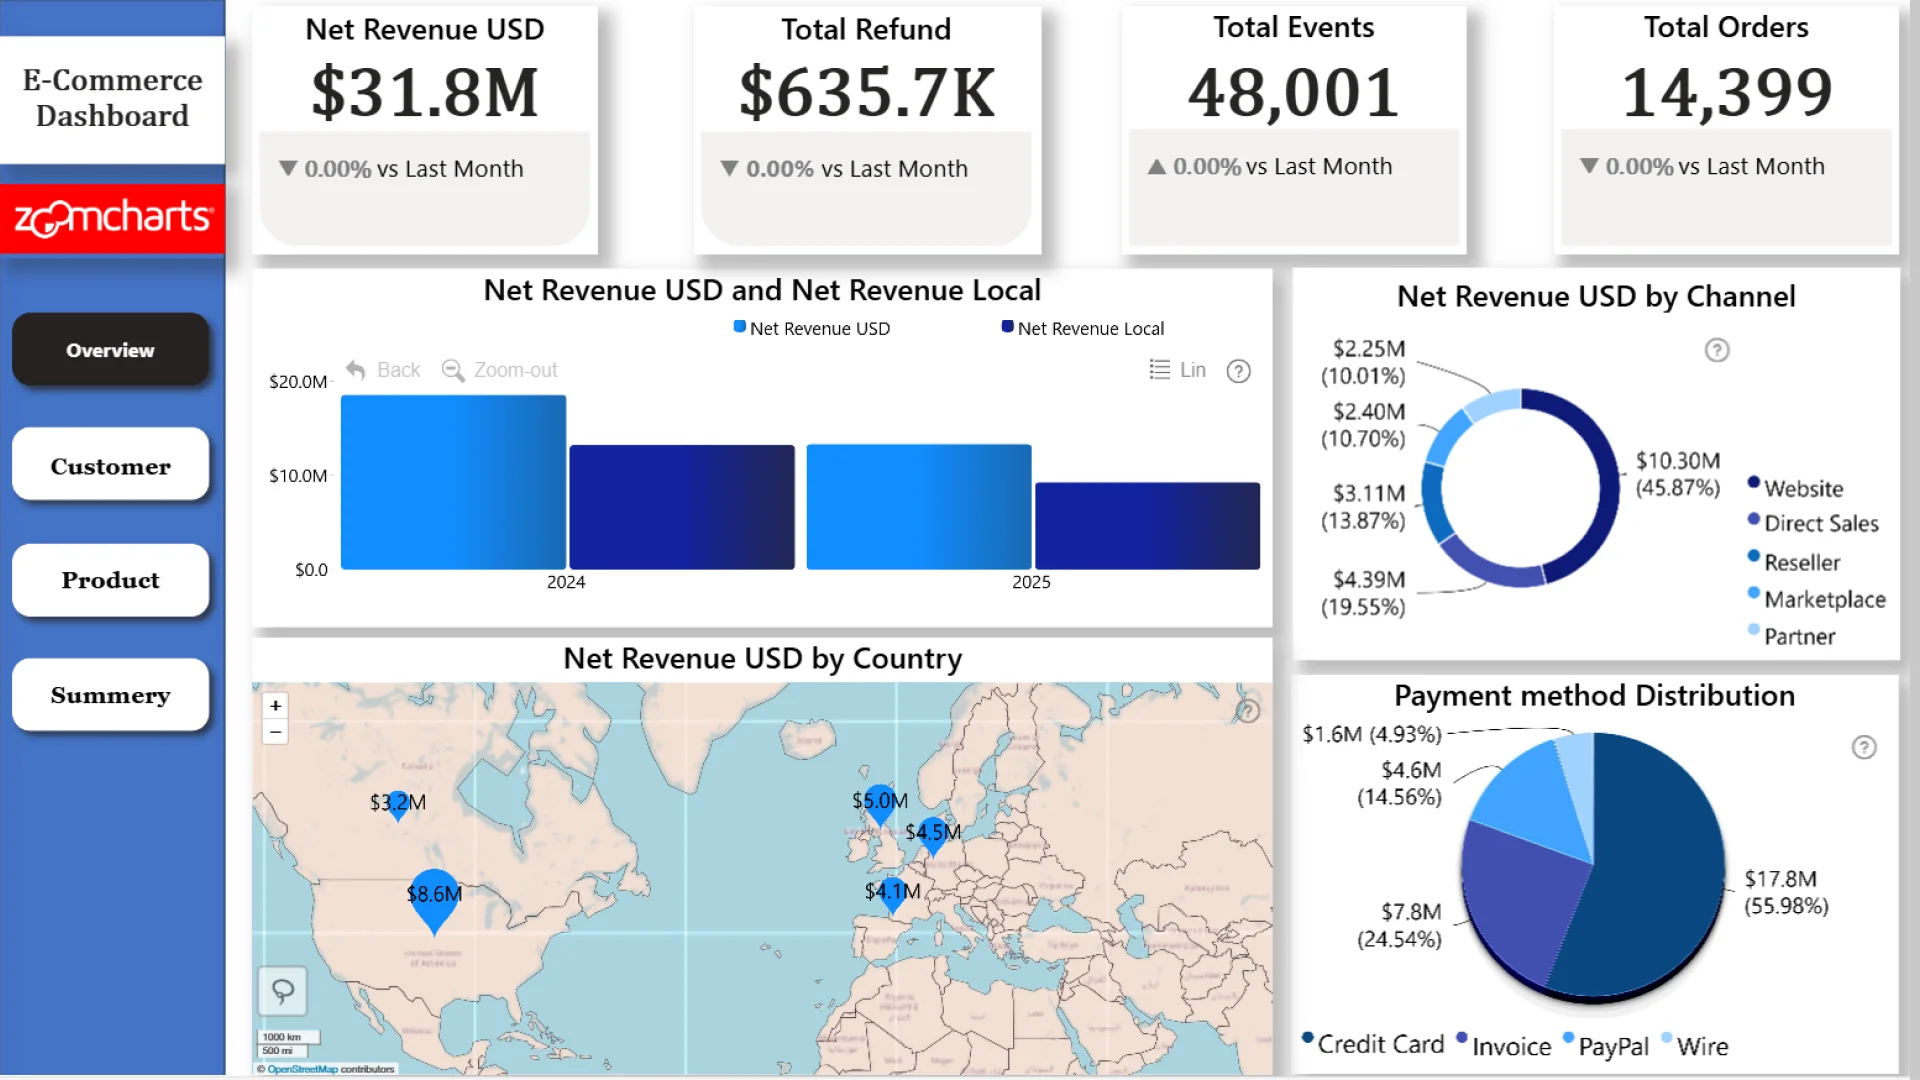
Over the past two years, the business generated $31.8M, but 2025 saw a sharp revenue drop driven by reduced traffic, lower customer acquisition, and declining demand across key countries and age segments. Website and credit-card performance remain stable, with Microsoft 365 still the top product despite overall unit sales falling. To recover, the company should rebuild demand through stronger SEO, retargeting, and targeted campaigns - especially toward the 25–34 segment - while boosting acquisition channels like affiliates, email, and social. Country-specific marketing, product-bundle promotions, and cleanup of underperforming SKUs will help regain market share. Improving product content and quality checks will further stabilize pricing and reduce refunds.
ZoomCharts visuals used





4U Report Challenges
Participate in data challenges, build and submit reports to get free template downloads.
Join CommunityMobile view allows you to interact with the report. To Download the template please switch to desktop view.



How to use a PBIX template
Preview the interactive report, download the PBIX file, open it in Power BI Desktop, and replace the same data connection with your own dataset.
Preview and download
Explore the report online and download the PBIX template file.
Open in Power BI Desktop
Open the downloaded PBIX file in Power BI Desktop.
Connect your data
Replace the sample data source with your own dataset.
Refresh and adjust
Refresh the model and update fields or visual were needed.
Save and share
Save your report and publish it for your audience.


