989
Merchandise Sales Analysis 9
Merchandise Sales Analysis 9
More Report pages
Report Author: Samia Naveed
989
Share template with others
Report submitted for Onyx Data DataDNA ZoomCharts Mini Challenge, January 2025. The report is based on the Merchandise Sales dataset and includes ZoomCharts custom Drill Down PRO visuals for Power BI.
Author's description:
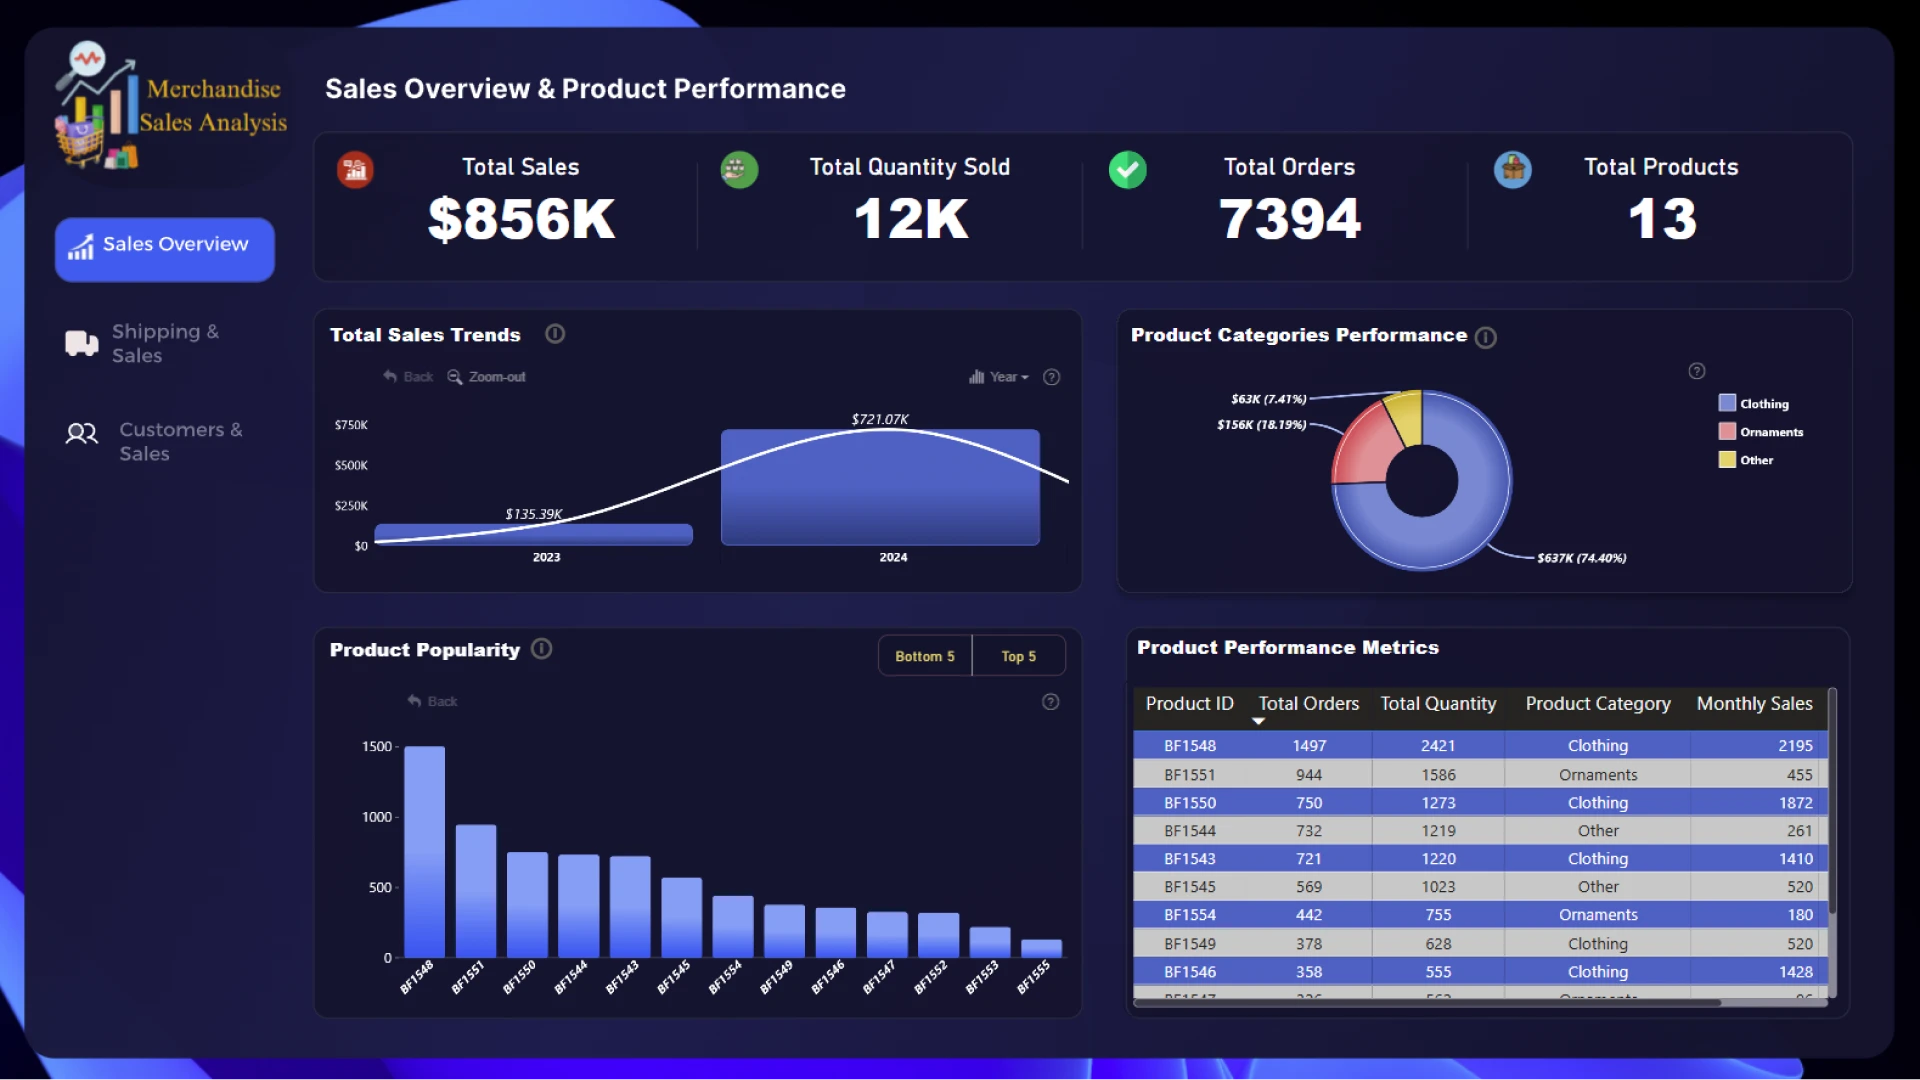
This Power BI dashboard provides a comprehensive overview of Merchandise Sales Analysis, showcasing total sales, quantity sold, orders, and product performance metrics. It features insights into sales trends ($127.9K peak in 2024), product popularity, and category performance (e.g., 50% Clothing) through interactive visualizations.
ZoomCharts visuals used
4U Report Challenges
Participate in data challenges, build and submit reports to get free template downloads.
Join CommunityMobile view allows you to interact with the report. To Download the template please switch to desktop view.


Was this helpful? Thank you for your feedback!
Sorry about that.
How can we improve it?