13566
Inventory Management Dashboard Example
Inventory Management Dashboard Example
More Report pages
Report Author: Pherzy John Diez
13566
Share template with others
Summary
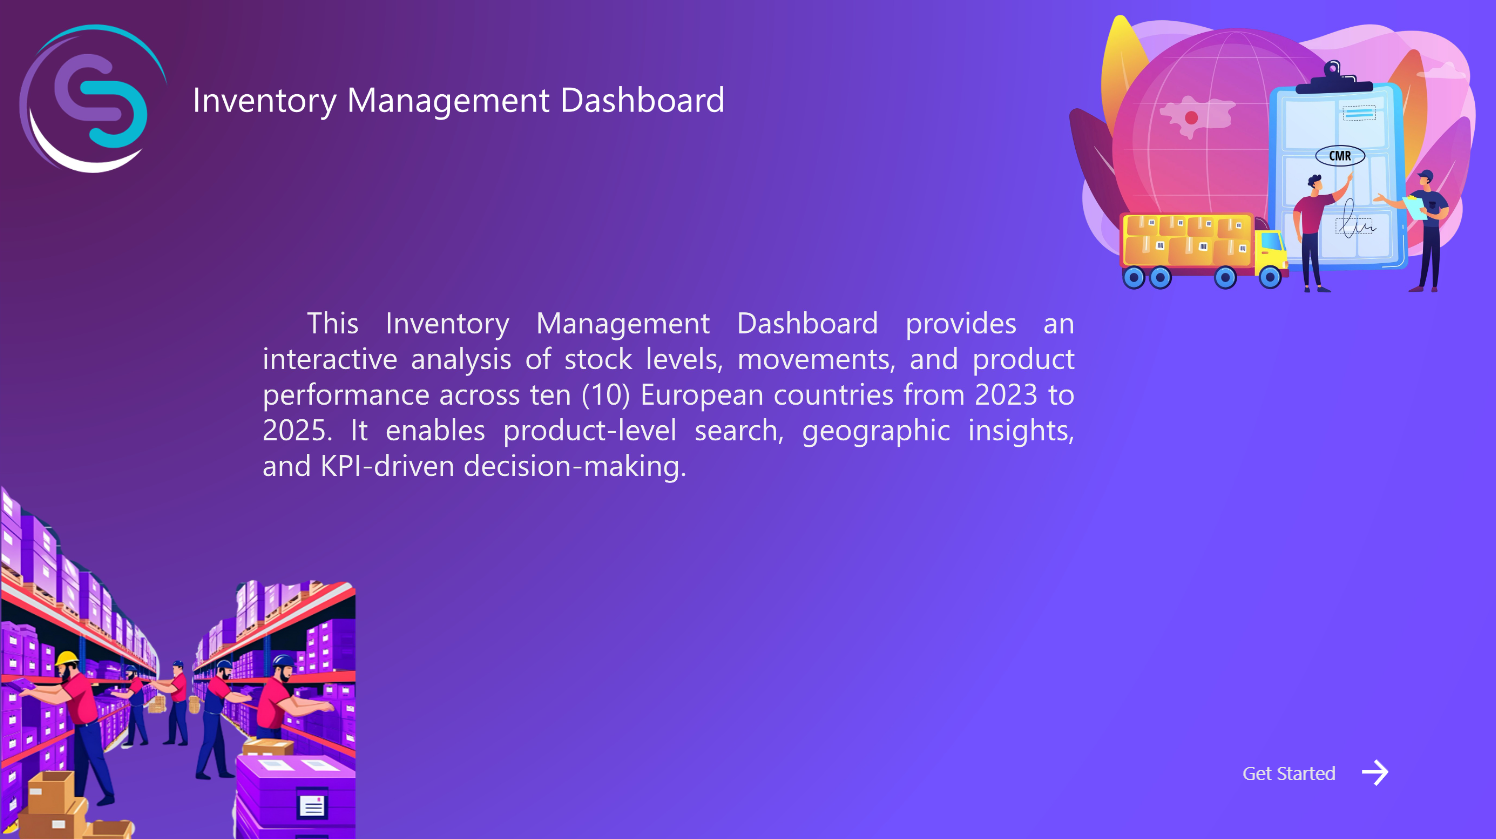
This inventory management dashboard Power BI example helps supply chain, warehouse, and operations teams monitor stock levels, product availability, and inventory performance across multiple locations. It is a practical example of using Power BI for inventory analysis, logistics reporting, and data-driven stock control.
Created by Pherzy John Diez, the report provides clear insights into inventory value, reorder risks, lead time, stock movement, and warehouse distribution. It helps users identify shortages, compare inventory across products and suppliers, and understand where operational attention is needed.
Key Insights of Power BI Inventory Management Dashboard
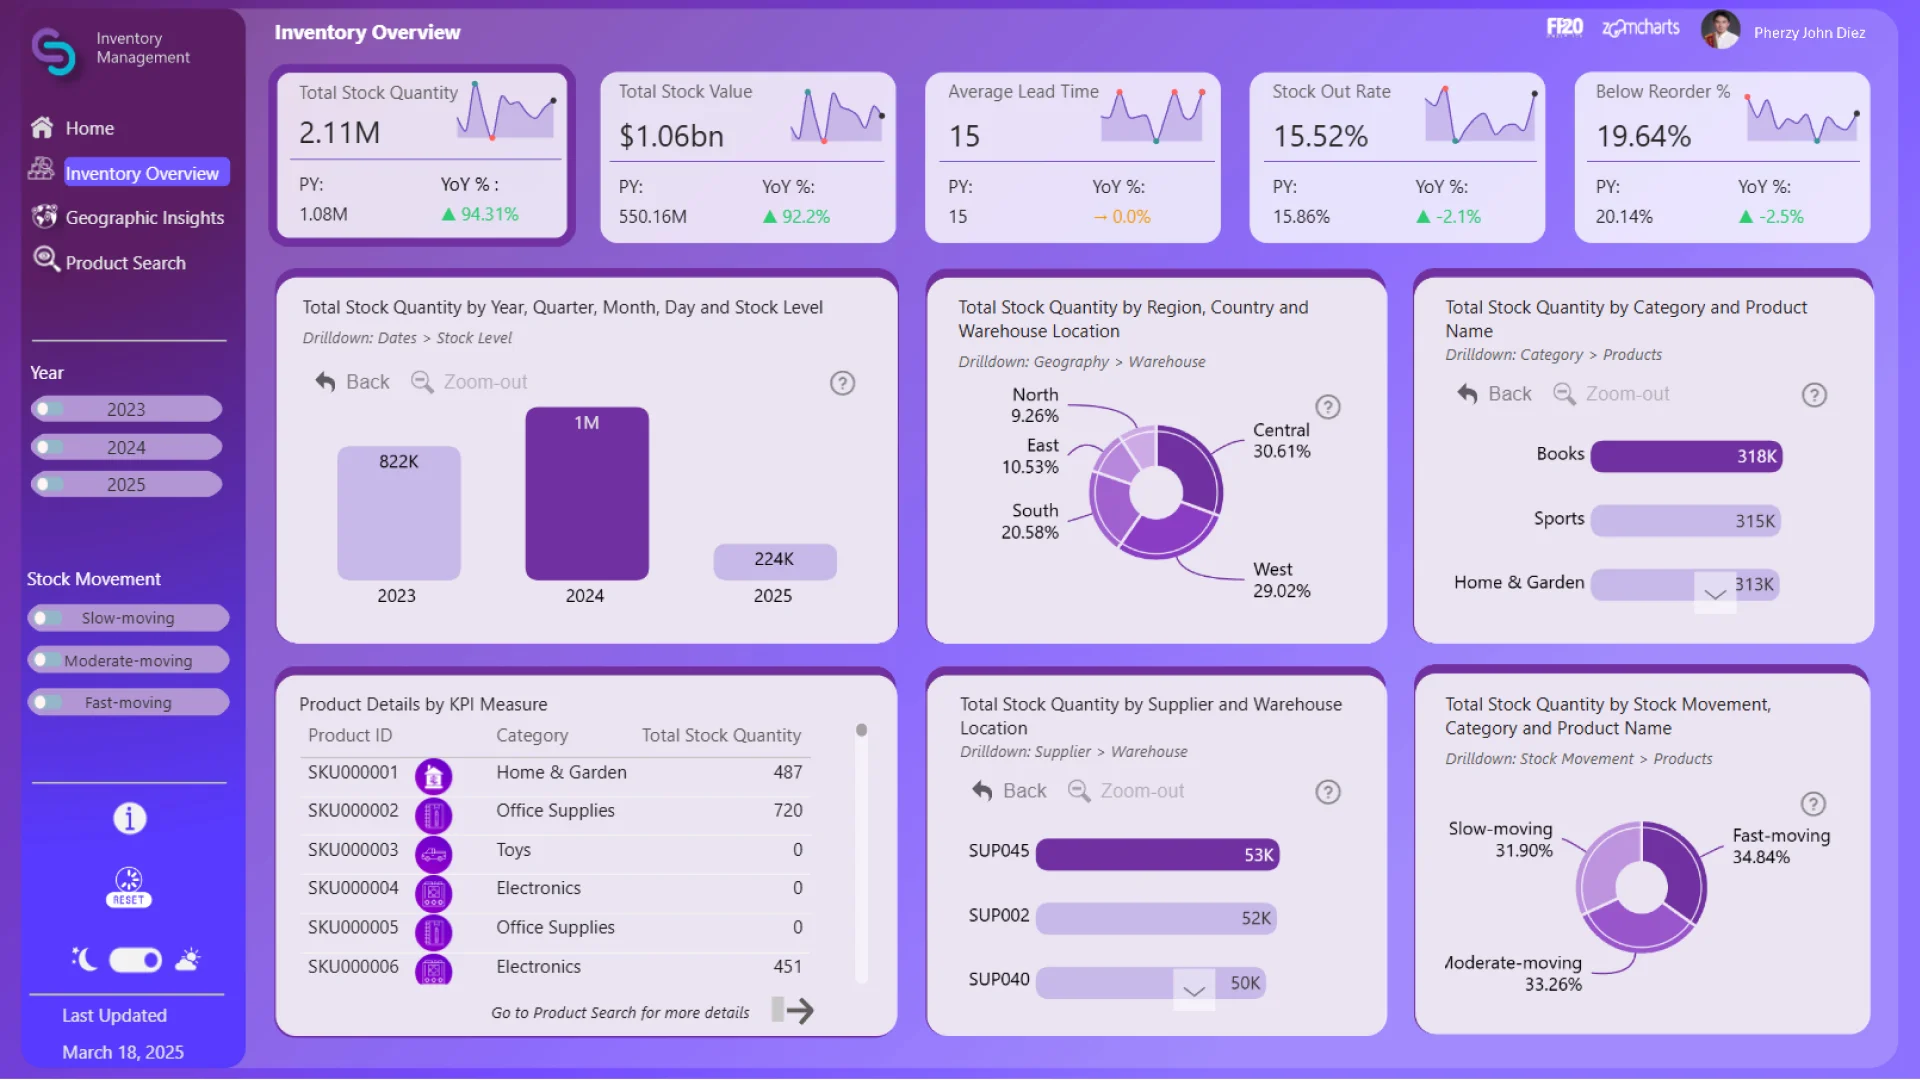
The report is structured across multiple pages. The initial view displays an inventory overview, and each additional page allows users to delve deeper into more specific stock, location, and product-level insights. Some of the main insights include:
- Total stock quantity and total inventory value
- Average lead time and stock out rate
- Products below reorder level
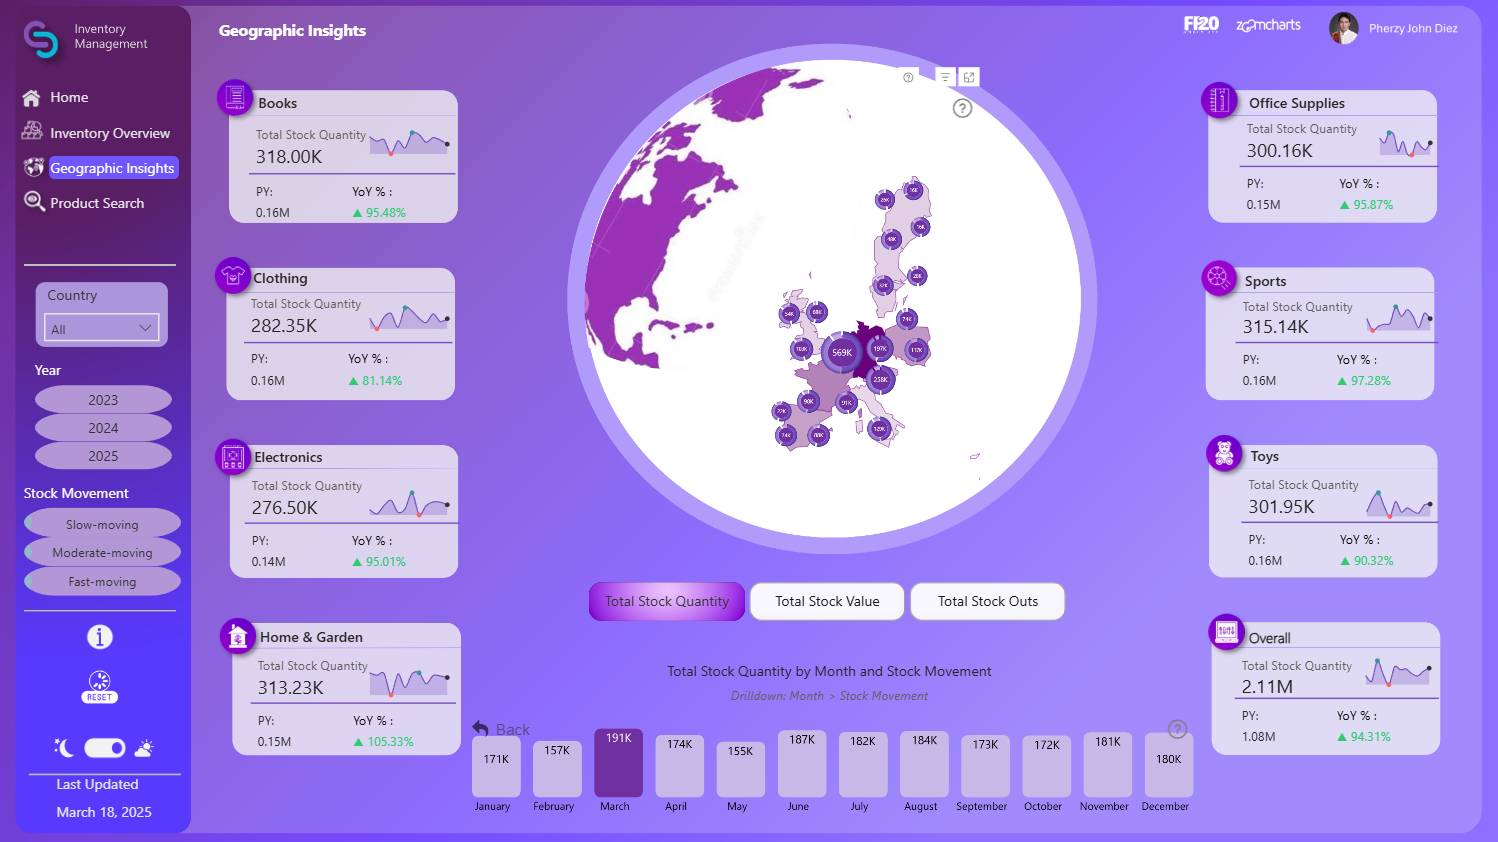
- Inventory distribution by region, country, and warehouse
- Stock quantity by supplier and product category
- Slow-moving and fast-moving product analysis
- Monthly inventory trends and demand patterns
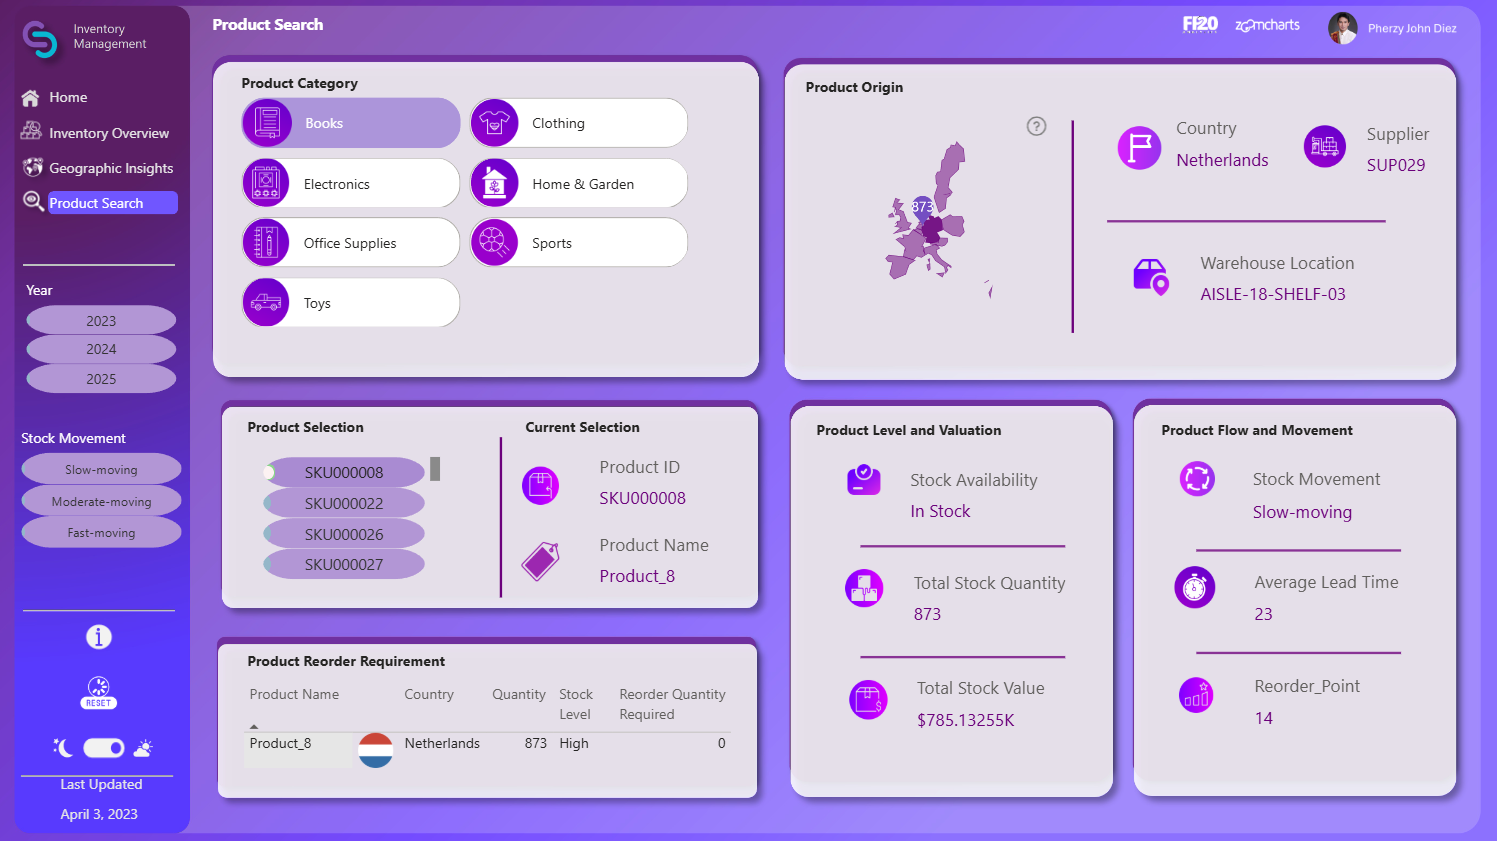
- Product search with stock availability, reorder points, and movement status
With interactive visuals and clear navigation, this Power BI inventory management dashboard makes it quick and easy to find valuable operational insights. The visuals work together to filter relevant data, allowing users to analyze stock levels, warehouse performance, supplier quantities, and geographic inventory distribution from multiple perspectives.
This report was created by Pherzy John Diez.
How to Use This Power BI Inventory Management Dashboard
To interact with this Power BI inventory dashboard, simply click on any active element directly on the charts, maps, categories, suppliers, or warehouse views.
Download the .pbix file to see the report structure, visual settings, formulas, and calculations. Try it out with your own inventory, warehouse, supplier, or logistics data by making a few adjustments.
ZoomCharts visuals used
4U Report Challenges
Participate in data challenges, build and submit reports to get free template downloads.
Join CommunityMobile view allows you to interact with the report. To Download the template please switch to desktop view.


Was this helpful? Thank you for your feedback!
Sorry about that.
How can we improve it?