180
Hospital Bed Demand Forecasting Dashboard
Hospital Bed Demand Forecasting Dashboard
More Report pages
Report Author: Anuoluwapo Odunayo Aliu
180
Share template with others
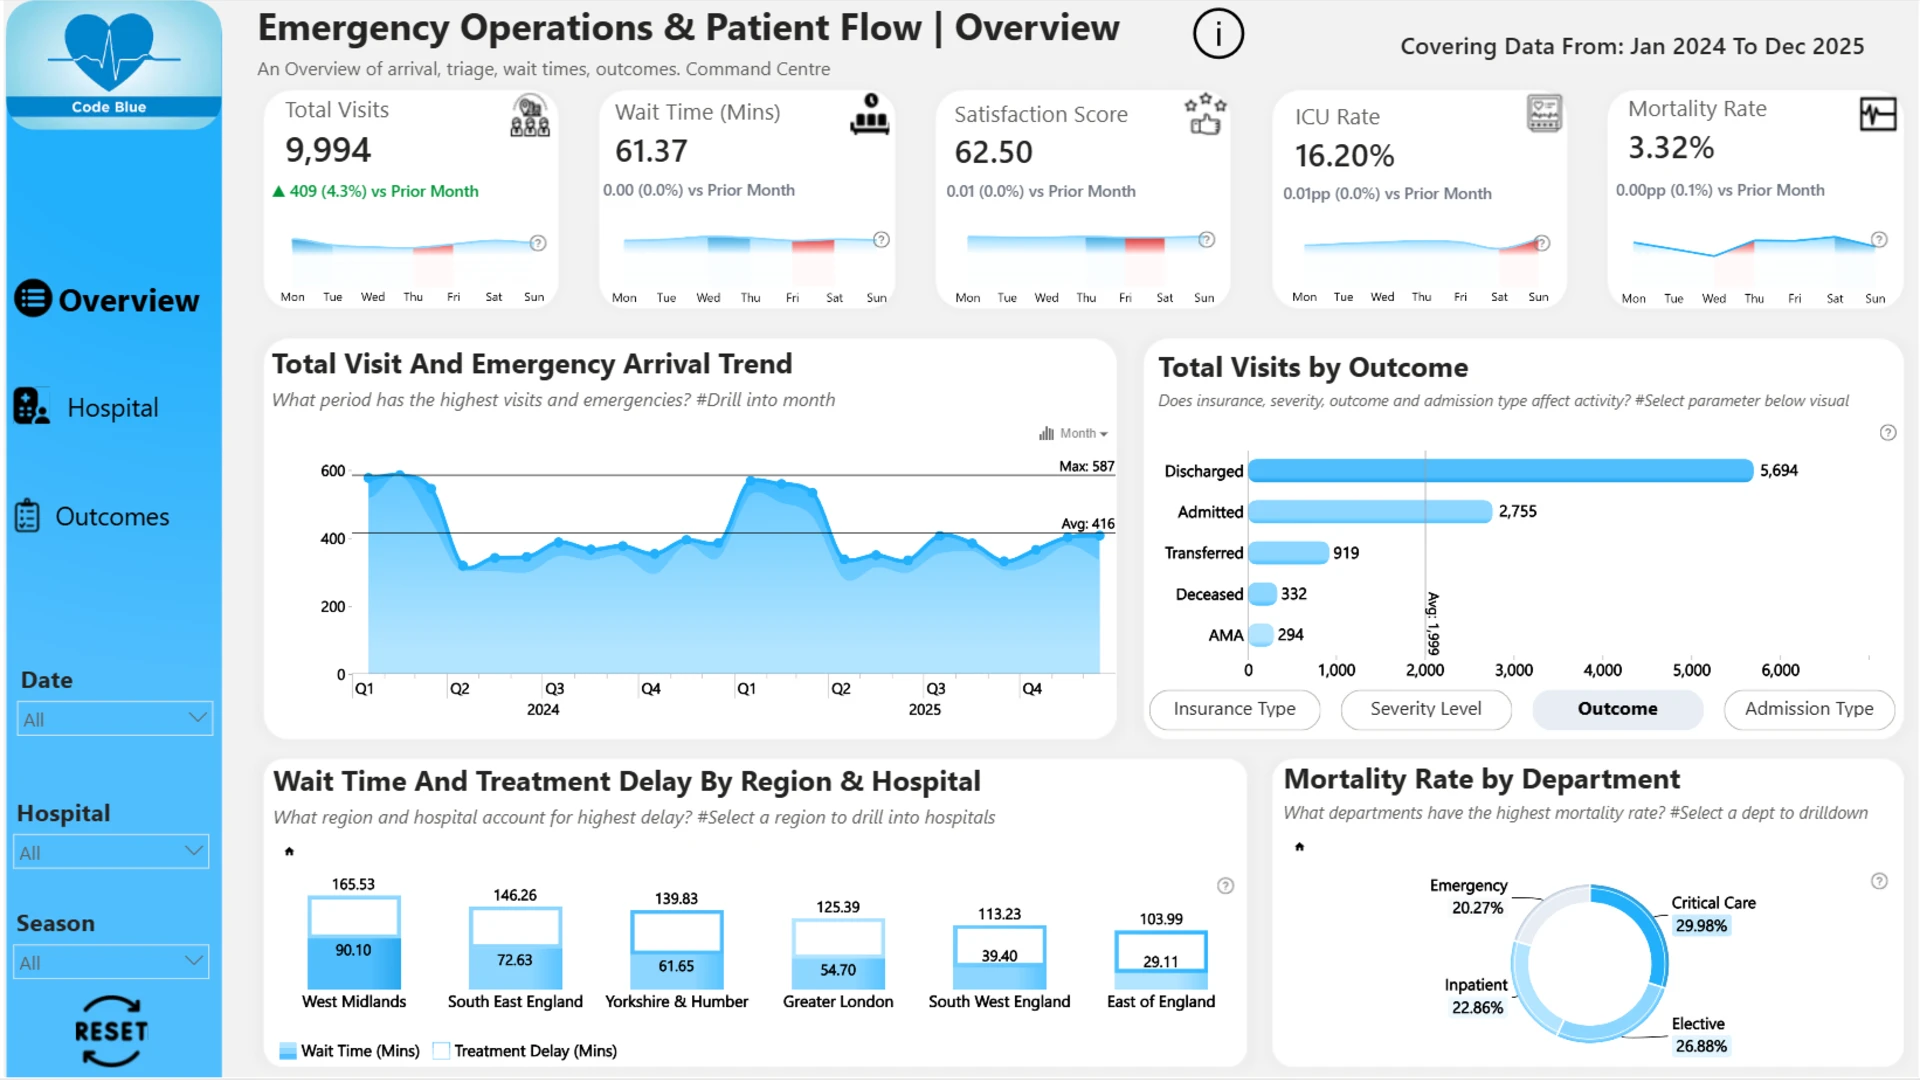
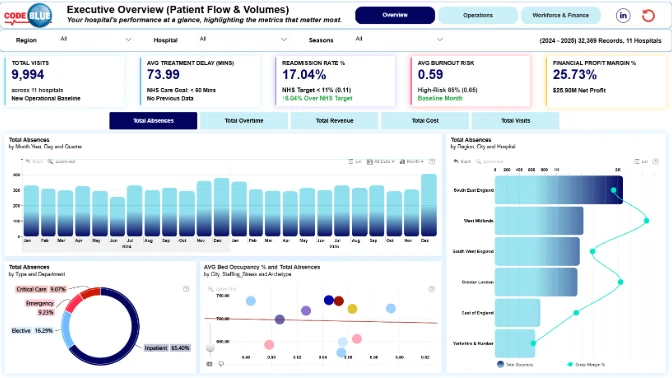
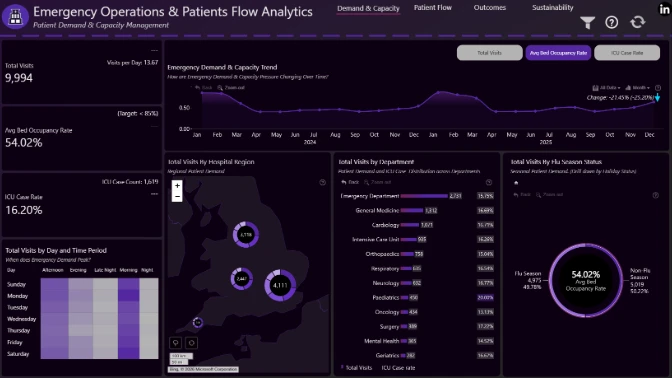
This interactive Power BI report explores the Code Blue Emergency Operations & Patient Flow dataset. It analyzes hospital performance, patient flow, bed capacity, emergency operations, pressure points, risks, inefficiencies, and outcome factors across hospitals and key healthcare segments.
Submitted to the FP20 Analytics ZoomCharts Data Challenge 38: Emergency Operations & Patient Flow Analytics, using native Power BI visuals and ZoomCharts Drill Down PRO custom visuals.
Author’s Description:
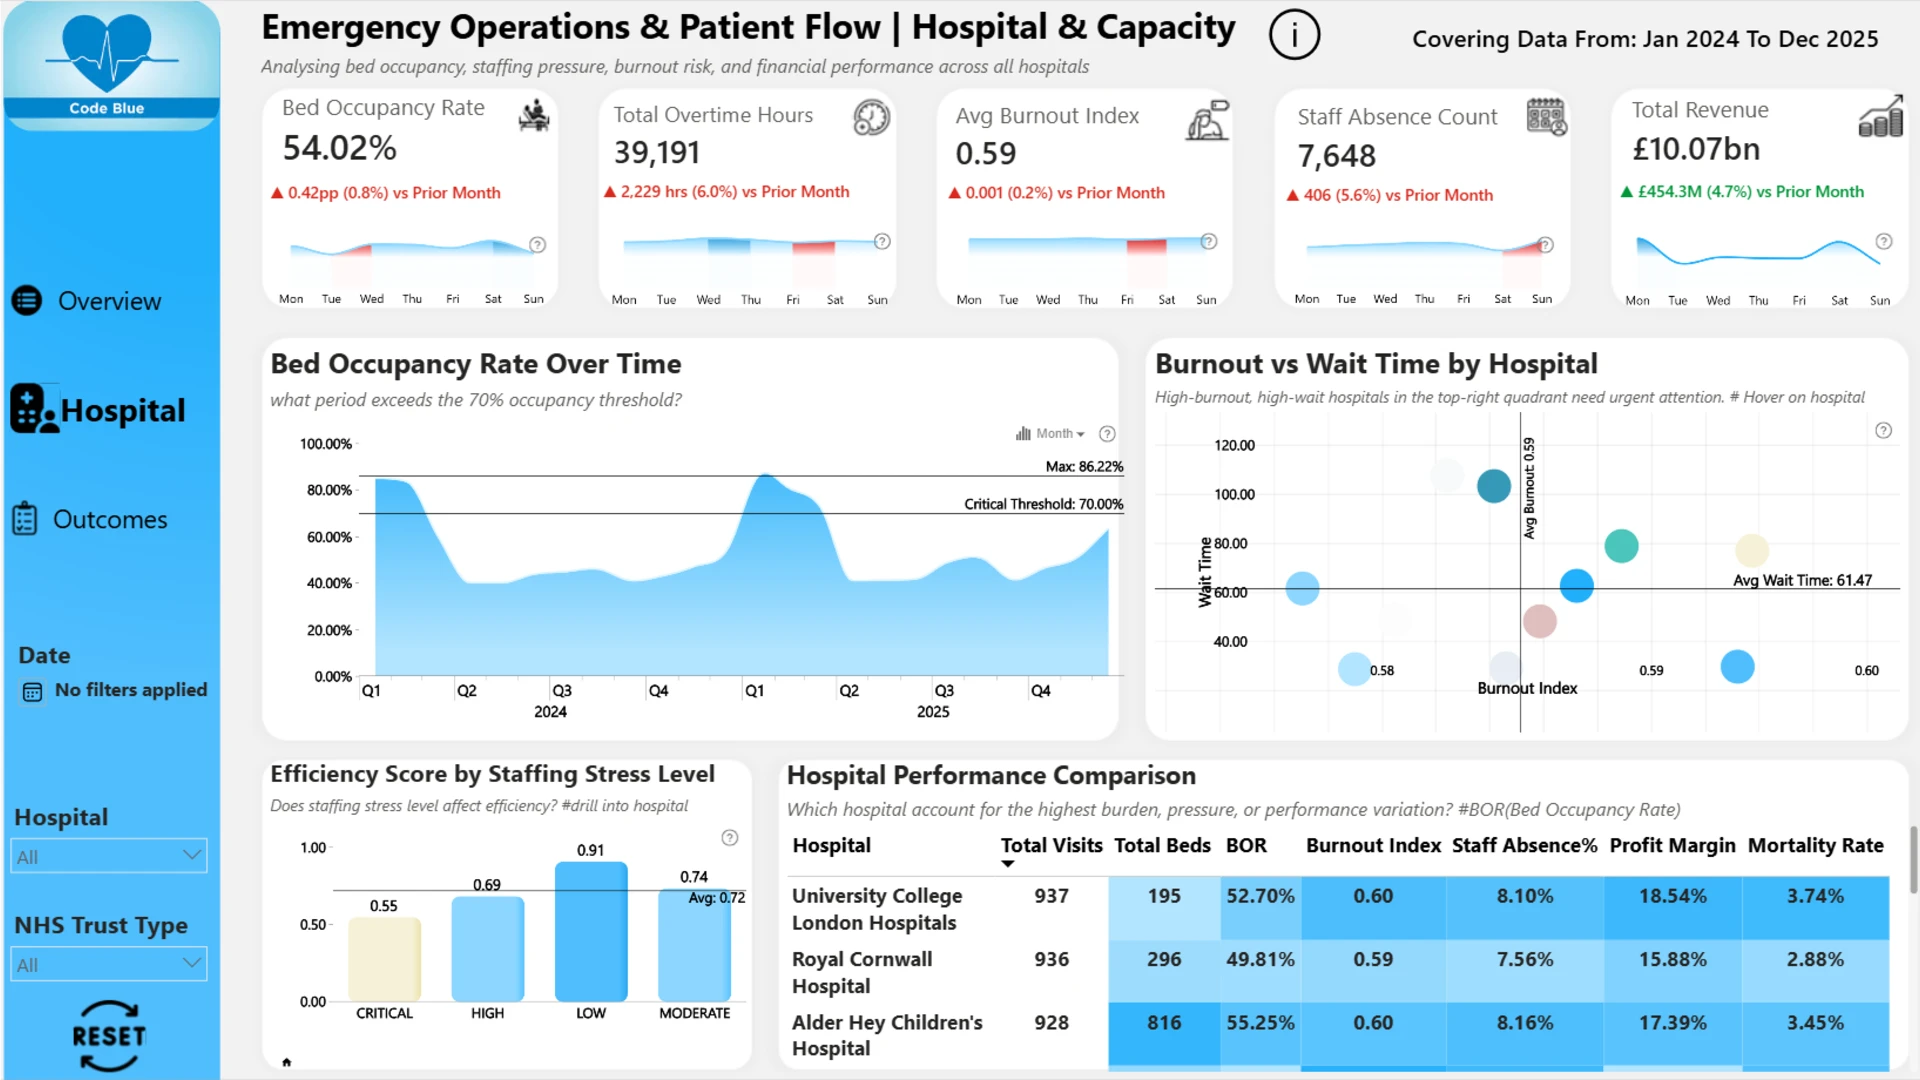
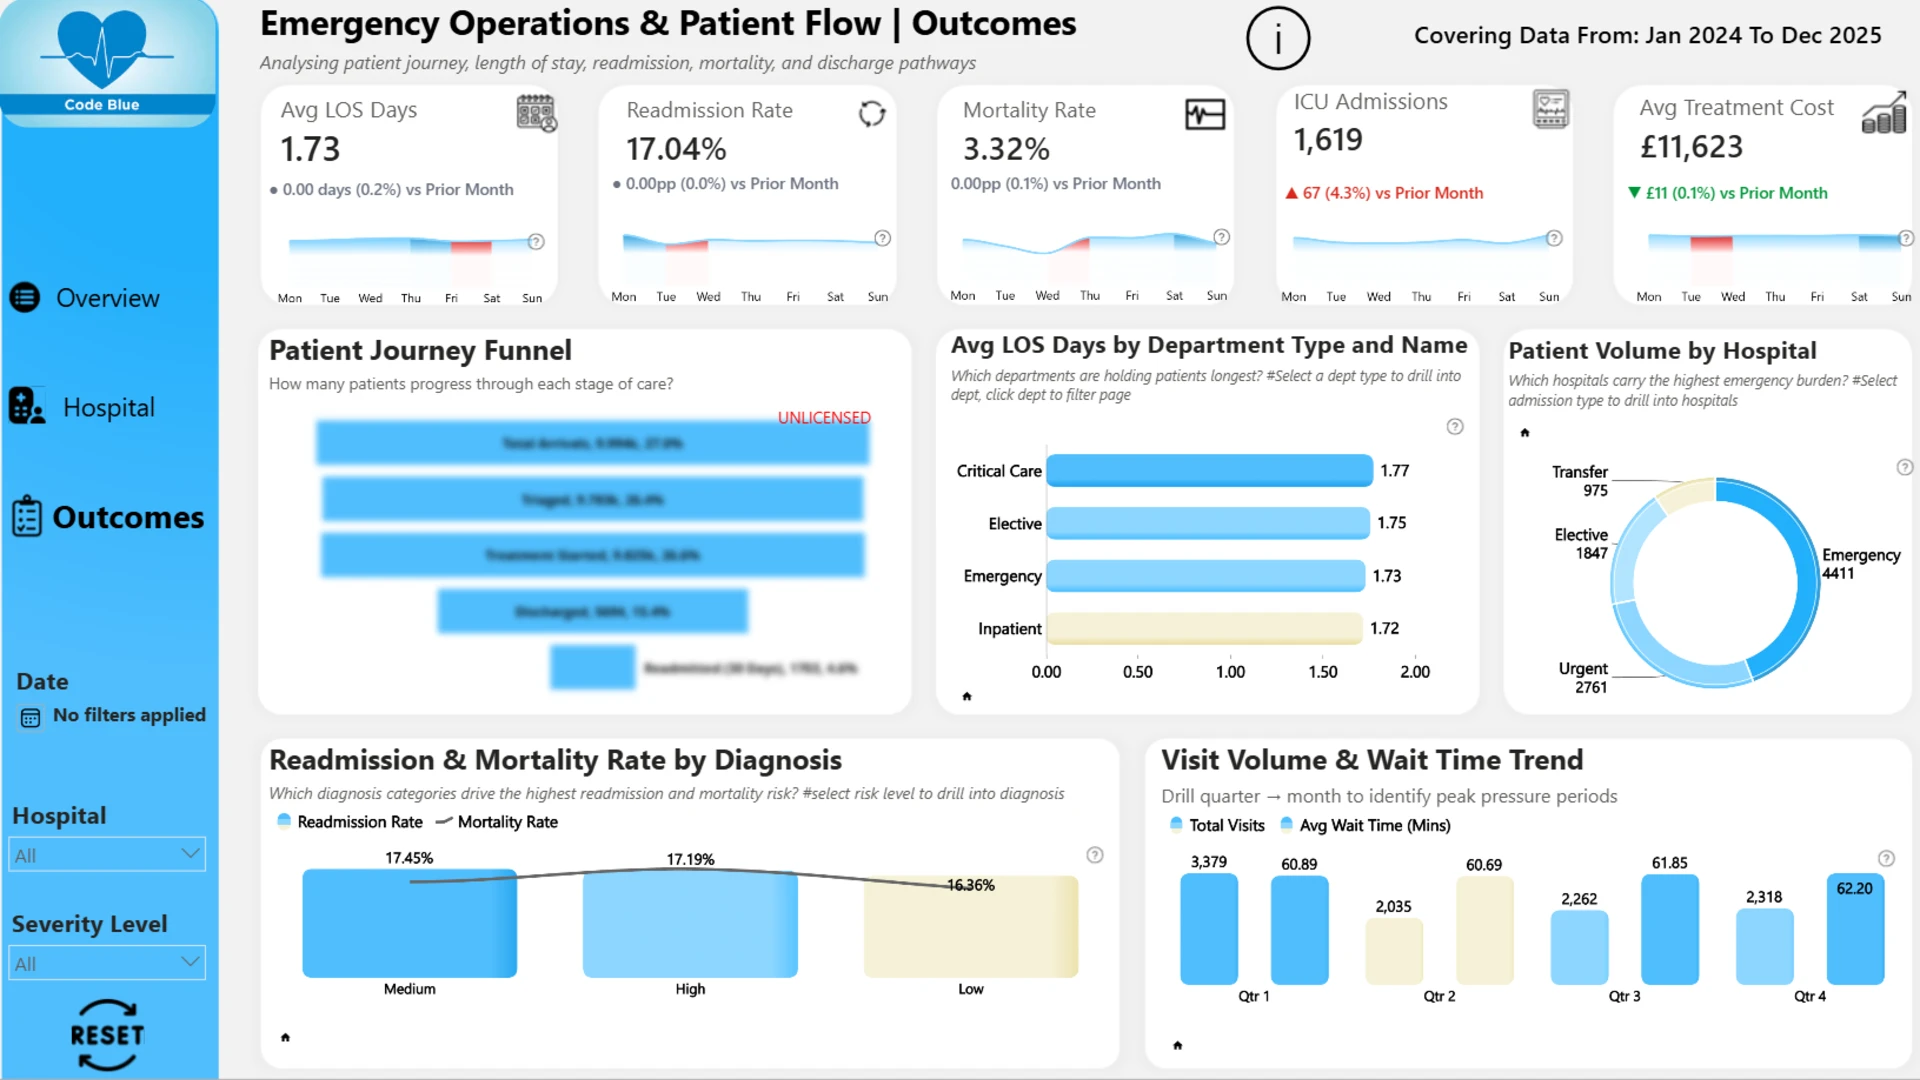
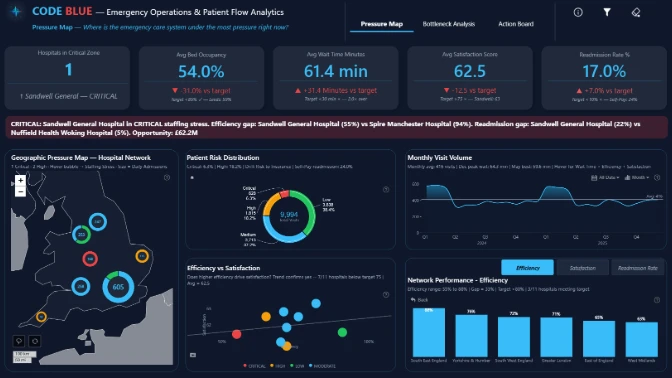
The report is organized into three analytical pages that guide users from a high-level operational overview to detailed performance analysis. The first page presents emergency department activity, including patient arrivals, triage demand, waiting times, and regional performance across the hospital network. The second page focuses on hospital capacity, workforce efficiency, bed occupancy, and staffing pressures to identify operational bottlenecks. The final page follows the patient journey from admission to discharge, analyzing length of stay, readmissions, and clinical outcomes to reveal opportunities for improving patient flow and quality of care.
ZoomCharts visuals used
4U Report Challenges
Participate in data challenges, build and submit reports to get free template downloads.
Join CommunityMobile view allows you to interact with the report. To Download the template please switch to desktop view.
Was this helpful? Thank you for your feedback!
Sorry about that.
How can we improve it?