390
Emergency Department Resource Planning Report
Emergency Department Resource Planning Report
More Report pages
Report Author: Syed Daniyal Ahmed
390
Share template with others
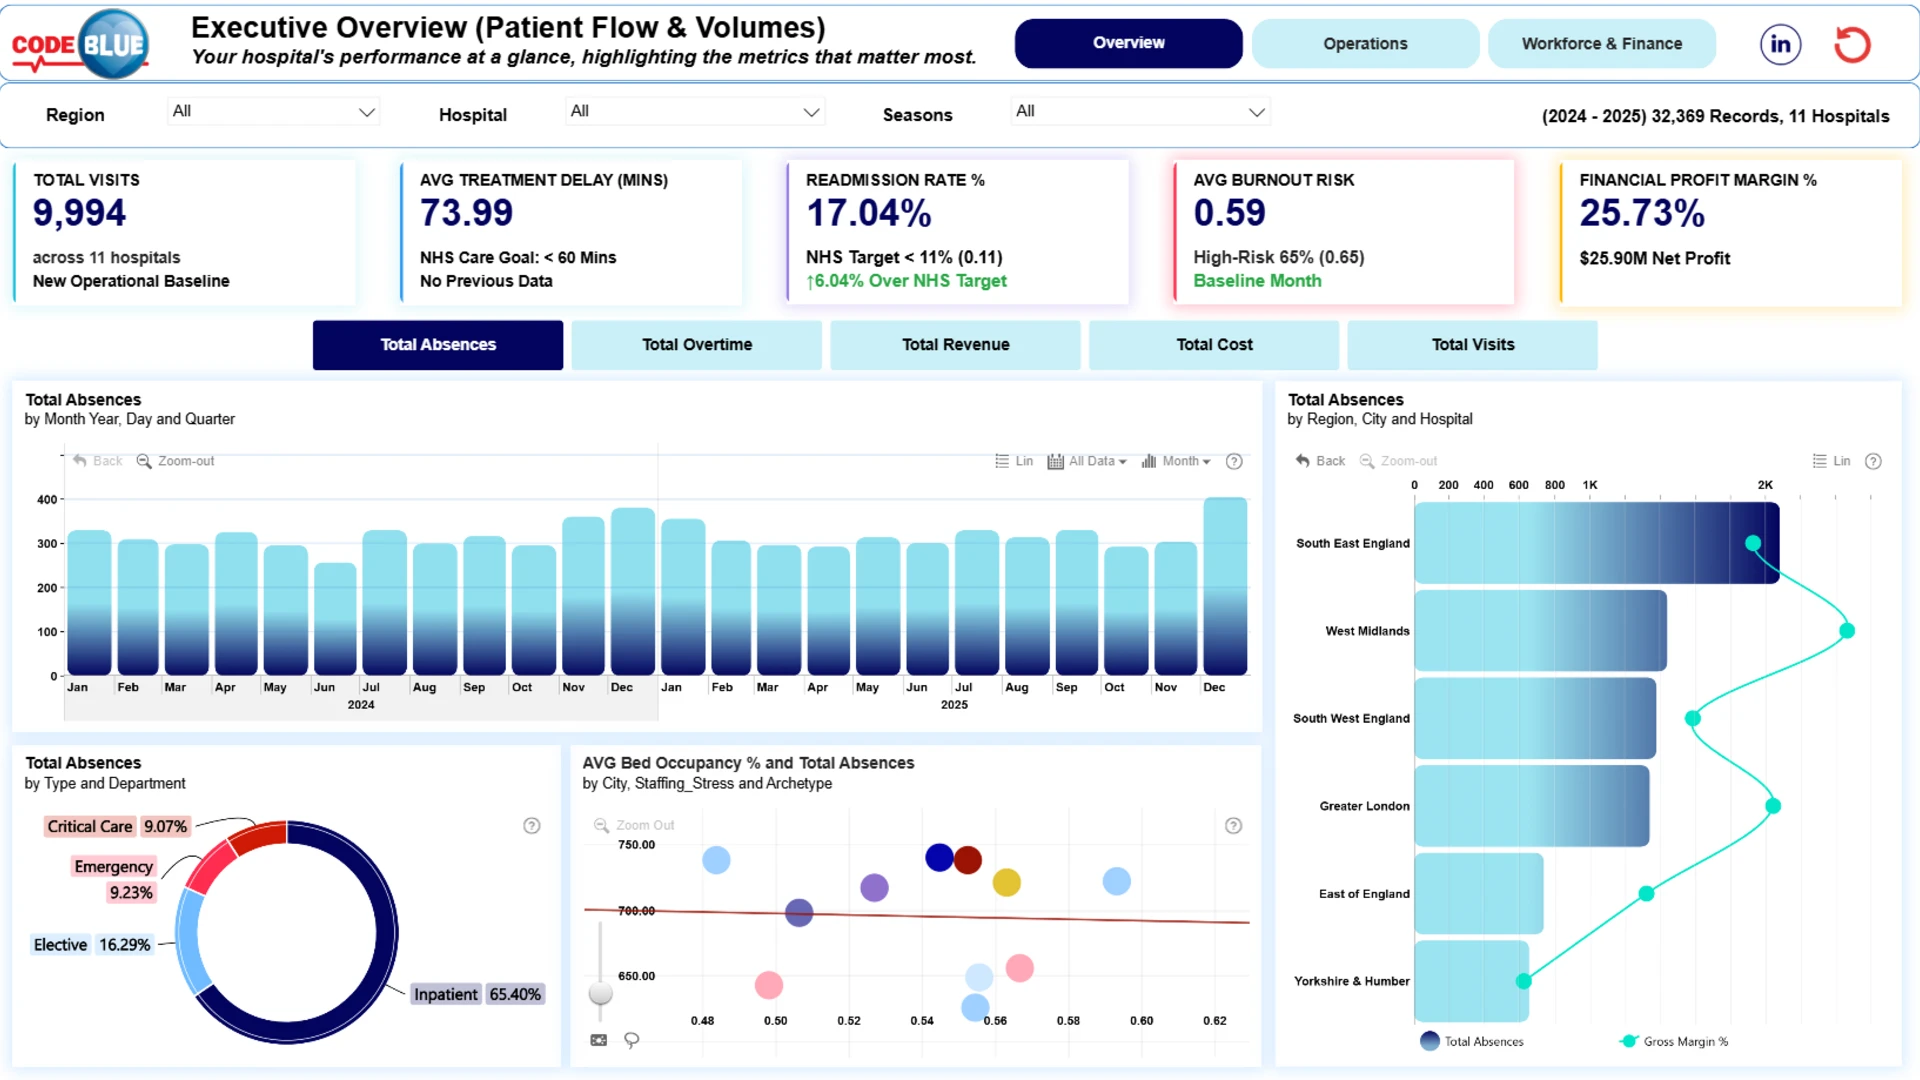
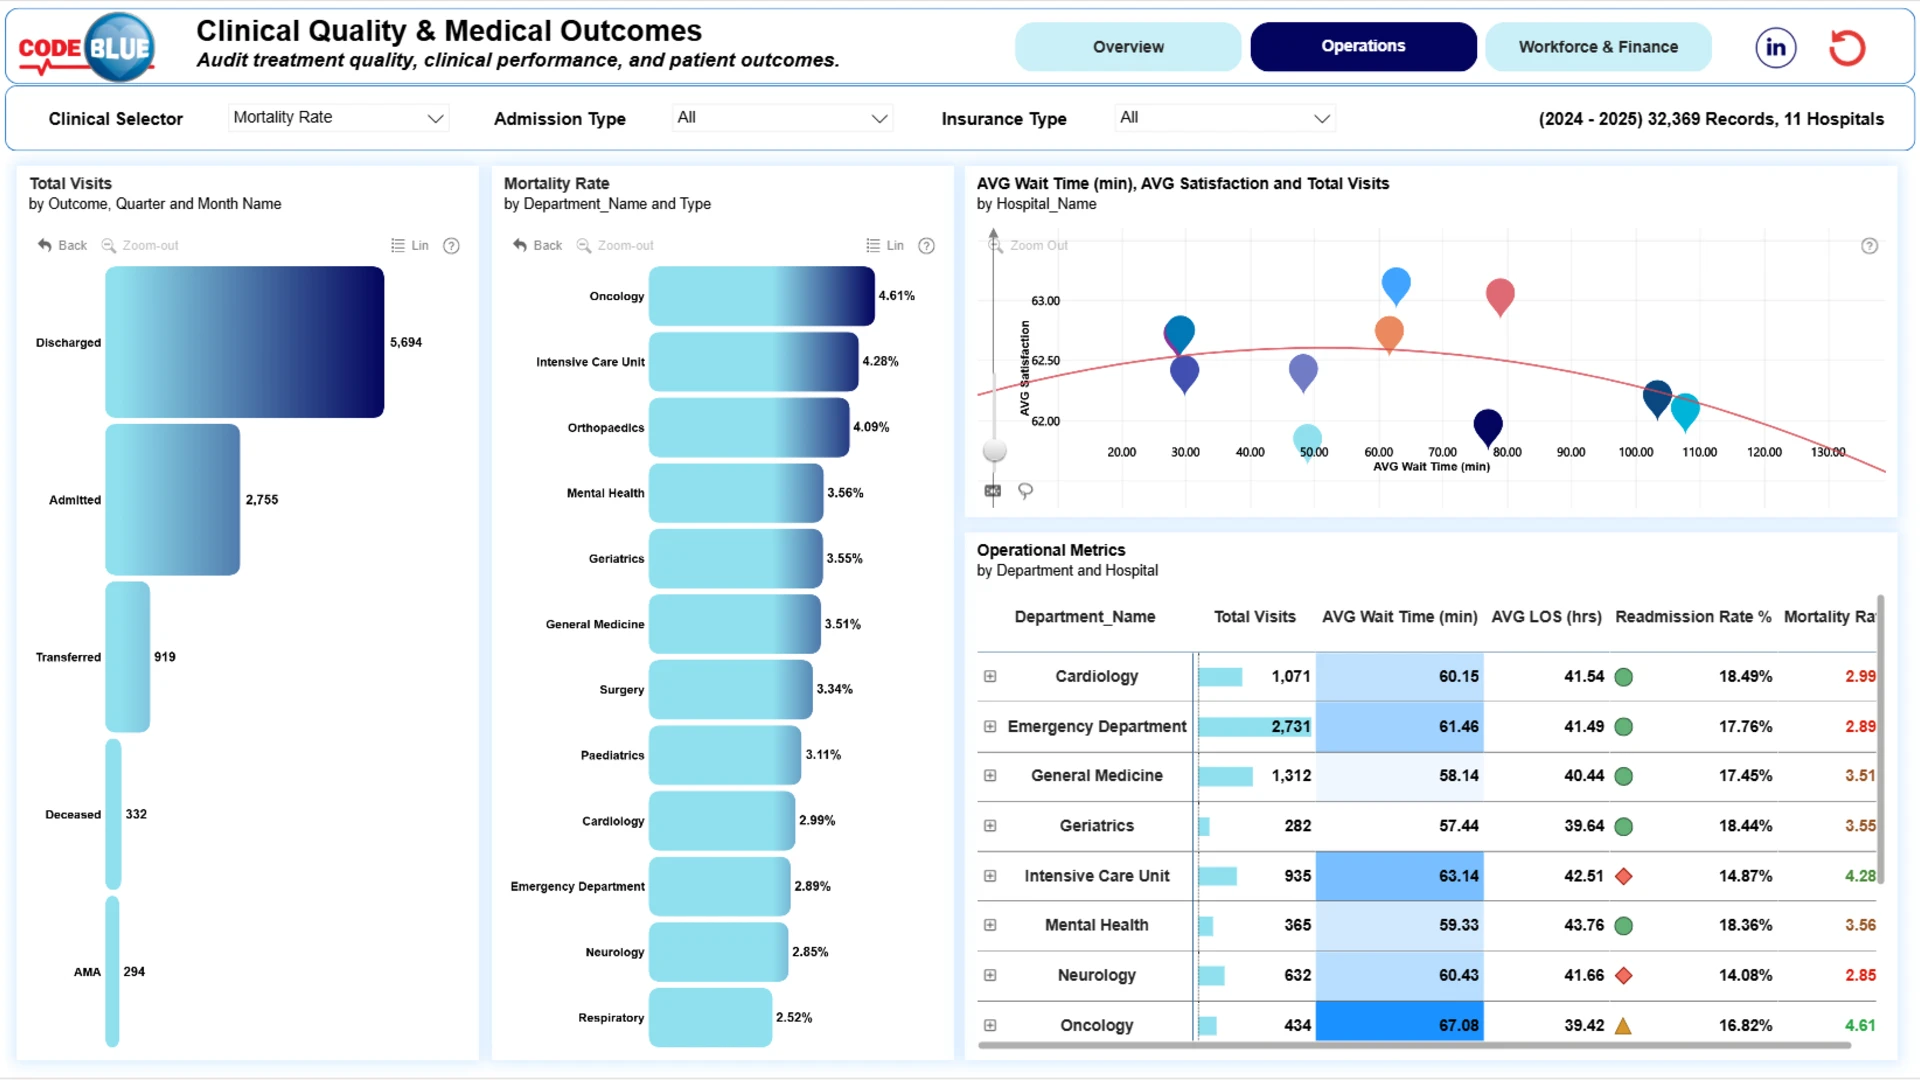
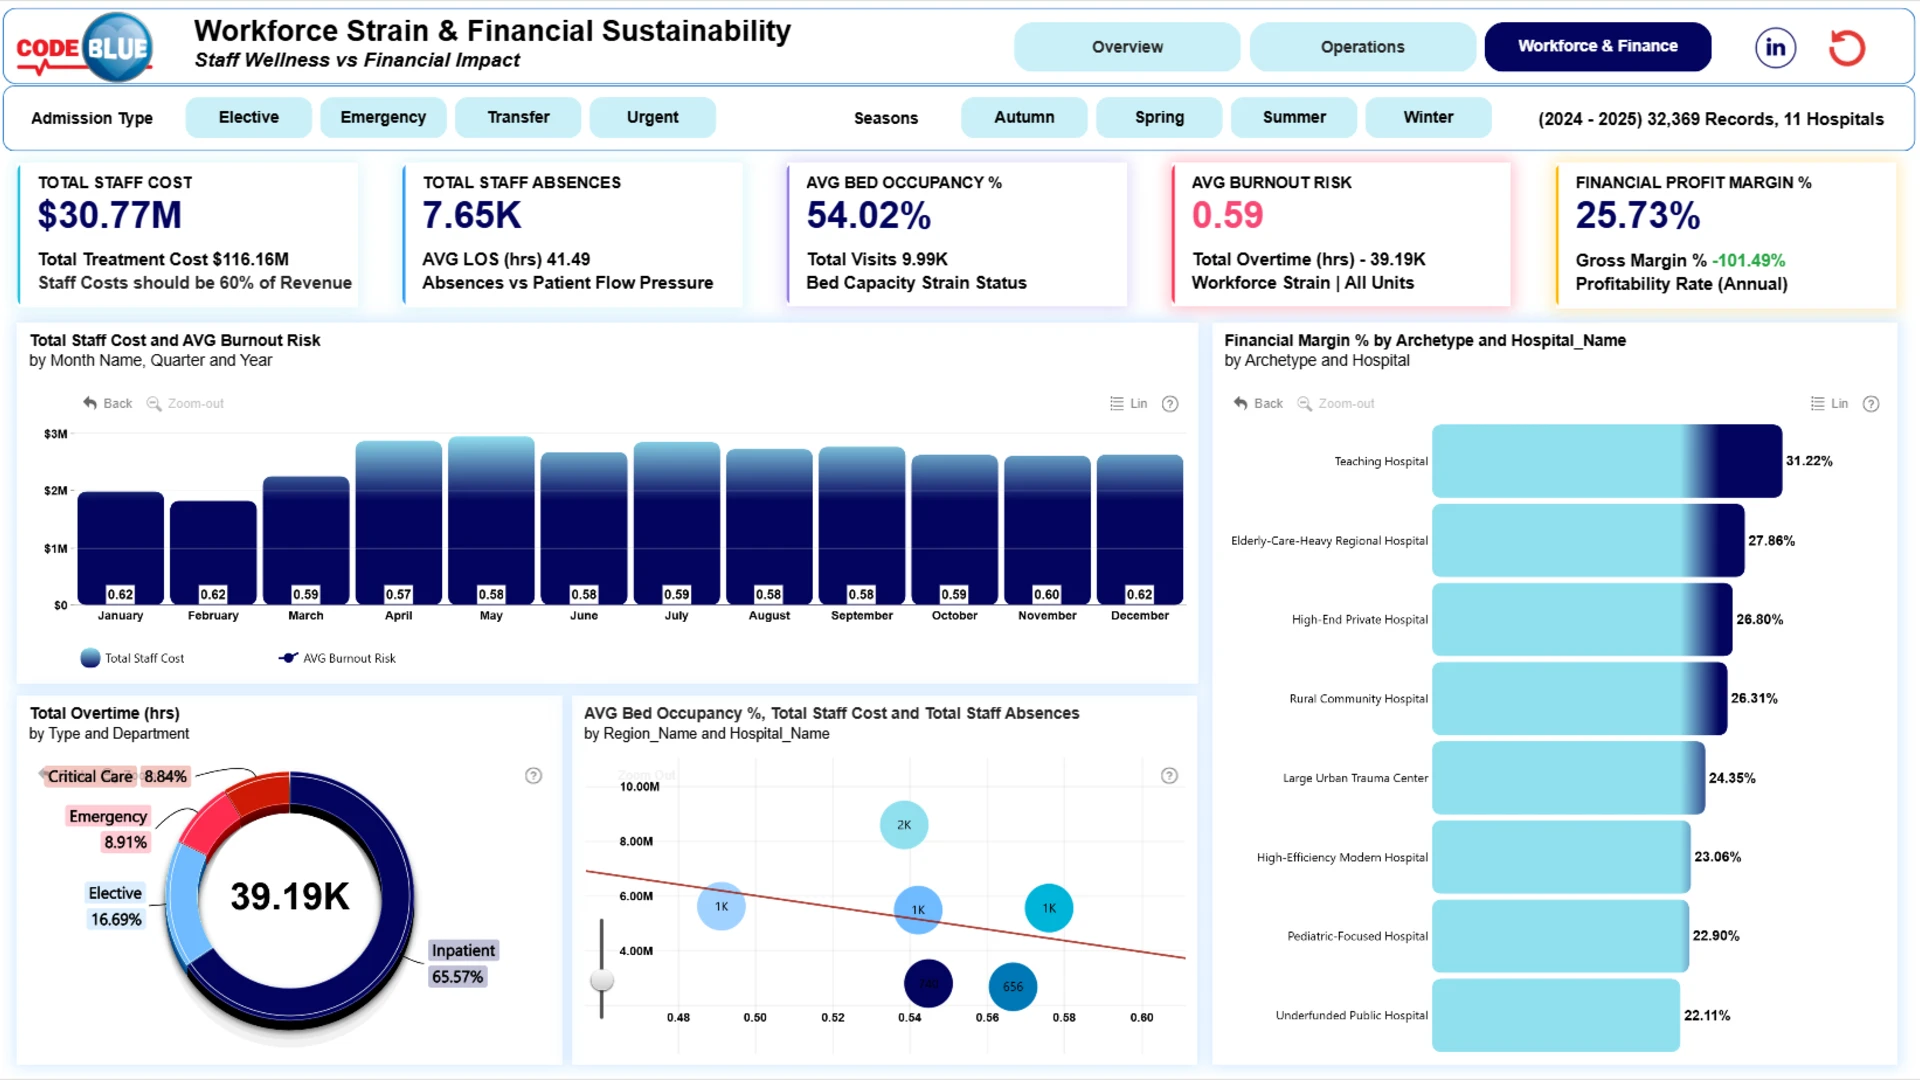
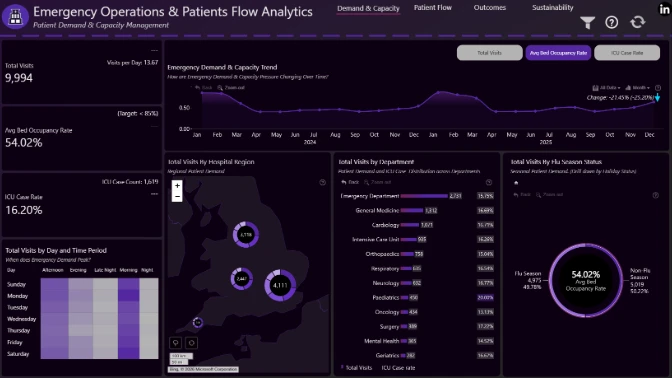
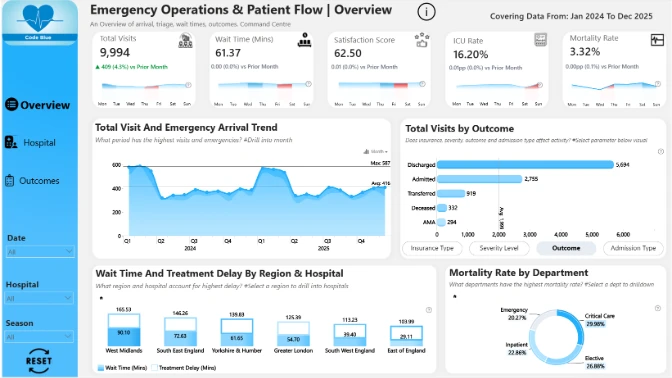
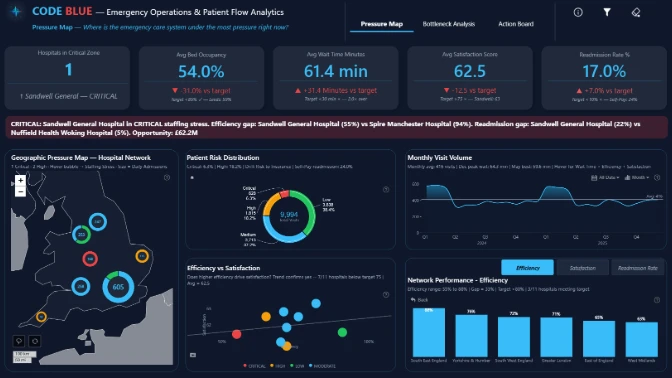
This interactive Power BI report explores the Code Blue Emergency Operations & Patient Flow dataset. It analyzes hospital performance, patient flow, bed capacity, emergency operations, pressure points, risks, inefficiencies, and outcome factors across hospitals and key healthcare segments.
Submitted to the FP20 Analytics ZoomCharts Data Challenge 38: Emergency Operations & Patient Flow Analytics, using native Power BI visuals and ZoomCharts Drill Down PRO custom visuals.
Author’s Description:
This project represents a highly polished, professional multi-page executive healthcare analytics reporting system. It spans three specialized analytical themes designed to bridge clinical outcomes, hospital administration, patient flows, and financial health over a two-year timeframe (2024–2025), capturing a total data pool of 32,369 records across 11 network hospitals.
ZoomCharts visuals used
4U Report Challenges
Participate in data challenges, build and submit reports to get free template downloads.
Join CommunityMobile view allows you to interact with the report. To Download the template please switch to desktop view.
Was this helpful? Thank you for your feedback!
Sorry about that.
How can we improve it?