1032
Holiday Retail Performance – Power BI 4
Holiday Retail Performance – Power BI 4
More Report pages
Report Author: Akindele Omolayo
1032
Share template with others
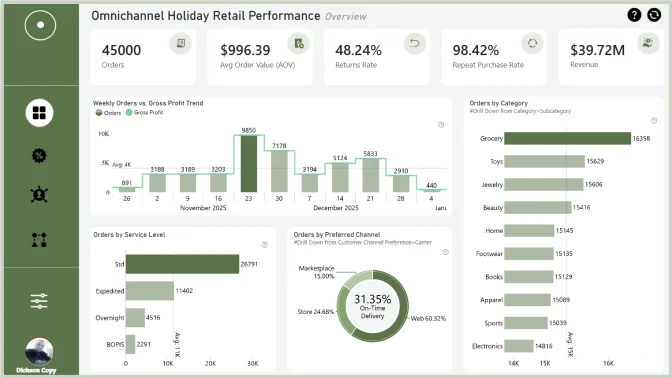
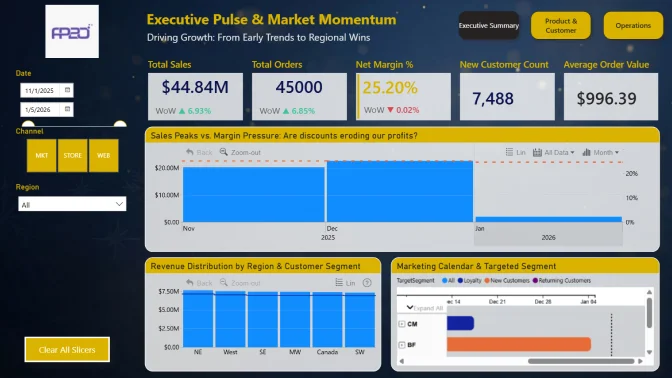
This Power BI report is built using the Omnichannel Holiday Retail Sales dataset and features ZoomCharts Drill Down PRO custom visuals for Power BI. It was submitted to the FP20 Analytics ZoomCharts Data Challenge #33 (December 2025 – January 2026).
Author's Description:
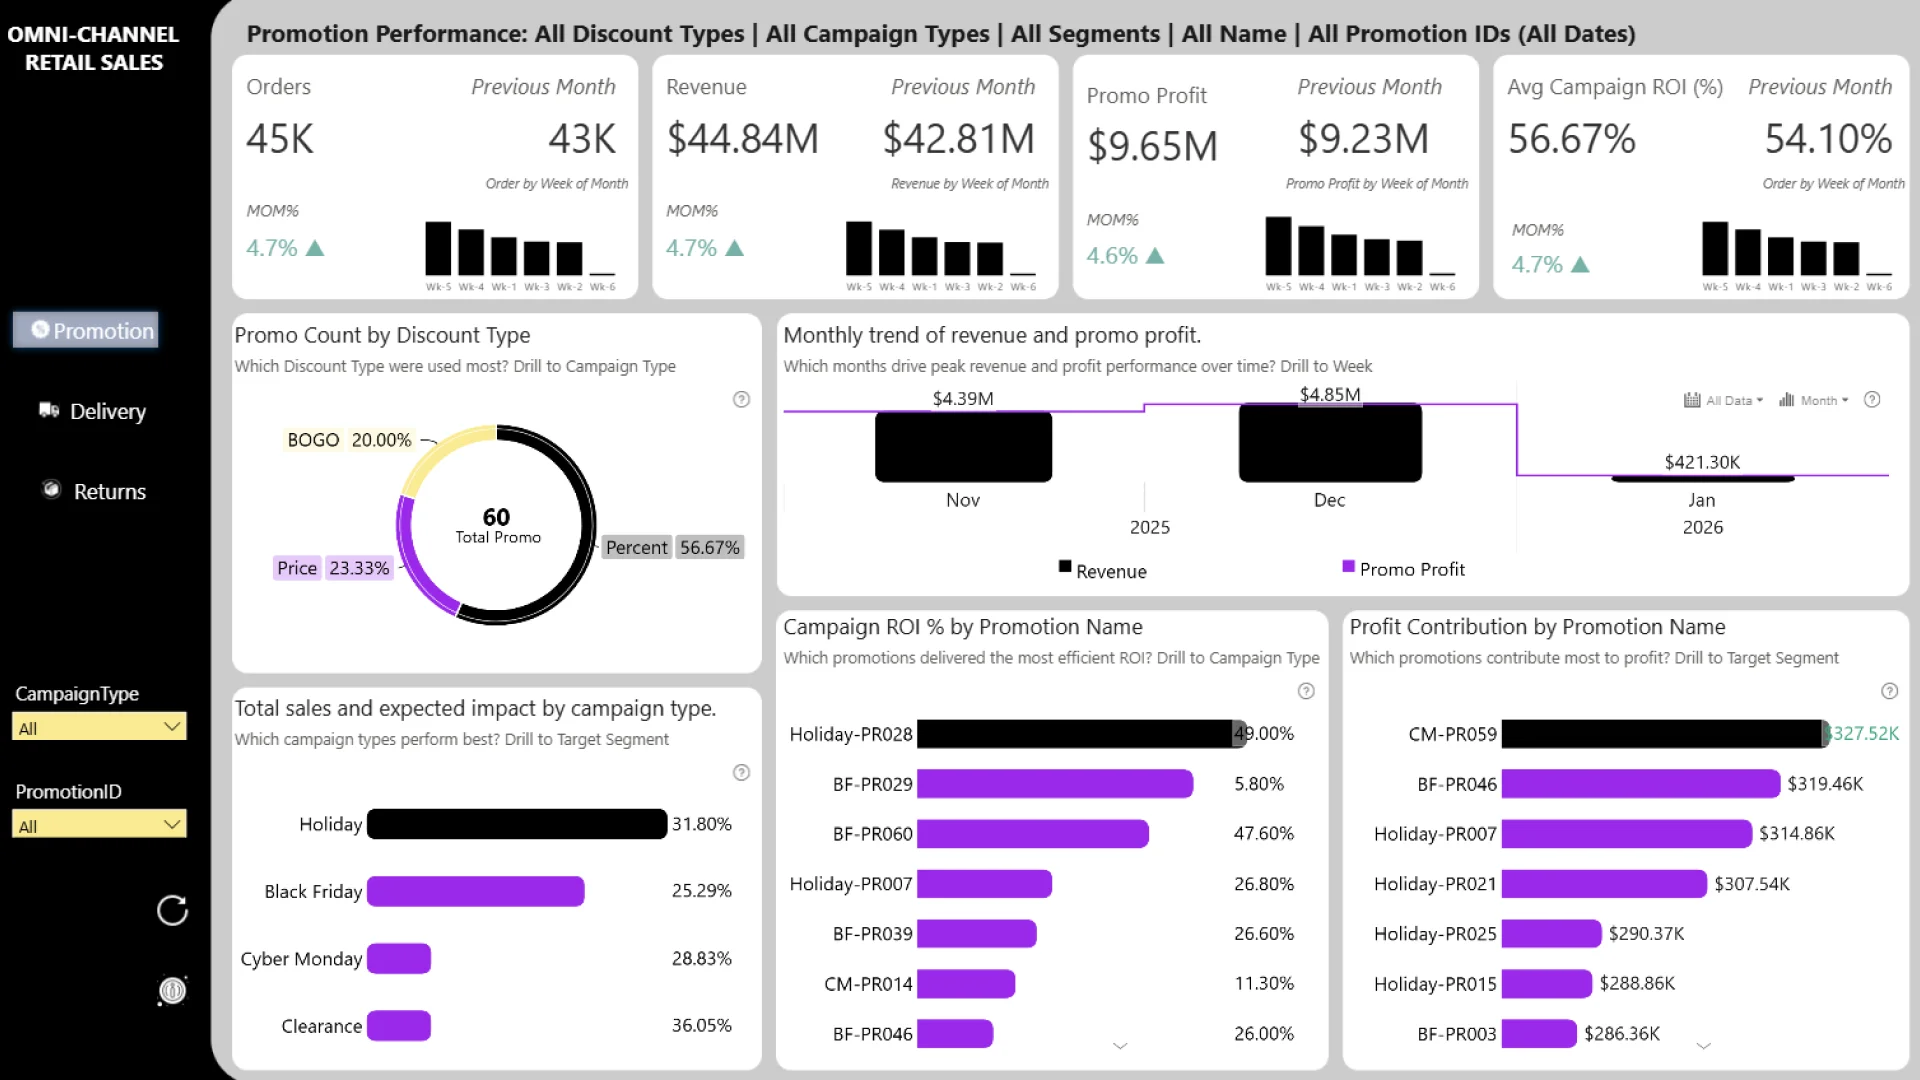
Page 1: Promotion Performance
A data-driven view of campaign efficiency and ROI. From discount type usage to campaign-level performance, this page highlights which promotions generate the most profit and deliver the best return across different time periods and segments.
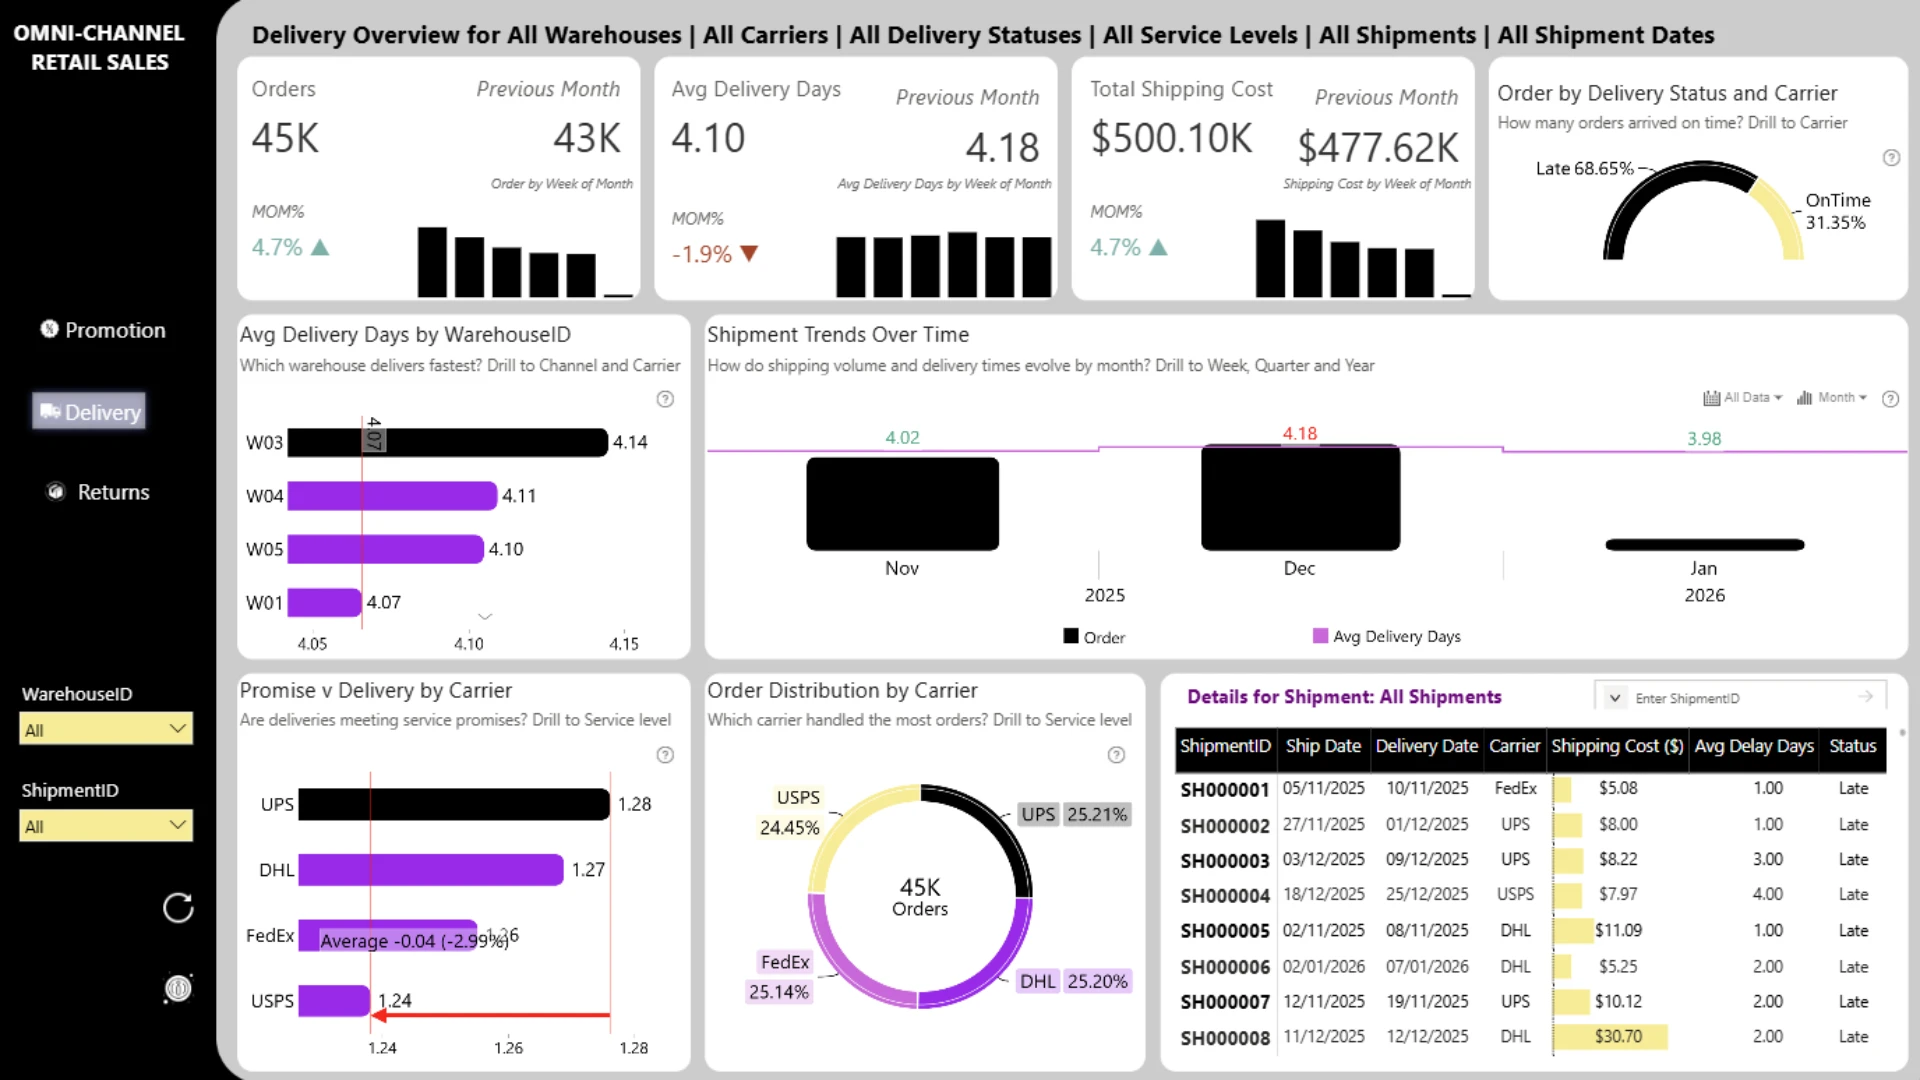
Page 2: Delivery Performance
Focused on delivery speed, cost, and reliability across carriers and warehouses. Visuals capture average delivery days, on-time vs. delayed shipments, and carrier-level performance - all linked to shipment-level drill-downs for deeper analysis.
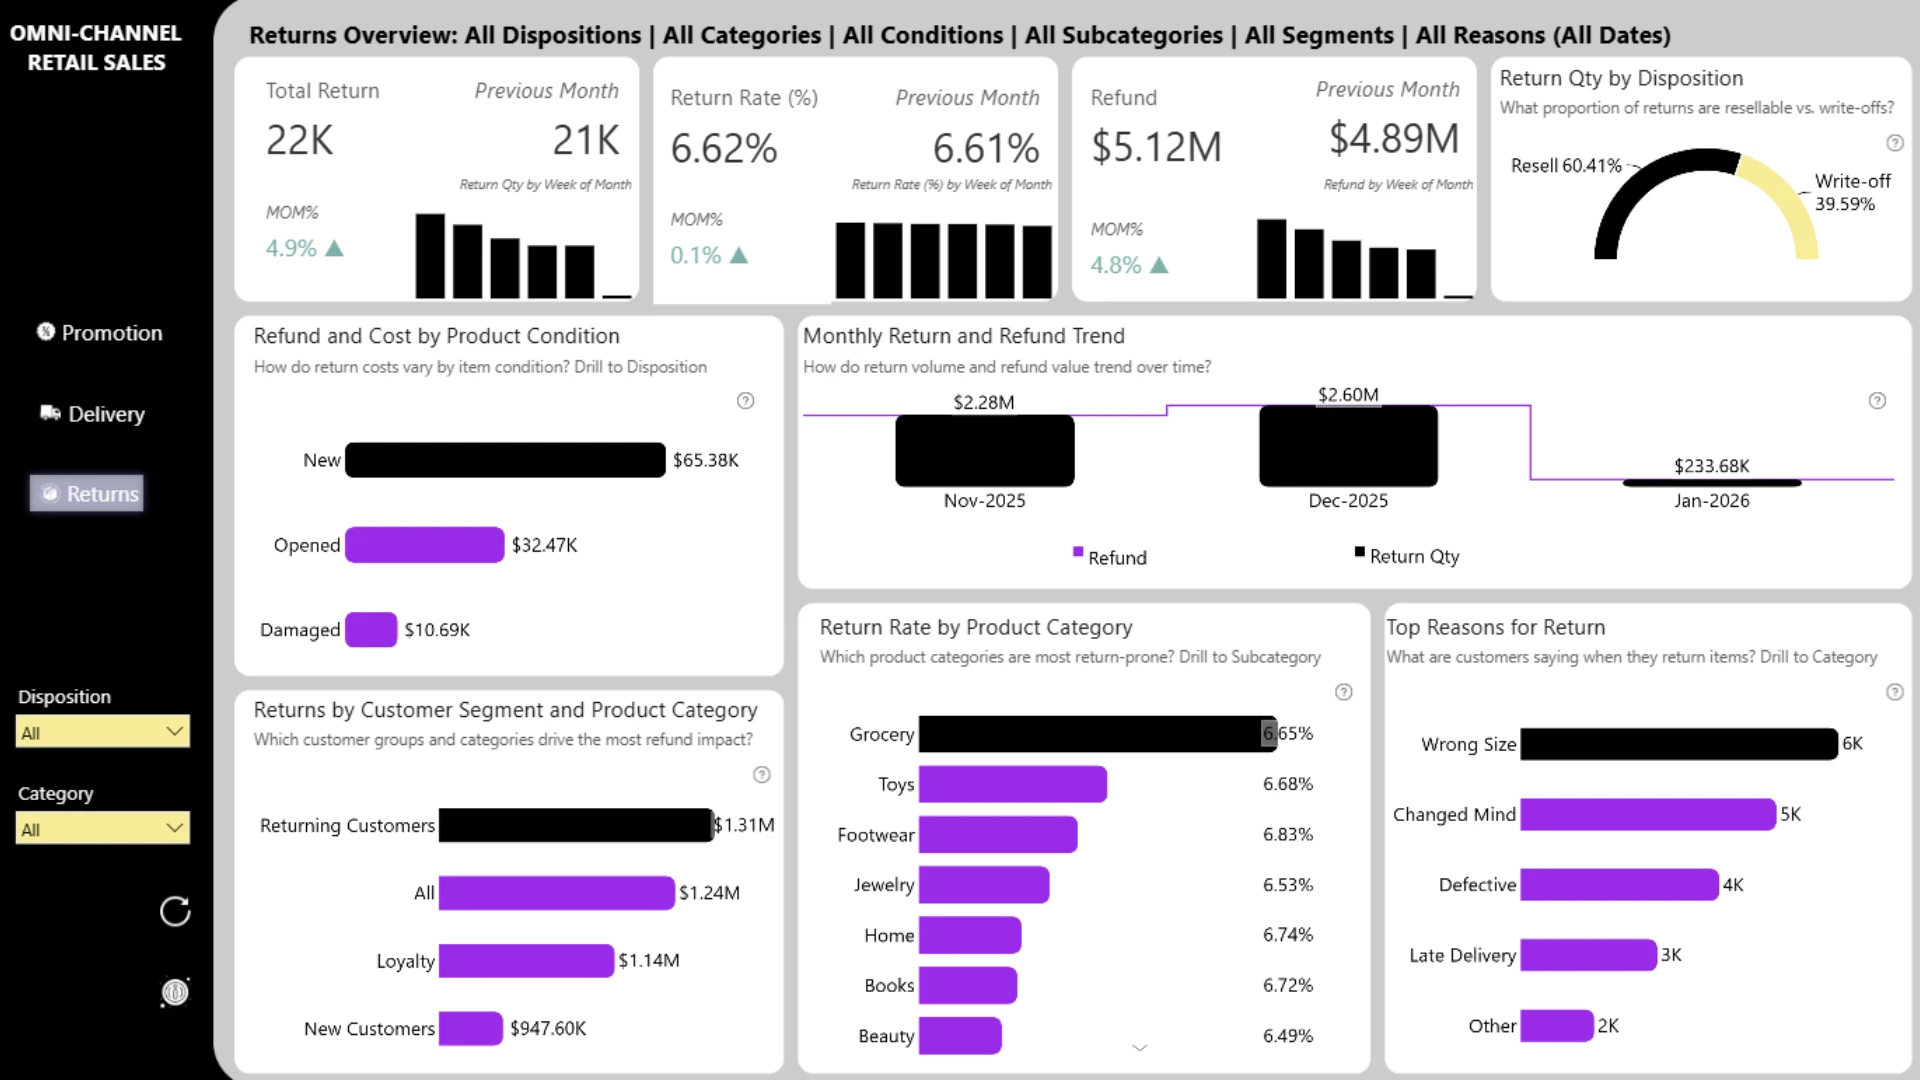
Page 3: Returns & Refunds
A breakdown of return rates, refund amounts, and root causes. Tracks return behavior by product condition, reason, and customer segment, helping the business reduce losses and optimize the post-purchase experience.
ZoomCharts visuals used




4U Report Challenges
Participate in data challenges, build and submit reports to get free template downloads.
Join CommunityMobile view allows you to interact with the report. To Download the template please switch to desktop view.
How to use a PBIX template
Preview the interactive report, download the PBIX file, open it in Power BI Desktop, and replace the same data connection with your own dataset.
Preview and download
Explore the report online and download the PBIX template file.
Open in Power BI Desktop
Open the downloaded PBIX file in Power BI Desktop.
Connect your data
Replace the sample data source with your own dataset.
Refresh and adjust
Refresh the model and update fields or visual were needed.
Save and share
Save your report and publish it for your audience.


