3681
Fintech Project Management Report
Fintech Project Management Report
More Report pages
Report Author: Akshay Patil
3681
Share template with others
This Power BI report uses the Fintech Project Management dataset and features ZoomCharts Drill Down PRO custom visuals for Power BI. It was submitted to the FP20 Analytics ZoomCharts Data Challenge 32 in November 2025.
Author's Description:
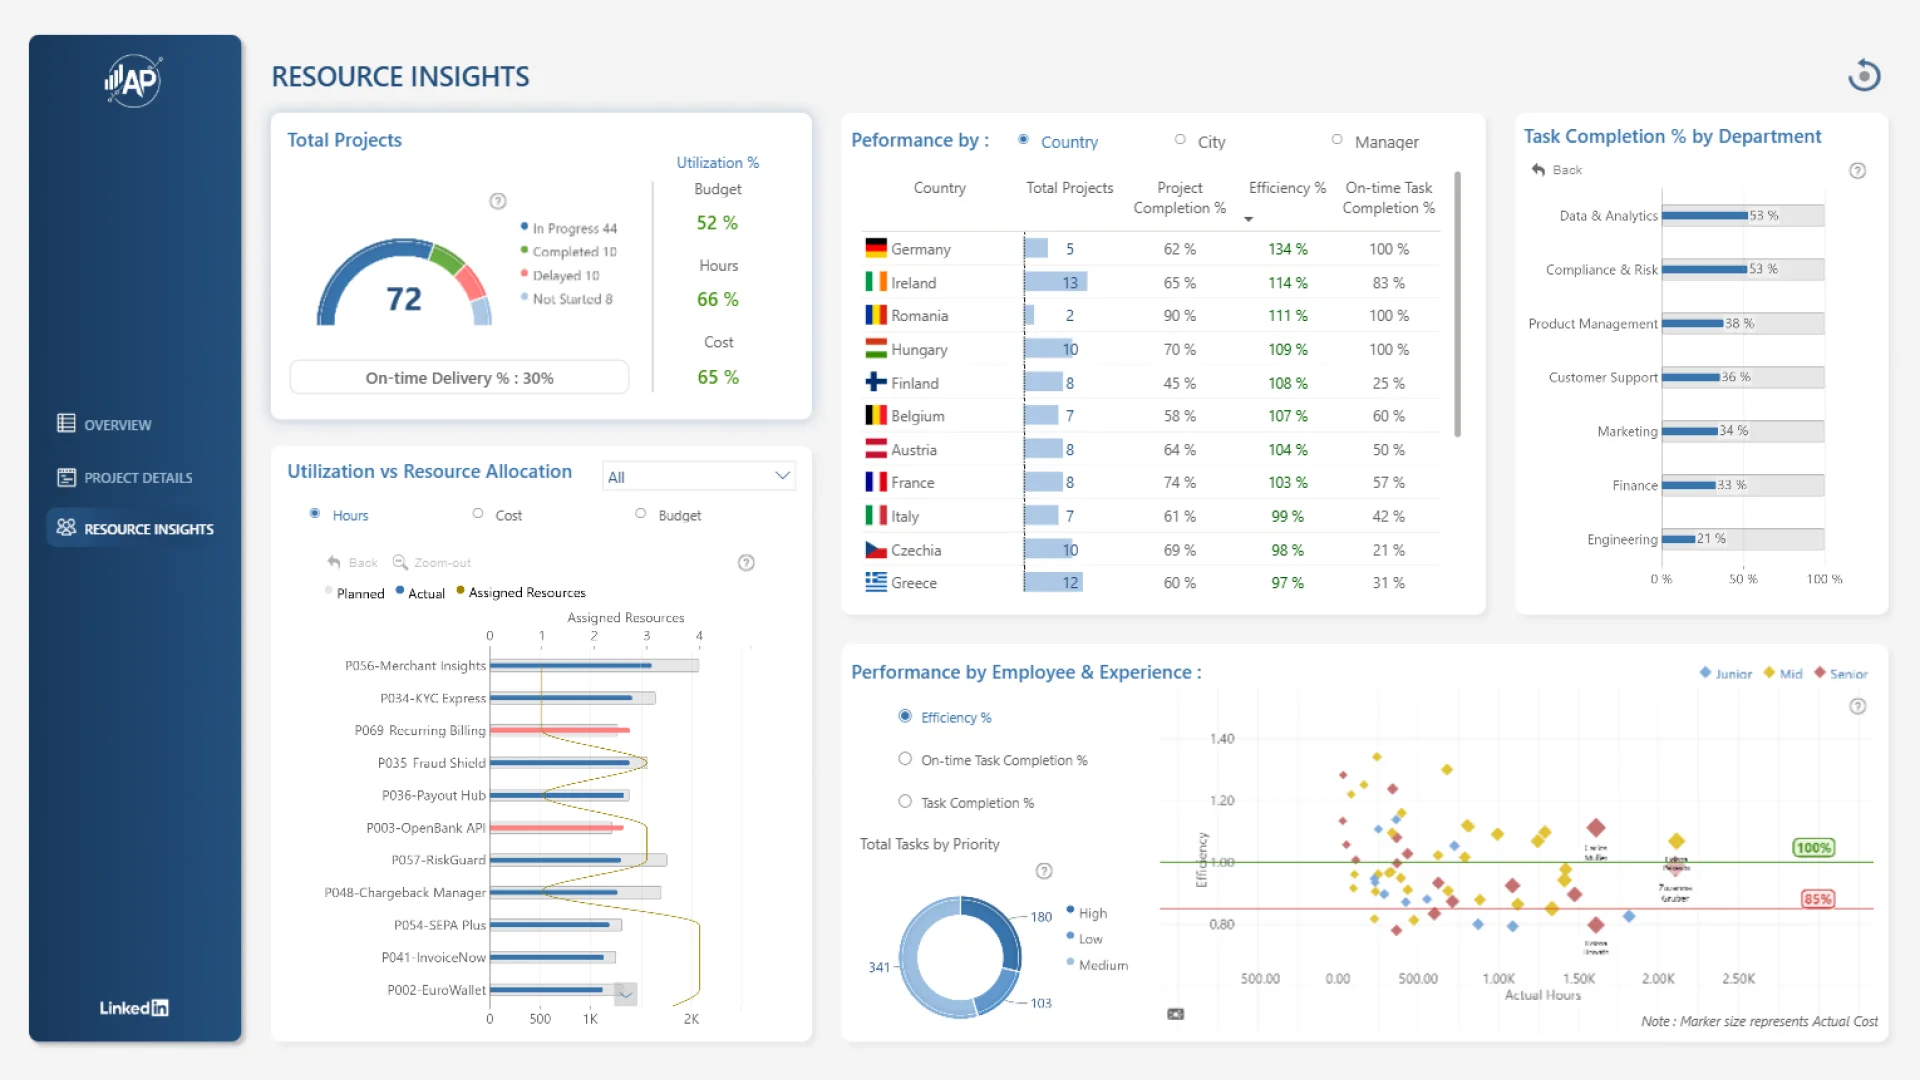
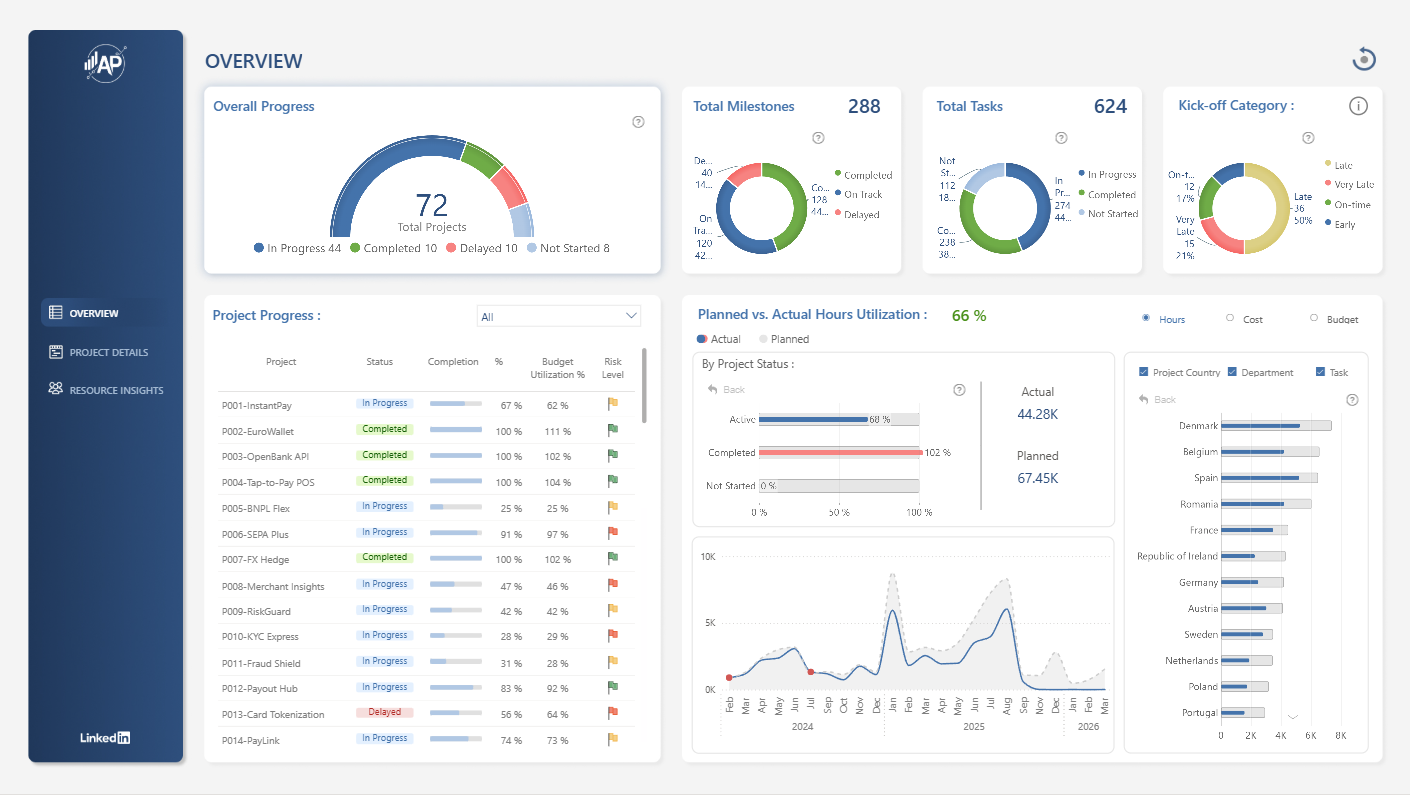
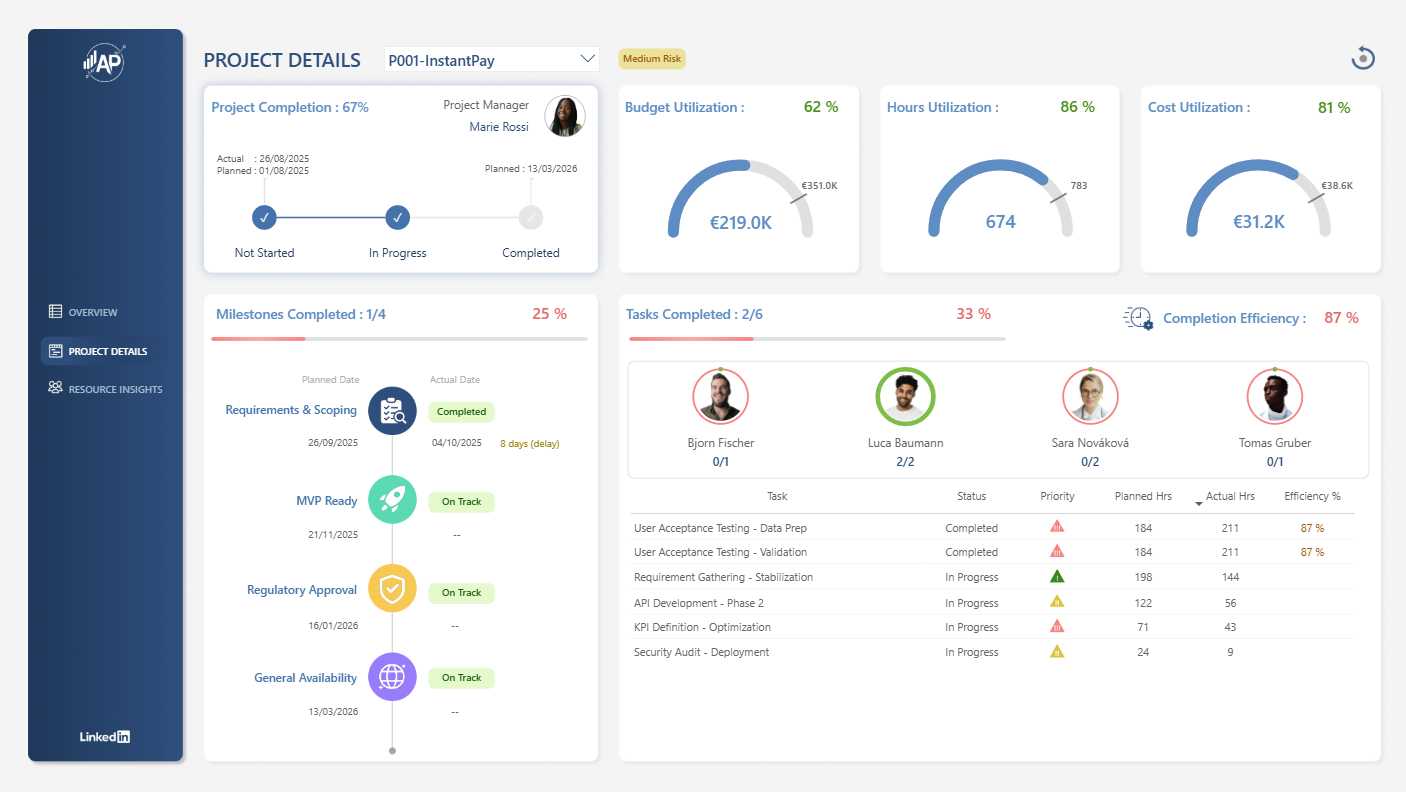
Built a three-page Power BI dashboard that transforms fintech project data into actionable intelligence. It delivers real-time progress tracking across projects, tasks, and milestones, provides clear visibility into budget utilization, and measures resource efficiency by seniority, country, and individual performance. The dashboard also highlights employee efficiency across teams and roles and exposes task-completion patterns that reveal bottlenecks before they become problems. Because managing fintech projects shouldn’t feel like reading a spreadsheet in the dark.
4U Report Challenges
Participate in data challenges, build and submit reports to get free template downloads.
Join CommunityMobile view allows you to interact with the report. To Download the template please switch to desktop view.


Was this helpful? Thank you for your feedback!
Sorry about that.
How can we improve it?