743
Financial Statements Reporting & Analysis 2
Financial Statements Reporting & Analysis 2
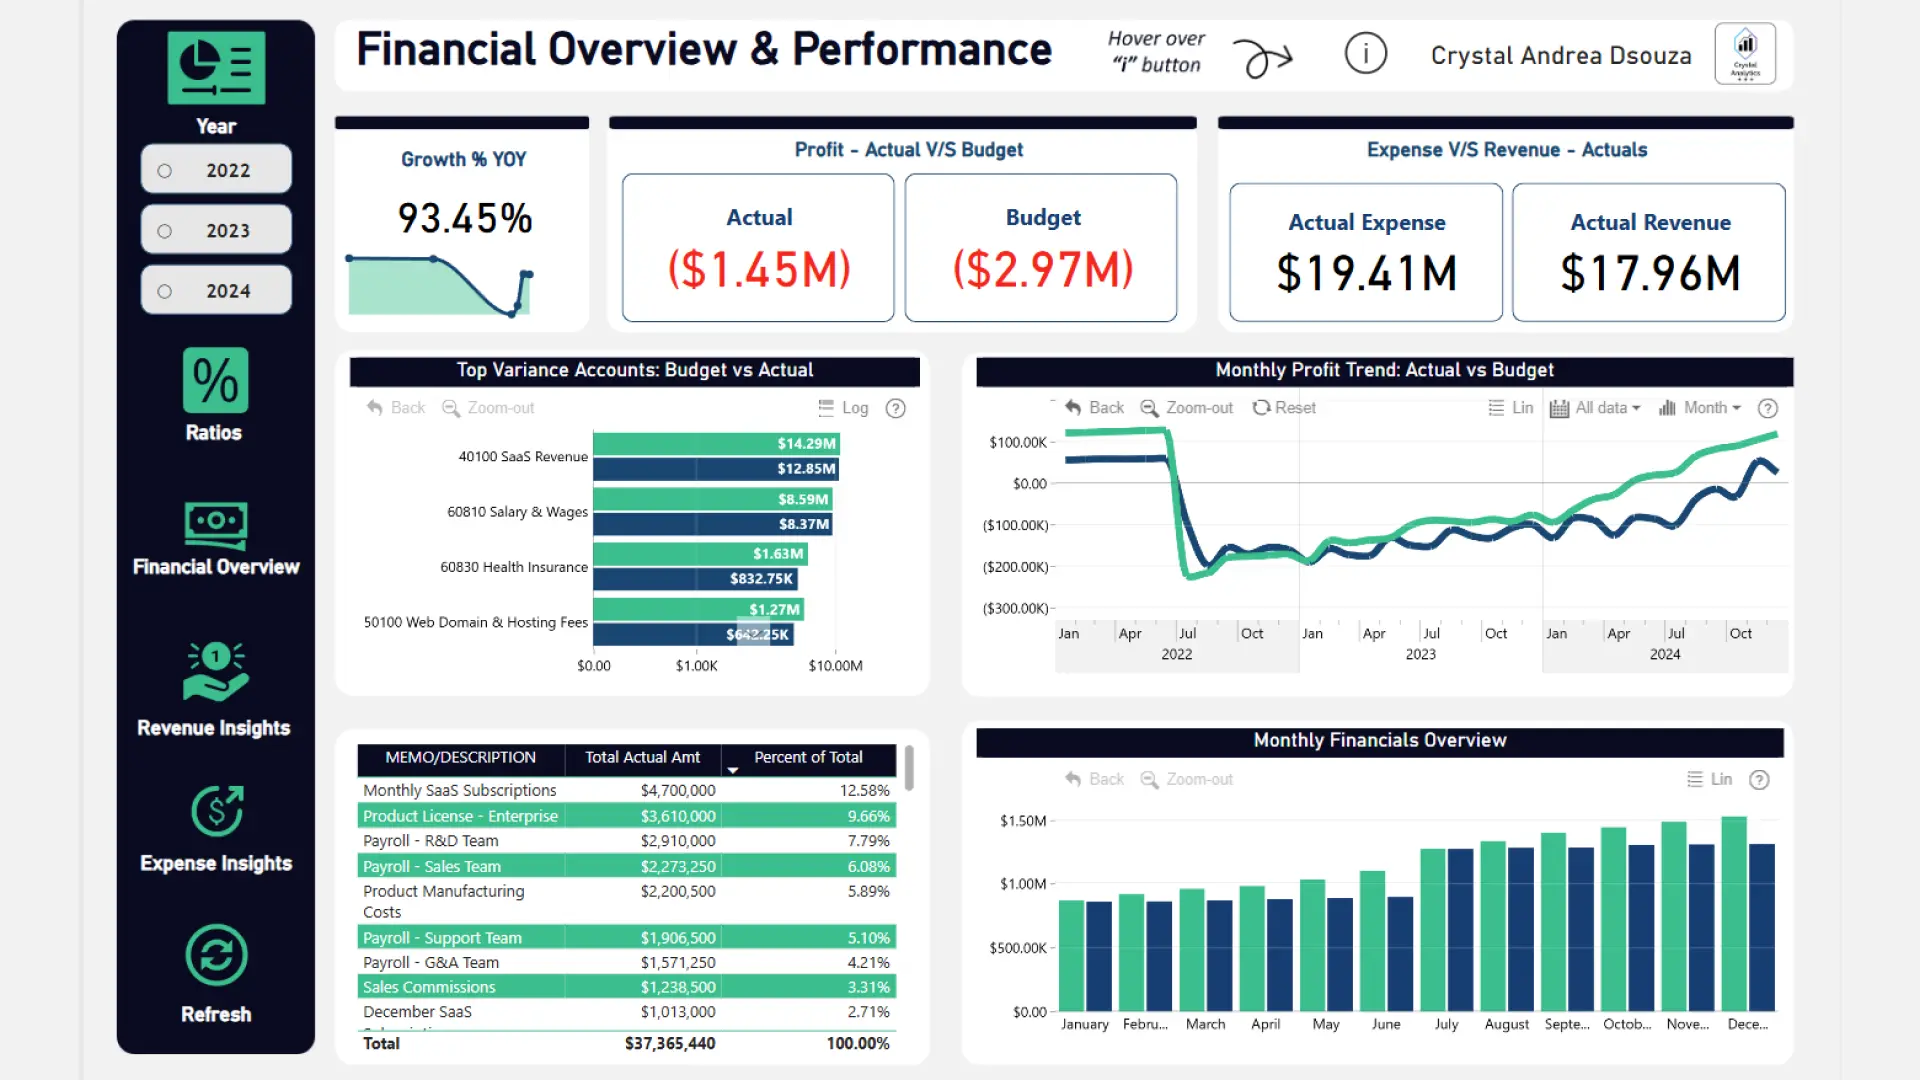
Report Author: Crystal Andrea Dsouza
743
Share template with others
Report submitted for the FP20 Analytics ZoomCharts Challenge, May 2025. The report was built using the Financial Statements dataset Analysis Dataset and includes ZoomCharts custom Drill Down PRO visuals for Power BI.
Author's Description:
𝑾𝒉𝒂𝒕 𝒕𝒉𝒆 𝒏𝒖𝒎𝒃𝒆𝒓𝒔 𝒔𝒂𝒚? The company ended the year with a Net Profit Ratio of -8.07%, which means it spent more than it earned. While there were some great revenue highs and strong client deals, high recurring expenses in admin and sales pushed it into the red. Cutting down on those costs and boosting revenue could help turn things around.
ZoomCharts visuals used
4U Report Challenges
Participate in data challenges, build and submit reports to get free template downloads.
Join CommunityMobile view allows you to interact with the report. To Download the template please switch to desktop view.


Was this helpful? Thank you for your feedback!
Sorry about that.
How can we improve it?