20776
Power BI Legal Operations Dashboard Example
Power BI Legal Operations Dashboard Example
More Report pages
Report Author: ZoomCharts
20776
Share template with others
Summary
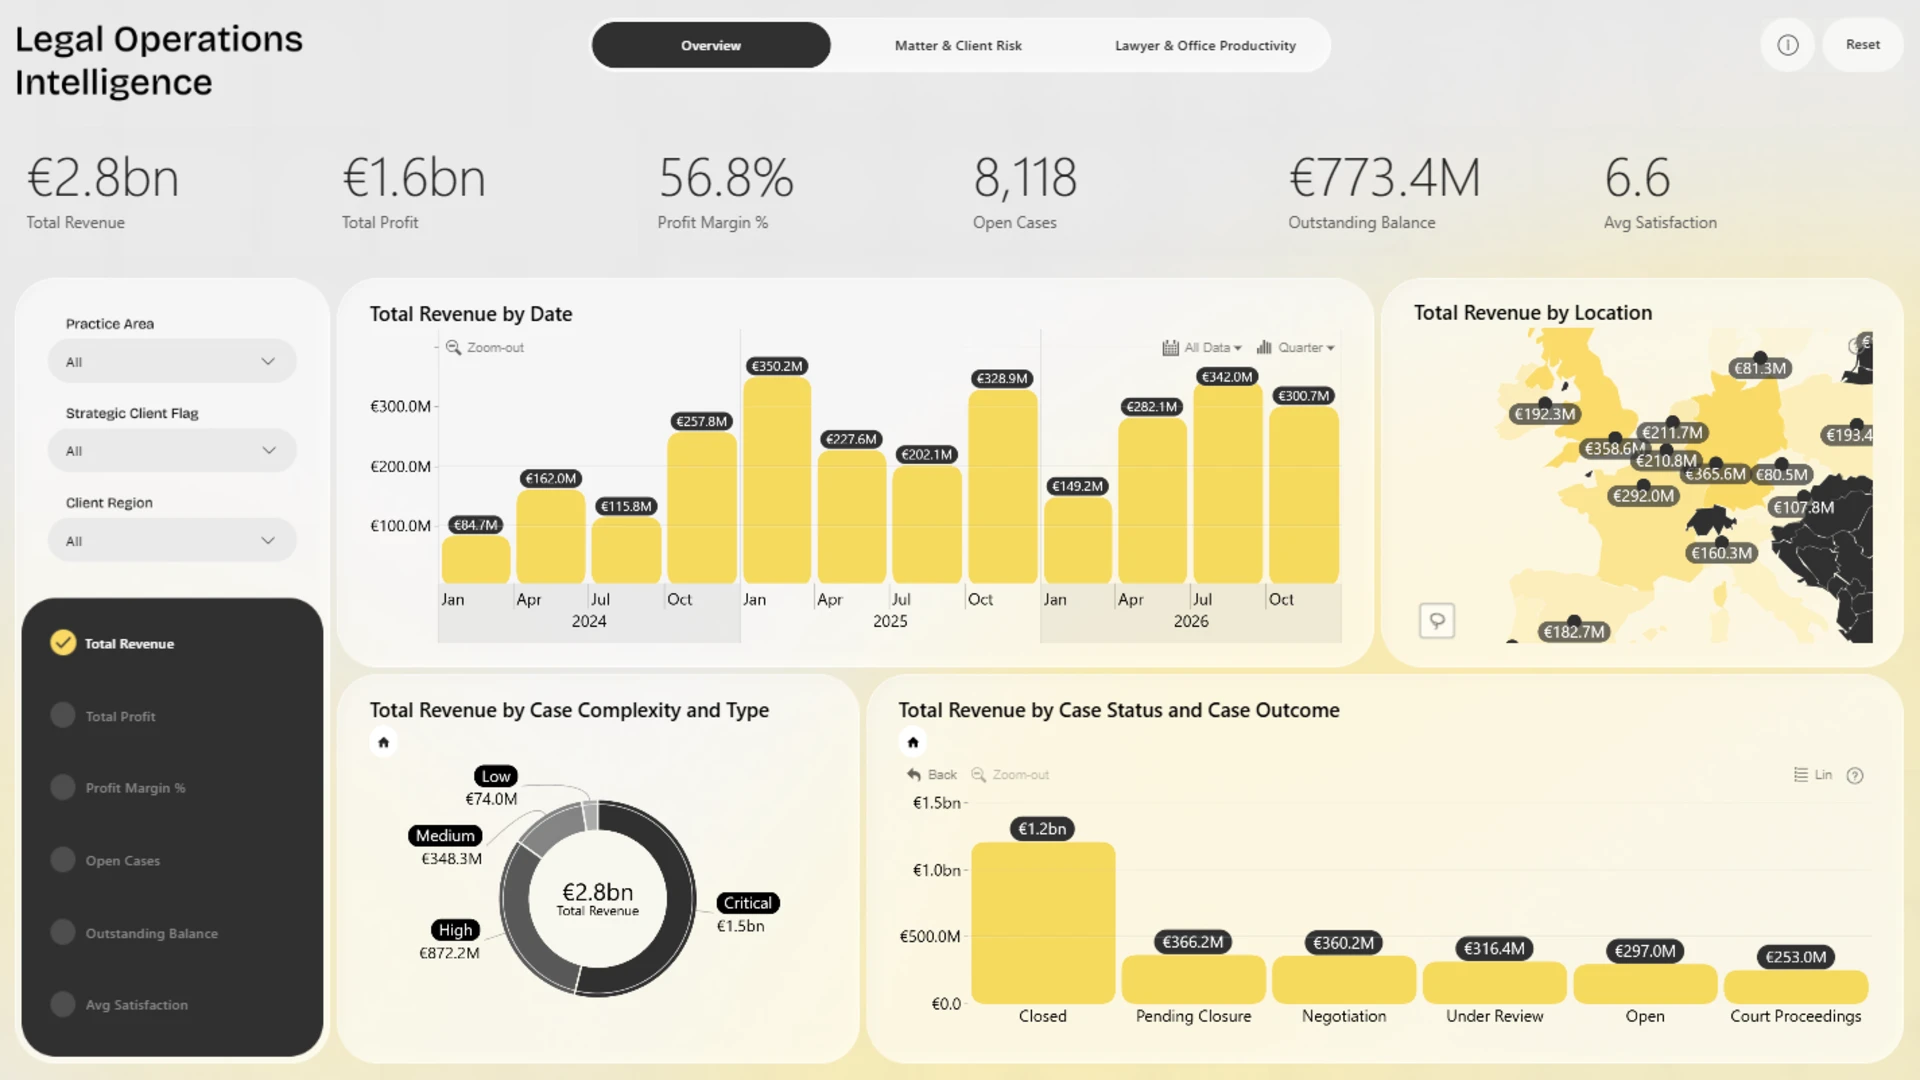
This Power BI Legal Operations Intelligence Dashboard helps law firm leaders and legal operations teams monitor financial performance, matter risk, client balances, case outcomes, and lawyer productivity in one report.
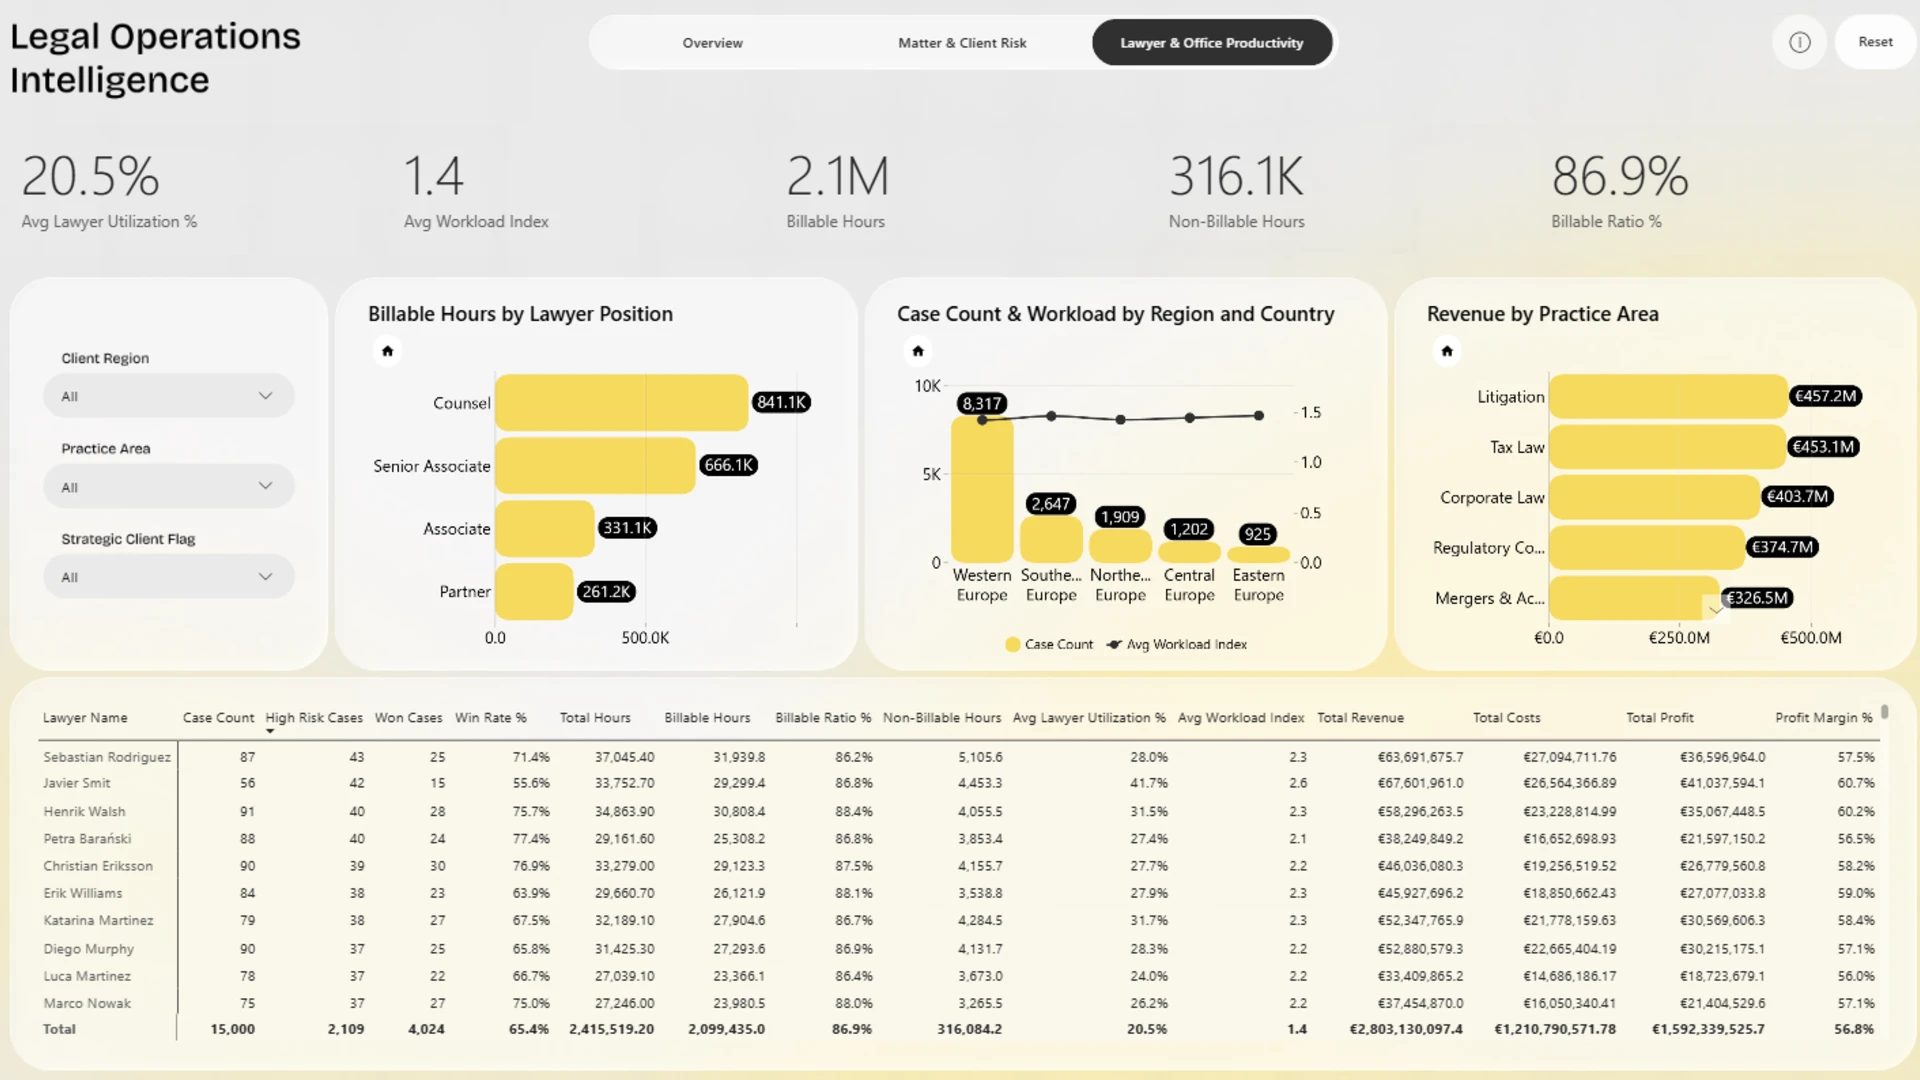
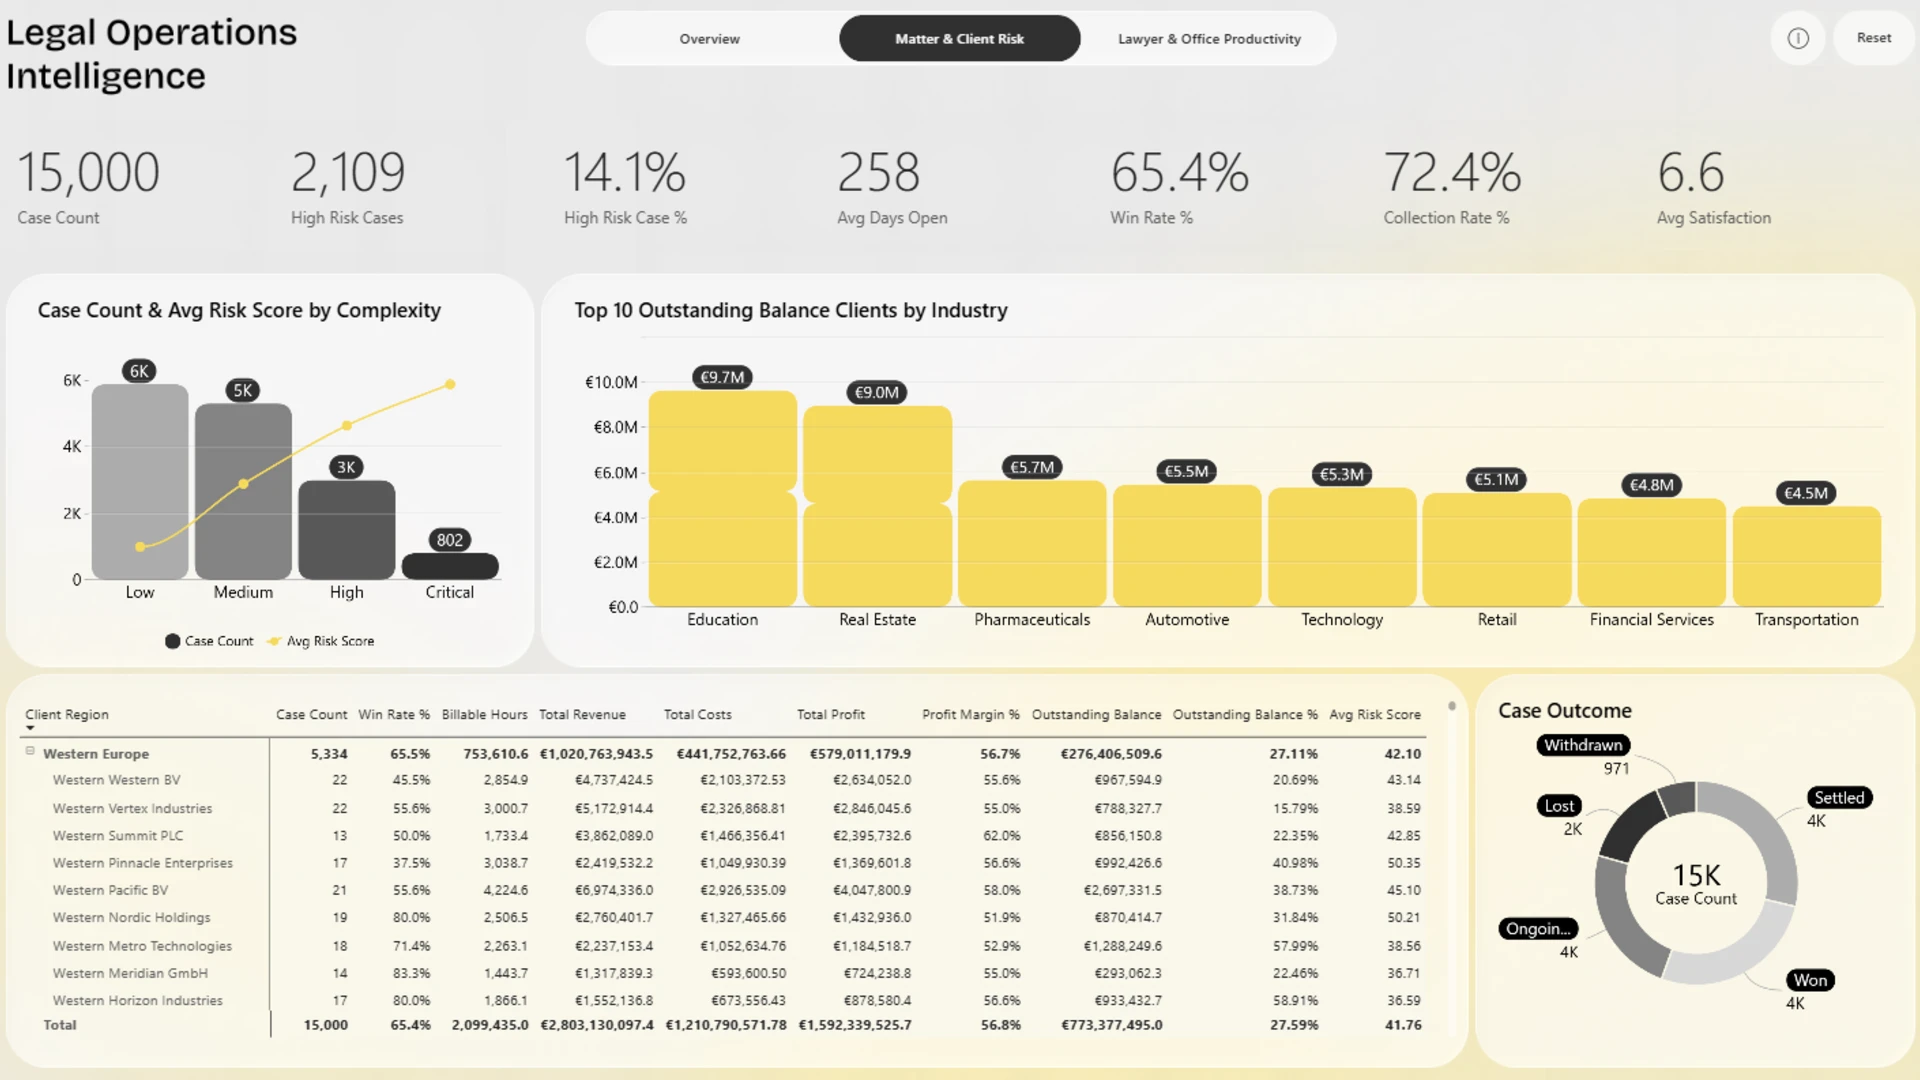
The dashboard connects executive KPIs with detailed analysis across practice areas, regions, clients, matters, and lawyer roles, making it easier to identify risks, workload issues, and performance trends.
Key Insights of the Legal Operations Intelligence Dashboard
The report is structured across three views: Overview, Client Risk, and Productivity. Key insights include:
- Financial performance: Track revenue, profit, profit margin, costs, outstanding balances, and collection rates.
- Matter and client risk: Review open and high-risk cases, risk scores, case complexity, client exposure, and outcomes such as won, lost, settled, withdrawn, and ongoing matters.
- Lawyer productivity: Analyze billable and non-billable hours, billable ratio, utilization, workload, and lawyer-level performance.
- Practice area performance: Compare revenue across litigation, tax law, corporate law, regulatory work, and mergers and acquisitions.
Interactive Power BI visuals allow users to filter the report and move from high-level legal operations KPIs to detailed client, matter, region, and lawyer analysis. This helps teams examine how matter risk, client balances, profitability, and workload affect overall performance.
This report was created by ZoomCharts.
How to Use This Legal Operations Intelligence Dashboard
Use the report pages to review the overall health of legal operations, identify high-risk matters, examine outstanding client balances, compare case outcomes, and understand how lawyer workload affects billable performance. Click active elements within the charts to filter the data and explore individual categories in more detail.
Download the .pbix file to review the report settings, formulas, and calculations, or adapt the dashboard to your own legal operations data.
ZoomCharts visuals used





4U Report Challenges
Participate in data challenges, build and submit reports to get free template downloads.
Join CommunityMobile view allows you to interact with the report. To Download the template please switch to desktop view.
How to use a PBIX template
Preview the interactive report, download the PBIX file, open it in Power BI Desktop, and replace the same data connection with your own dataset.
Preview and download
Explore the report online and download the PBIX template file.
Open in Power BI Desktop
Open the downloaded PBIX file in Power BI Desktop.
Connect your data
Replace the sample data source with your own dataset.
Refresh and adjust
Refresh the model and update fields or visual were needed.
Save and share
Save your report and publish it for your audience.


