425
Executive Oil & Gas KPI Dashboard | Power BI Analytics
Executive Oil & Gas KPI Dashboard | Power BI Analytics
More Report pages
Report Author: Odunlami Zainab
425
Share template with others
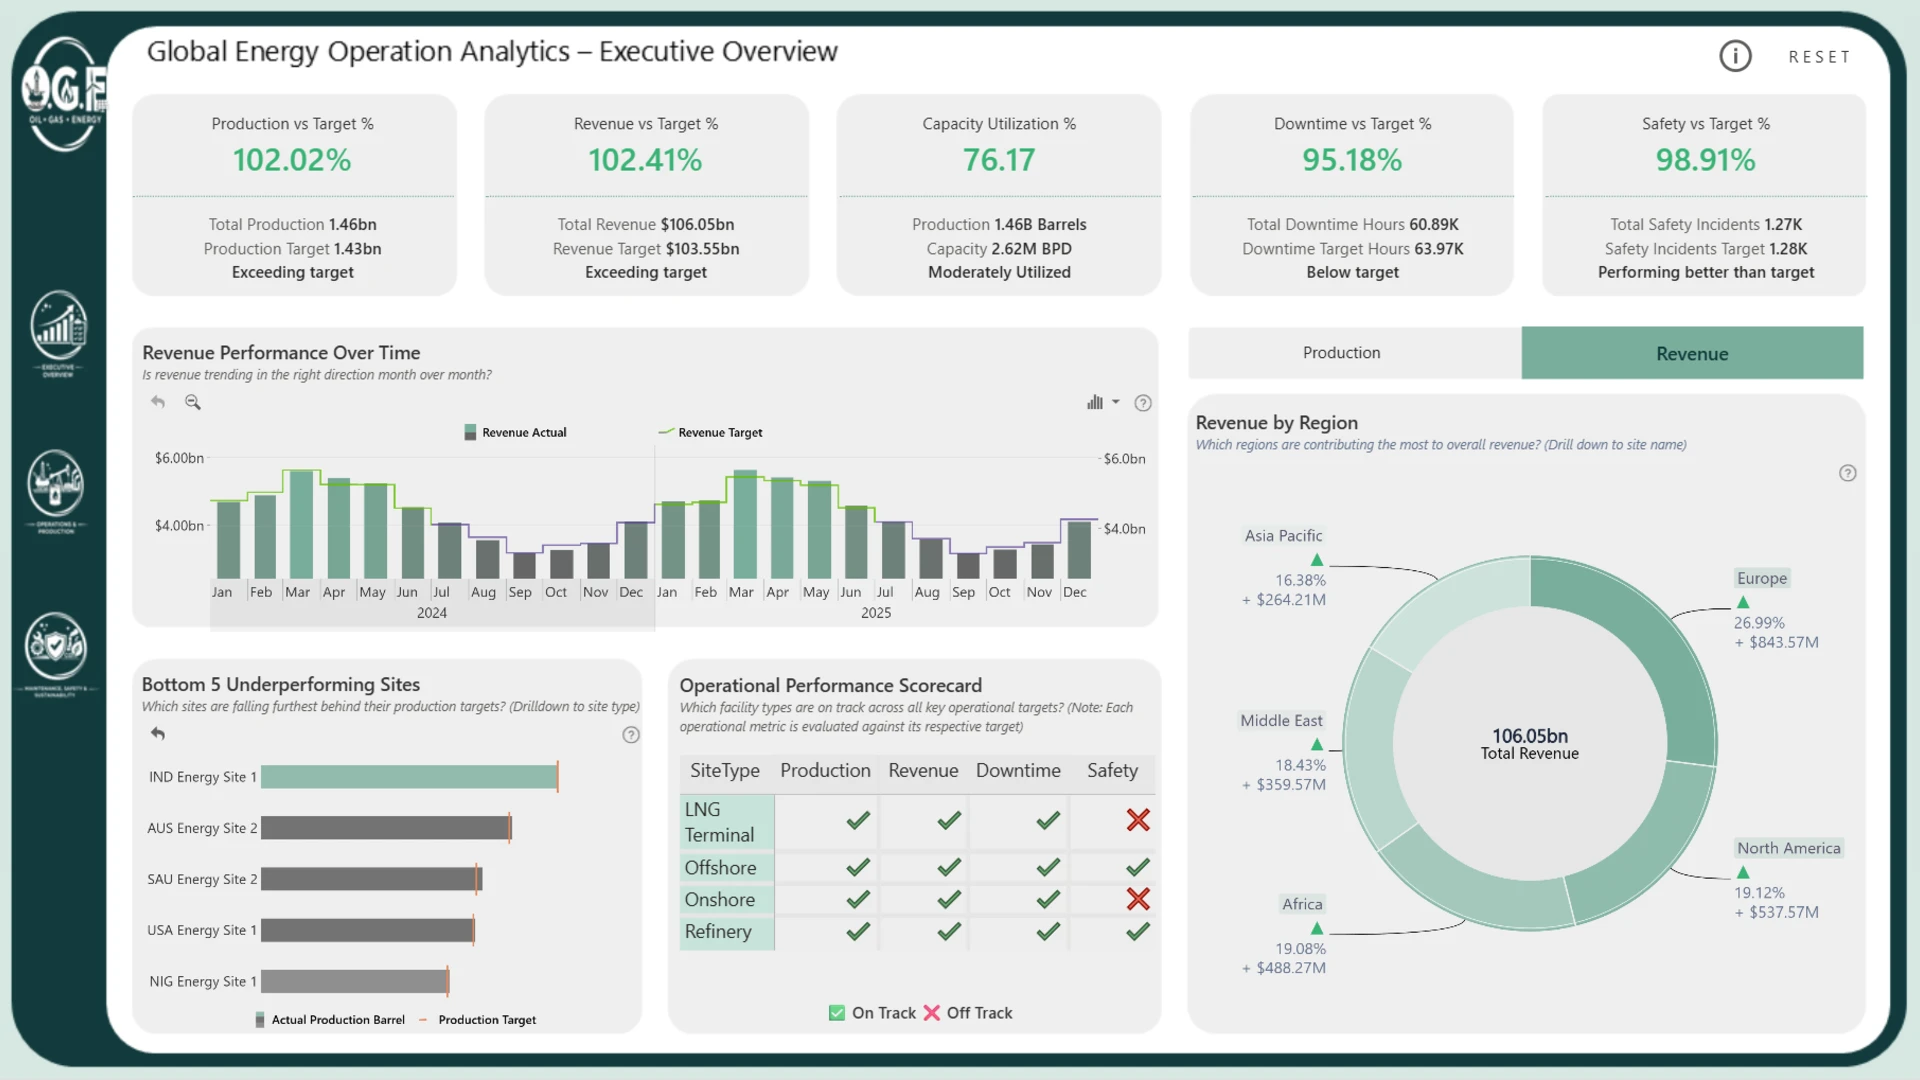
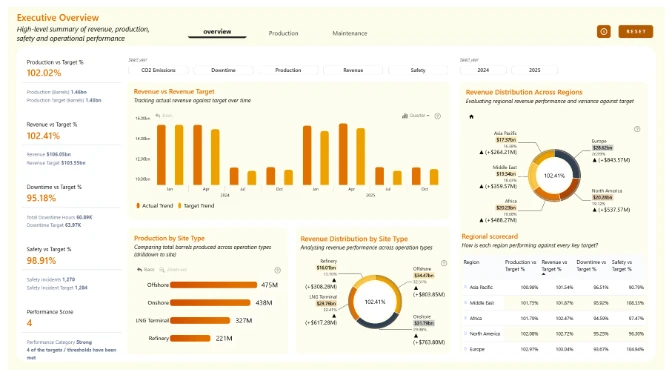
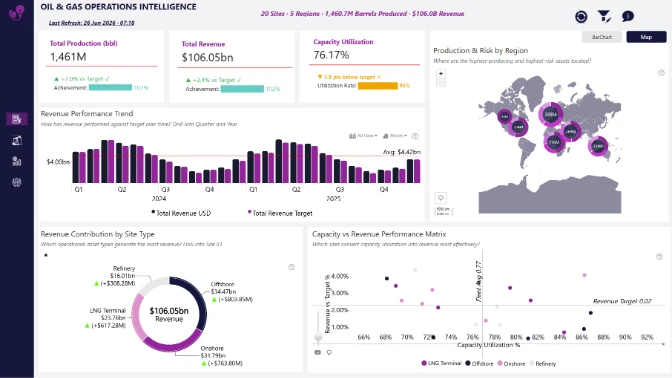
Explore an interactive Power BI dashboard for executive KPIs for Oil & Gas operations. Built with native Power BI visuals and ZoomCharts Drill Down Visuals, the report helps analyze production, maintenance, downtime, safety, sustainability, operational performance, and financial KPIs to support better business decisions. This report was created for the ZoomCharts 4U Report Challenge June 2026, where Power BI developers showcase their data visualization expertise by solving real-world business use cases using native Power BI visuals together with ZoomCharts Drill Down Visuals.
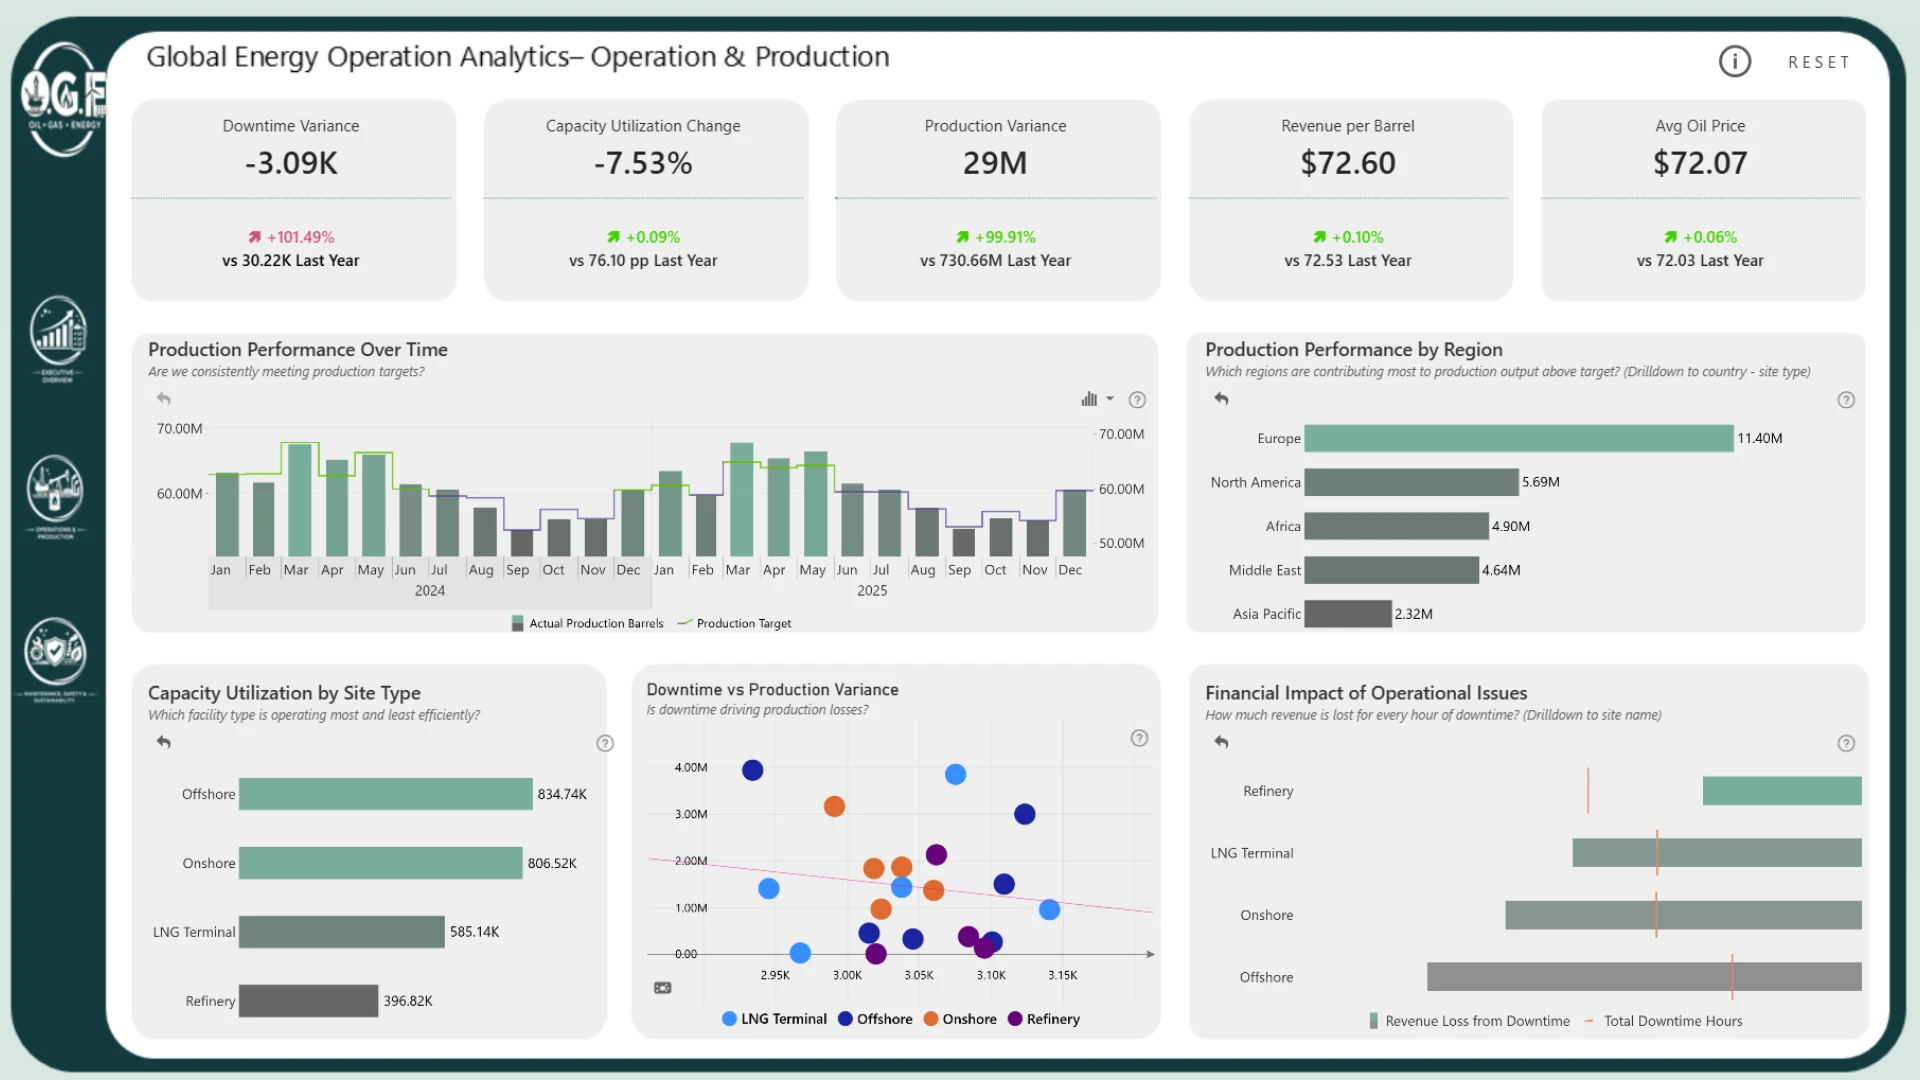
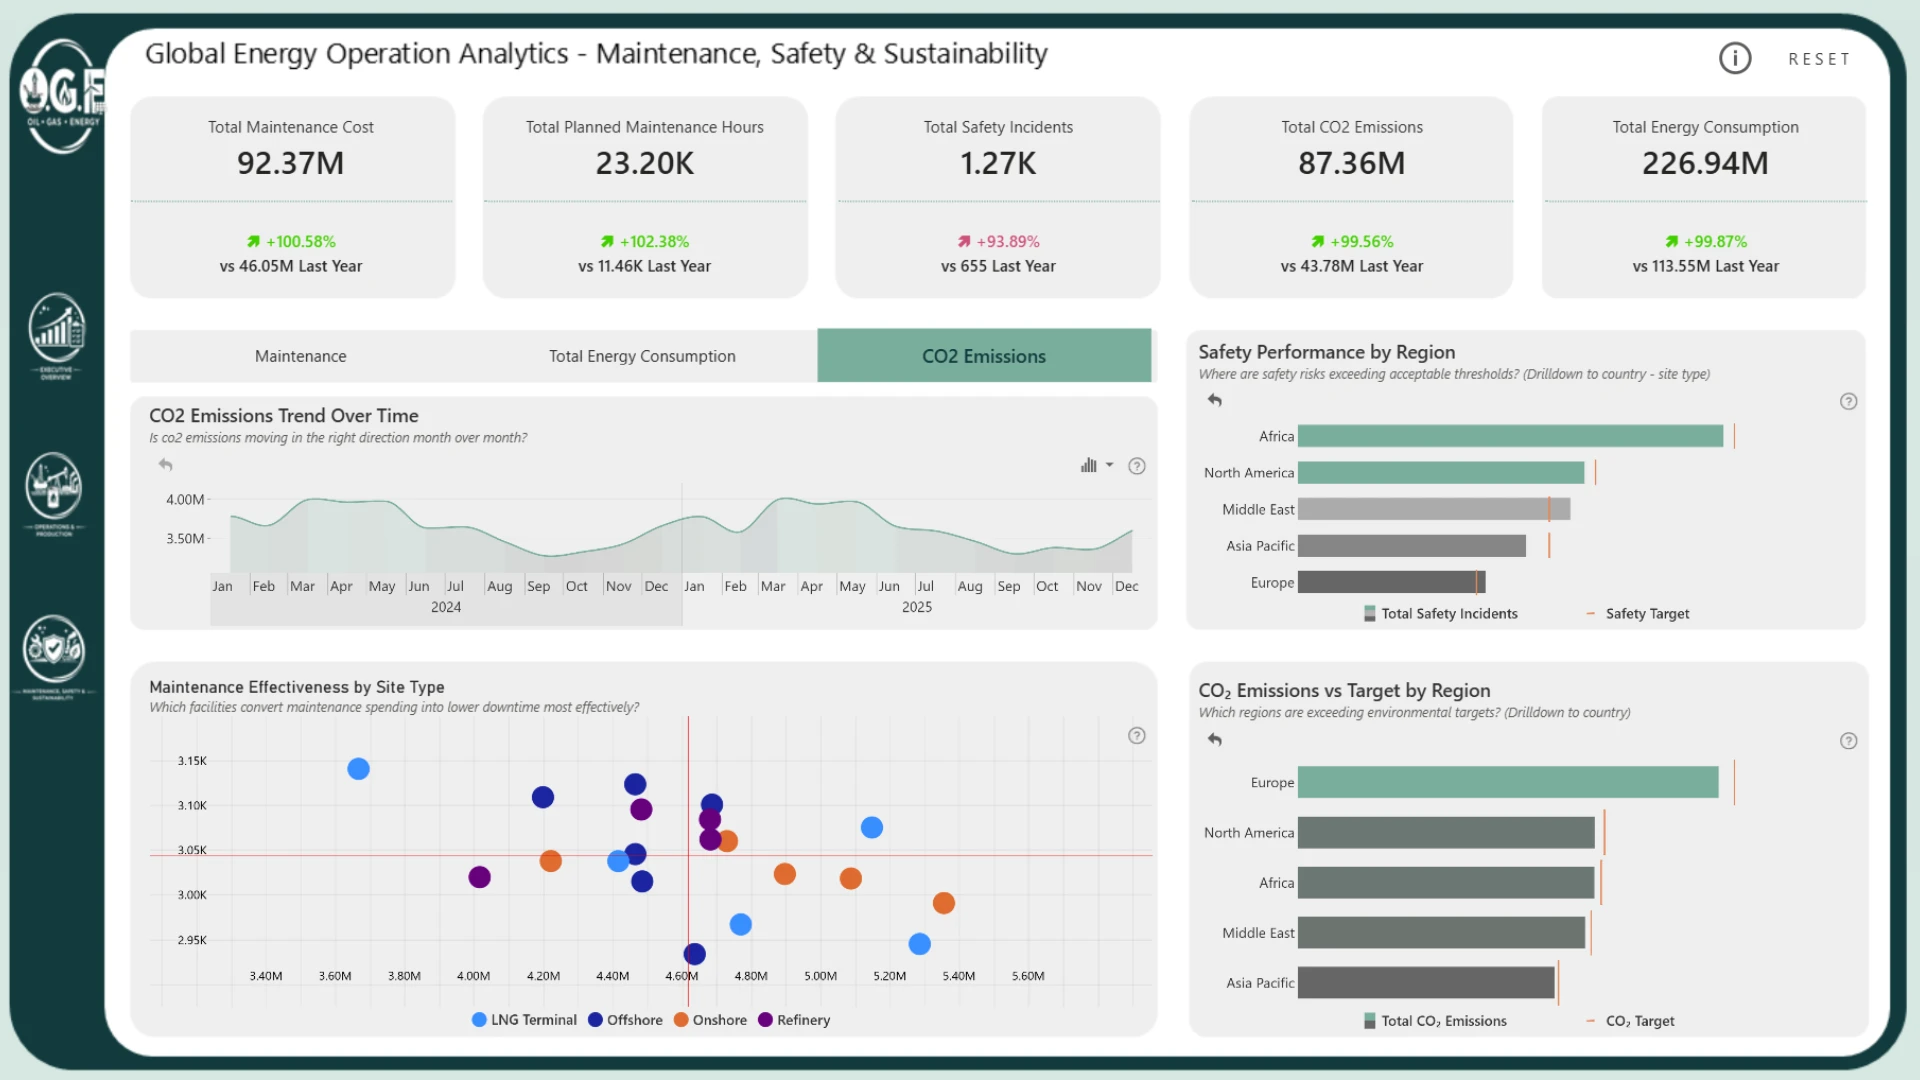
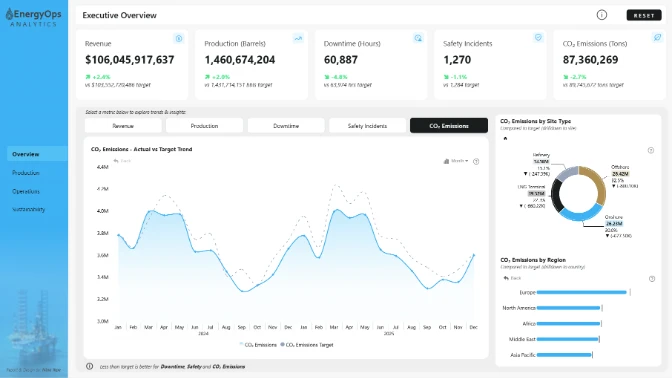
Author's description: This Power BI report delivers end-to-end visibility across Oil, Gas & Energy operations. Executives get a high-level command centre tracking production, revenue, capacity, and safety performance against targets. Operations managers can deep dive into production efficiency, downtime impact, and the financial cost of operational issues. Plant leaders have a focused view of maintenance effectiveness, safety risk, and environmental sustainability across all sites and regions.
ZoomCharts visuals used
4U Report Challenges
Participate in data challenges, build and submit reports to get free template downloads.
Join CommunityMobile view allows you to interact with the report. To Download the template please switch to desktop view.
Was this helpful? Thank you for your feedback!
Sorry about that.
How can we improve it?