246
Power BI Energy KPI Analytics Report
Power BI Energy KPI Analytics Report
More Report pages
Report Author: Hasan Ayaz
246
Share template with others
Explore an interactive Power BI dashboard for energy KPI analytics. Built with native Power BI visuals and ZoomCharts Drill Down Visuals, the report helps analyze production, maintenance, downtime, safety, sustainability, operational performance, and financial KPIs to support better business decisions. This report was created for the ZoomCharts 4U Report Challenge June 2026, where Power BI developers showcase their data visualization expertise by solving real-world business use cases using native Power BI visuals together with ZoomCharts Drill Down Visuals.
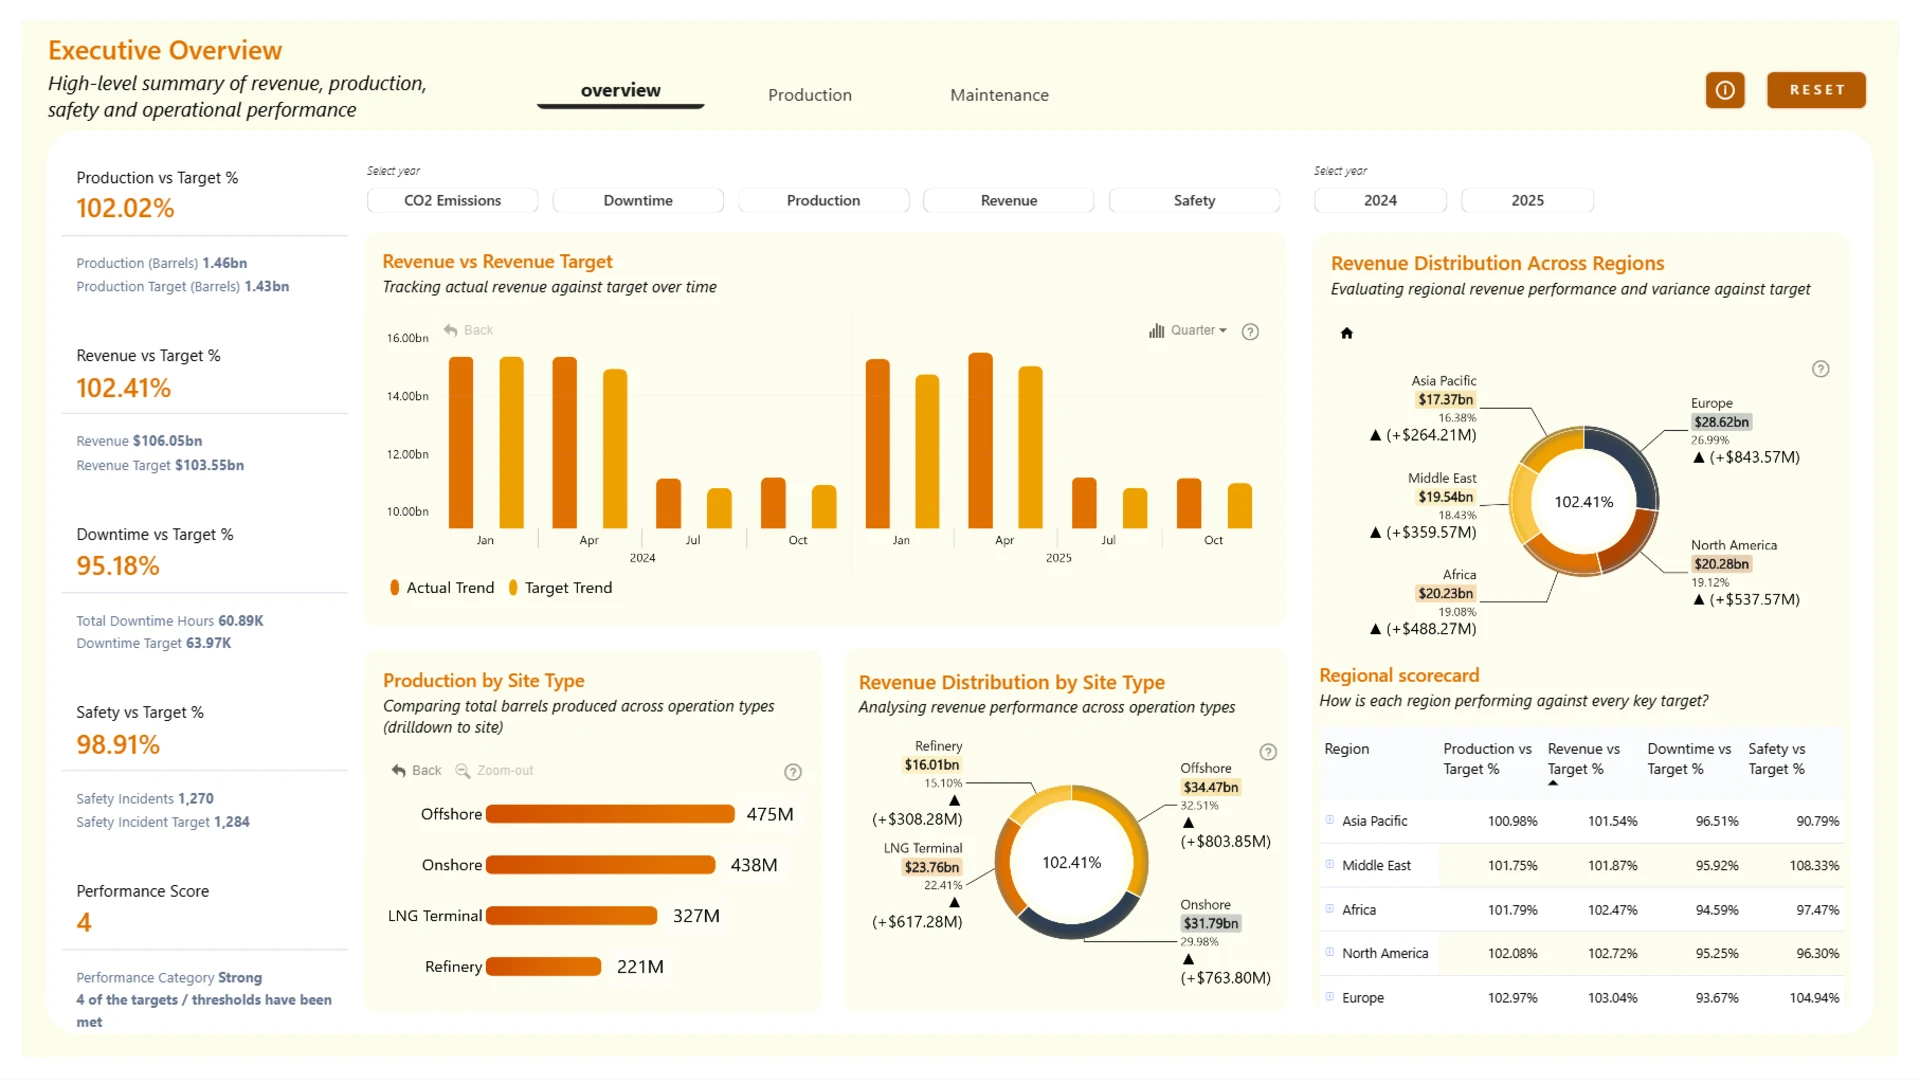
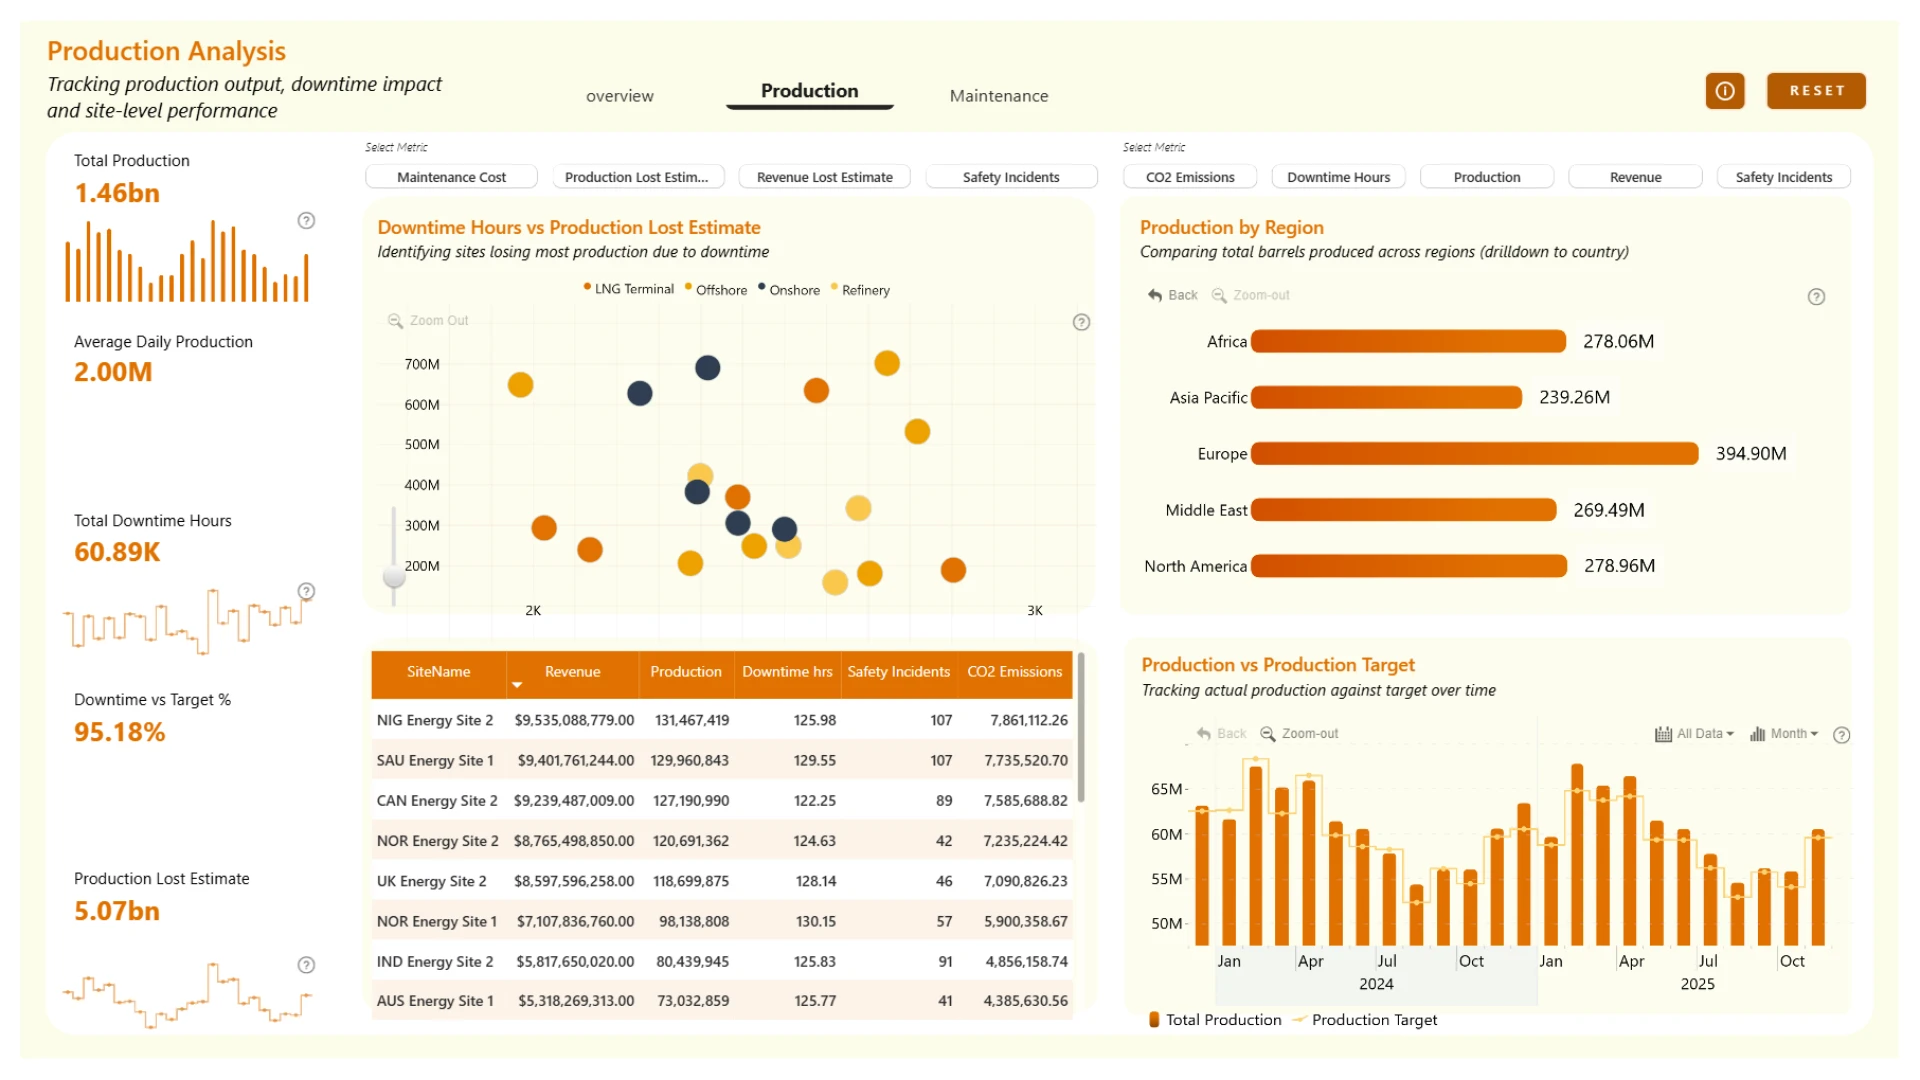
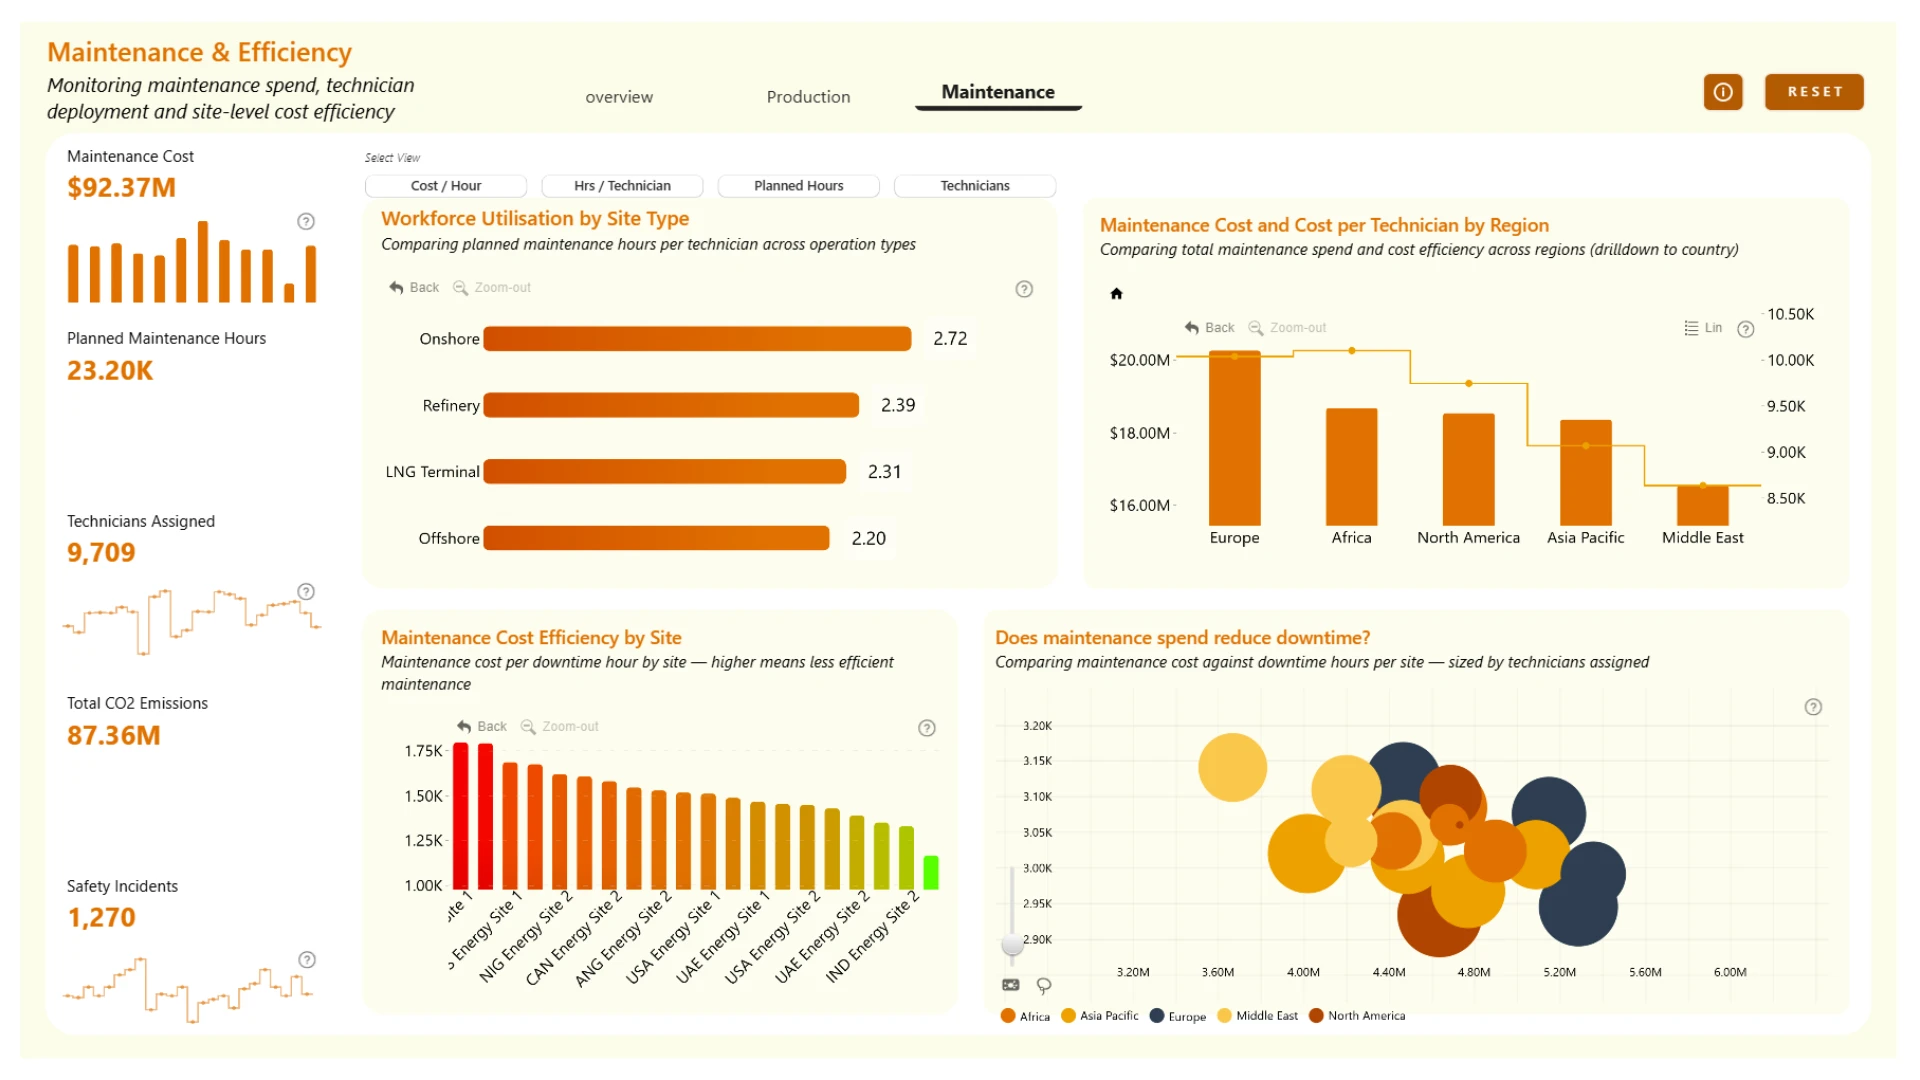
Author's description: Energy Operations Dashboard – 3-Page Interactive Report This dashboard tracks the performance of an energy company across three key areas: Page 1 – Executive Overview A high-level summary showing how the company is performing against its targets. Production is at 102.61%, revenue at 103.25%, and safety at 100.57%. It includes a regional scorecard and revenue distribution across Africa, Europe, Asia Pacific, Middle East, and North America. Page 2 – Production Analysis Dives into production output, downtime, and site-level performance. Total production reached 1.46 billion barrels, with 60.89K downtime hours. Charts compare downtime vs. production loss by site type and track actual production against targets over time. Page 3 – Maintenance & Efficiency Focuses on maintenance spend and workforce efficiency. Total maintenance cost is $92.37M with 9,709 technicians assigned. Visuals show workforce utilisation by site type, cost efficiency by site, and whether maintenance spending actually reduces downtime.
ZoomCharts visuals used
4U Report Challenges
Participate in data challenges, build and submit reports to get free template downloads.
Join CommunityMobile view allows you to interact with the report. To Download the template please switch to desktop view.


Was this helpful? Thank you for your feedback!
Sorry about that.
How can we improve it?