317
Oil & Gas Production Analytics Report for Power BI
Oil & Gas Production Analytics Report for Power BI
More Report pages
Report Author: Akindele Omolayo
317
Share template with others
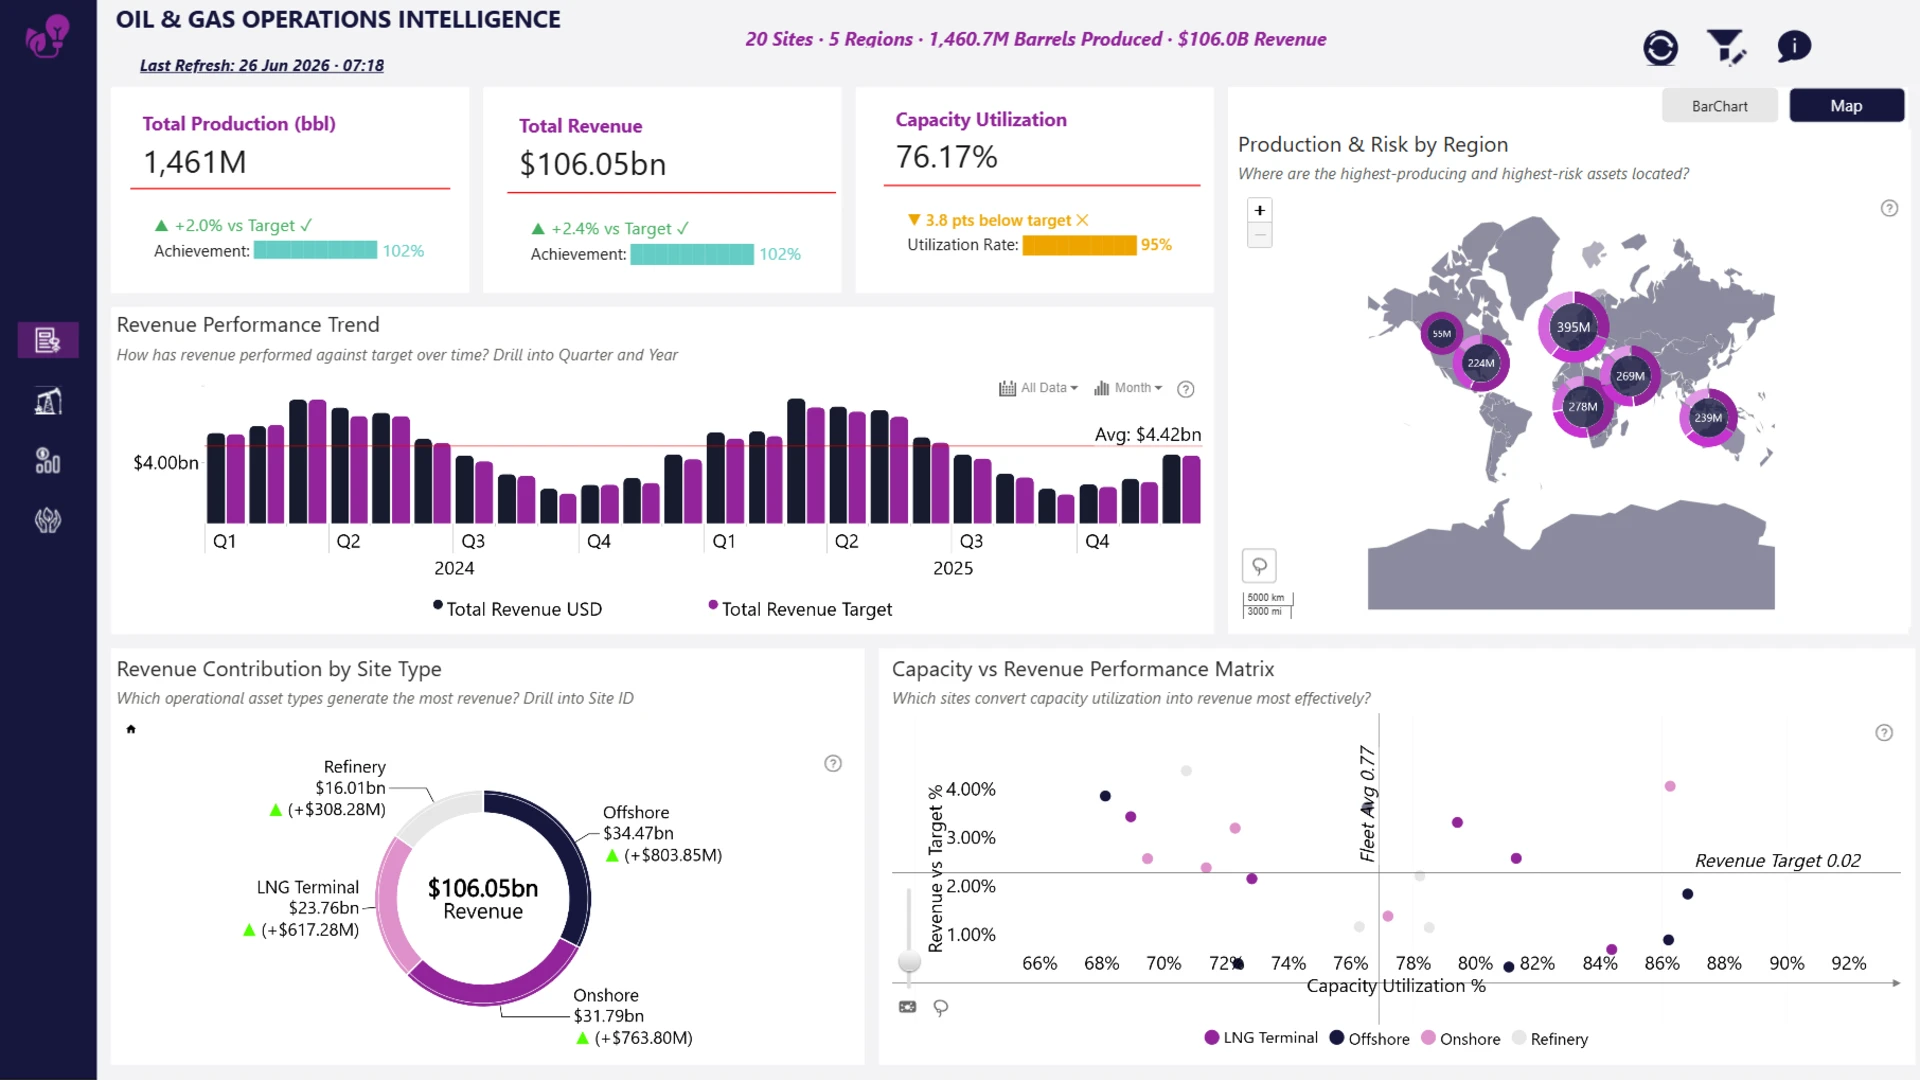
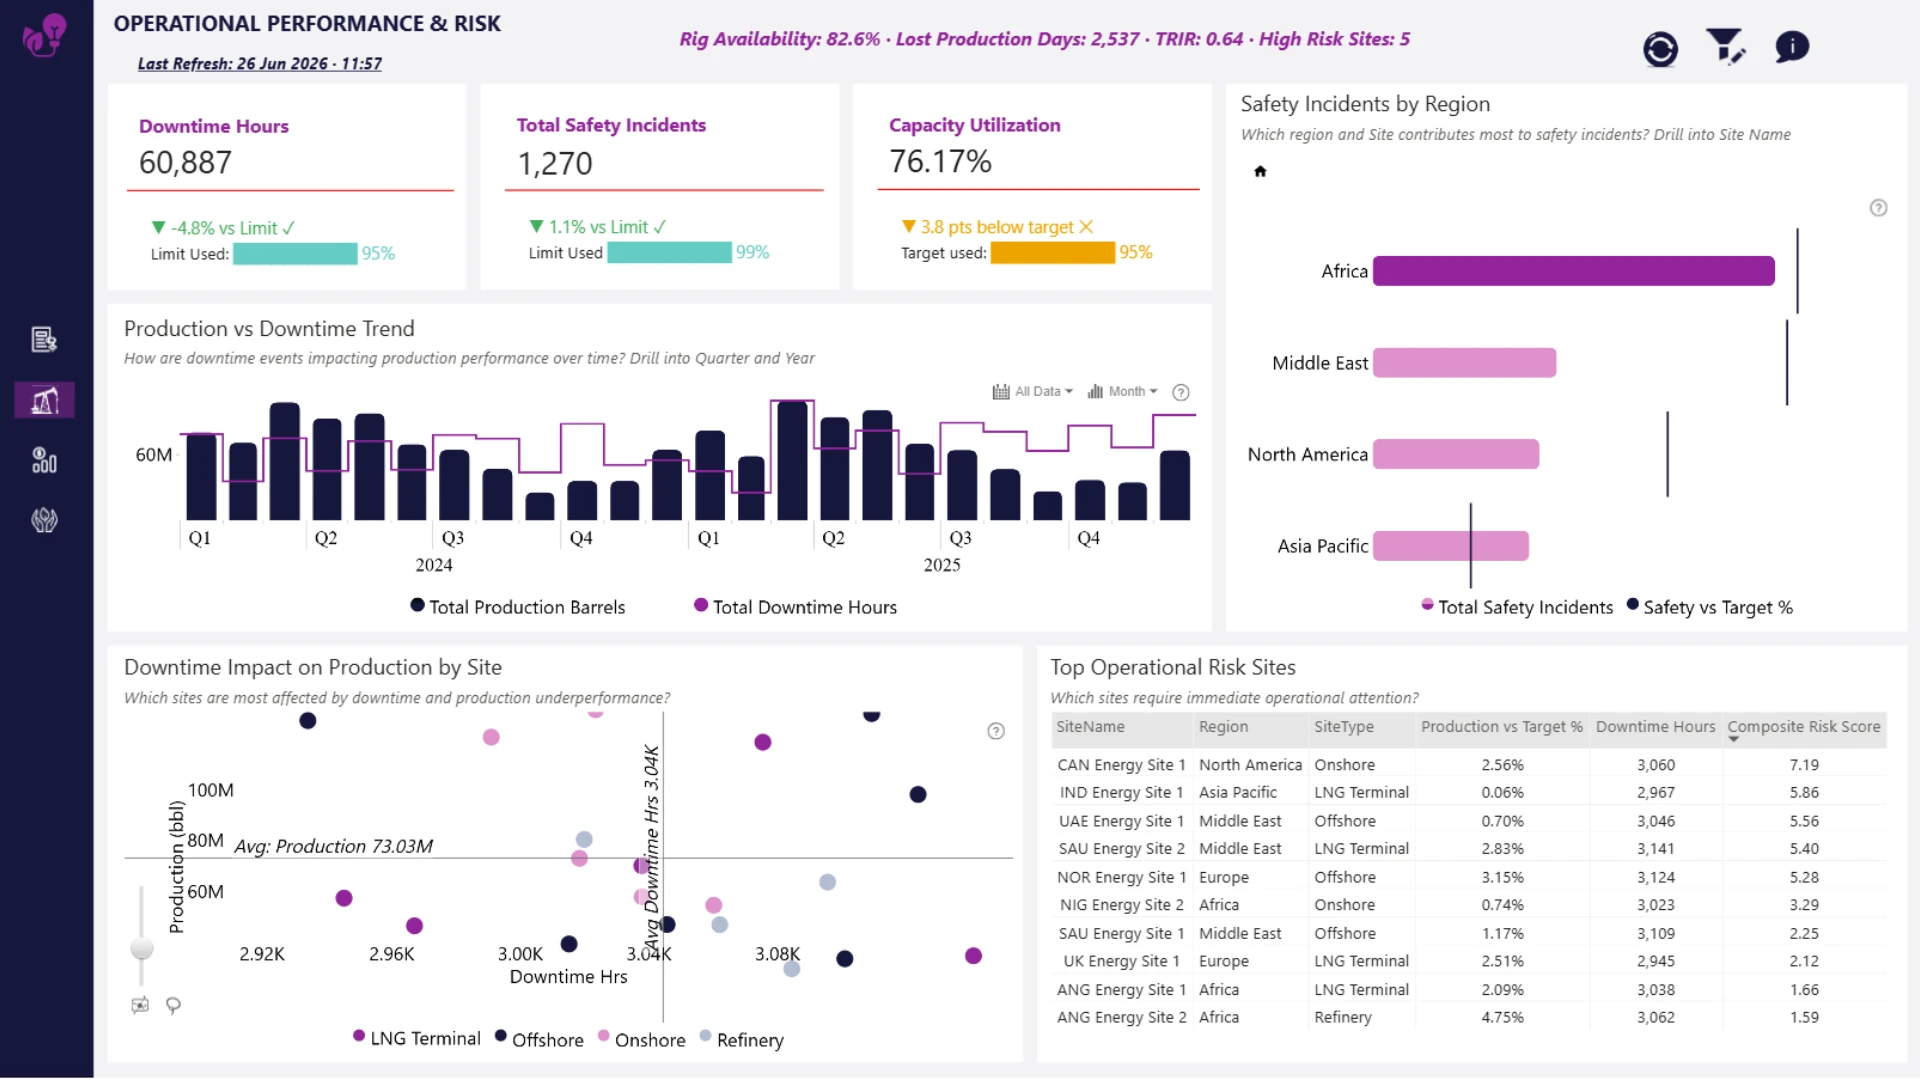
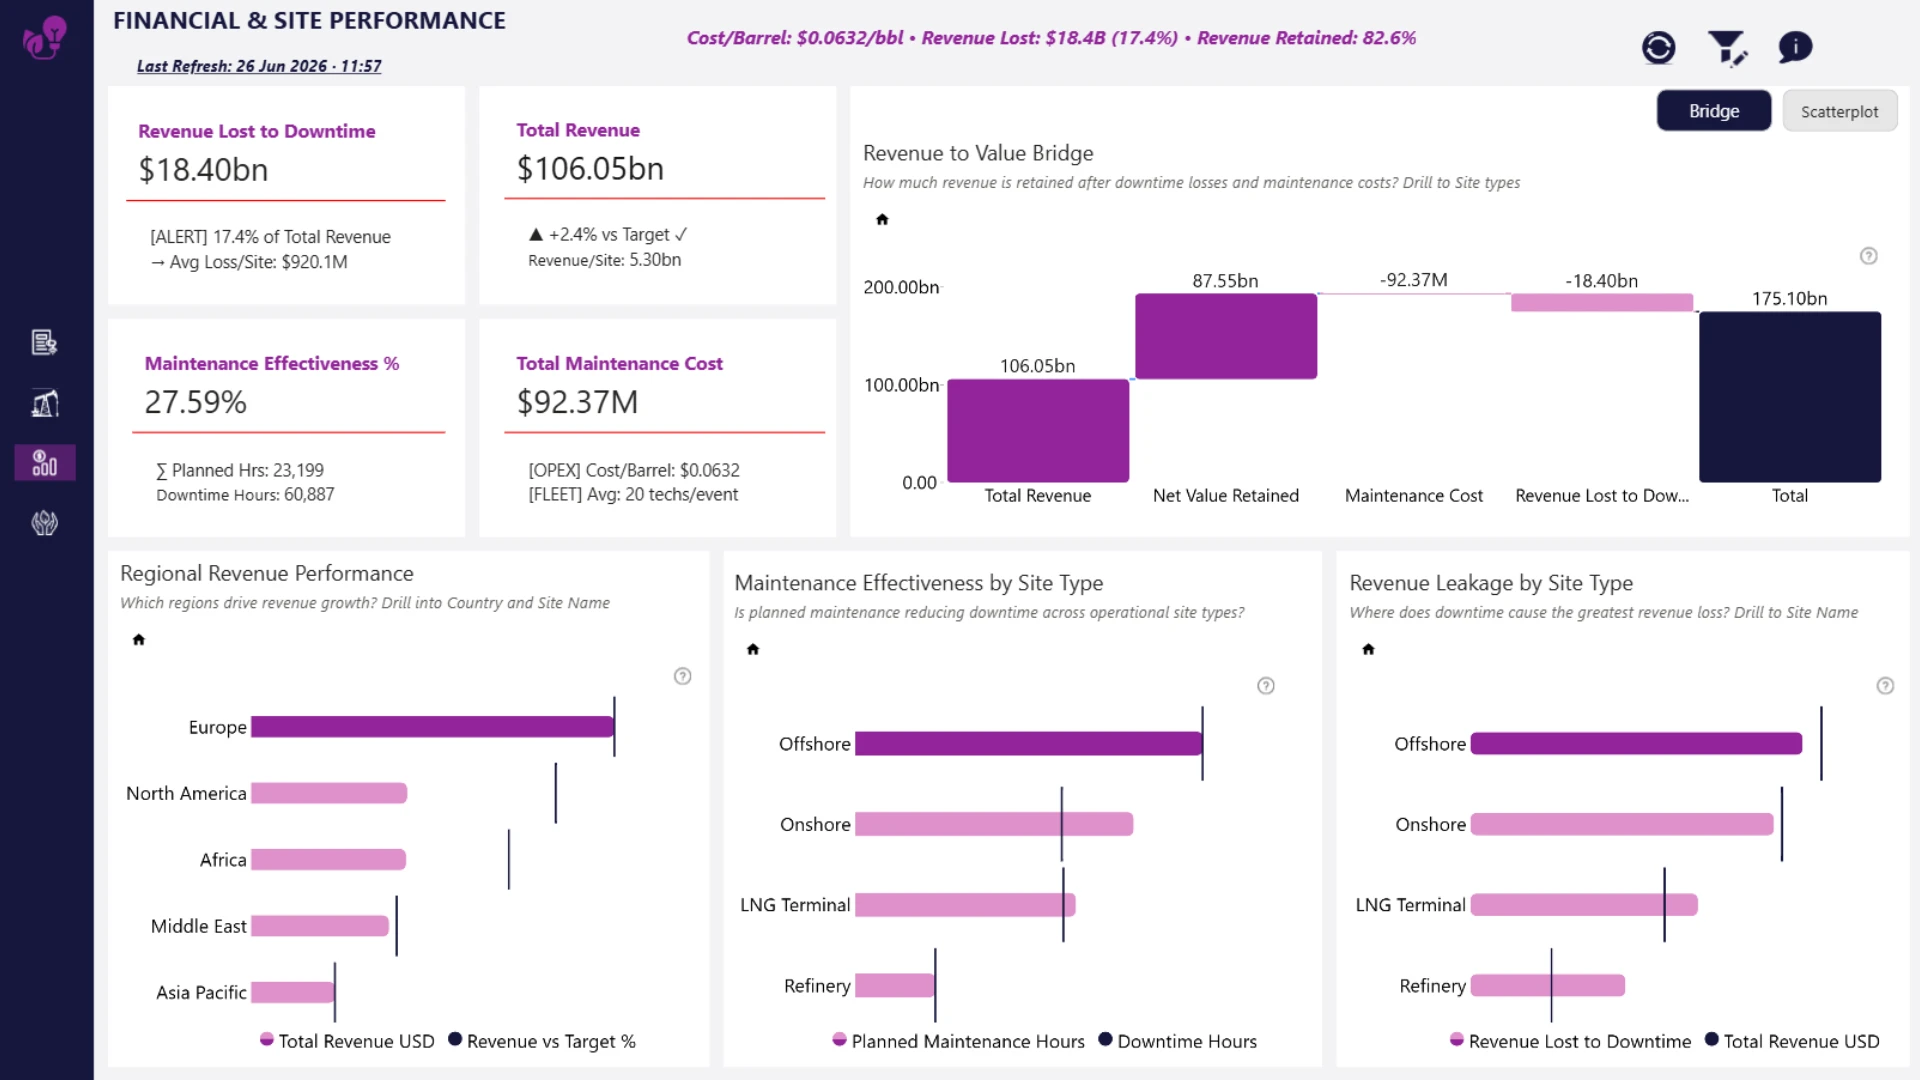
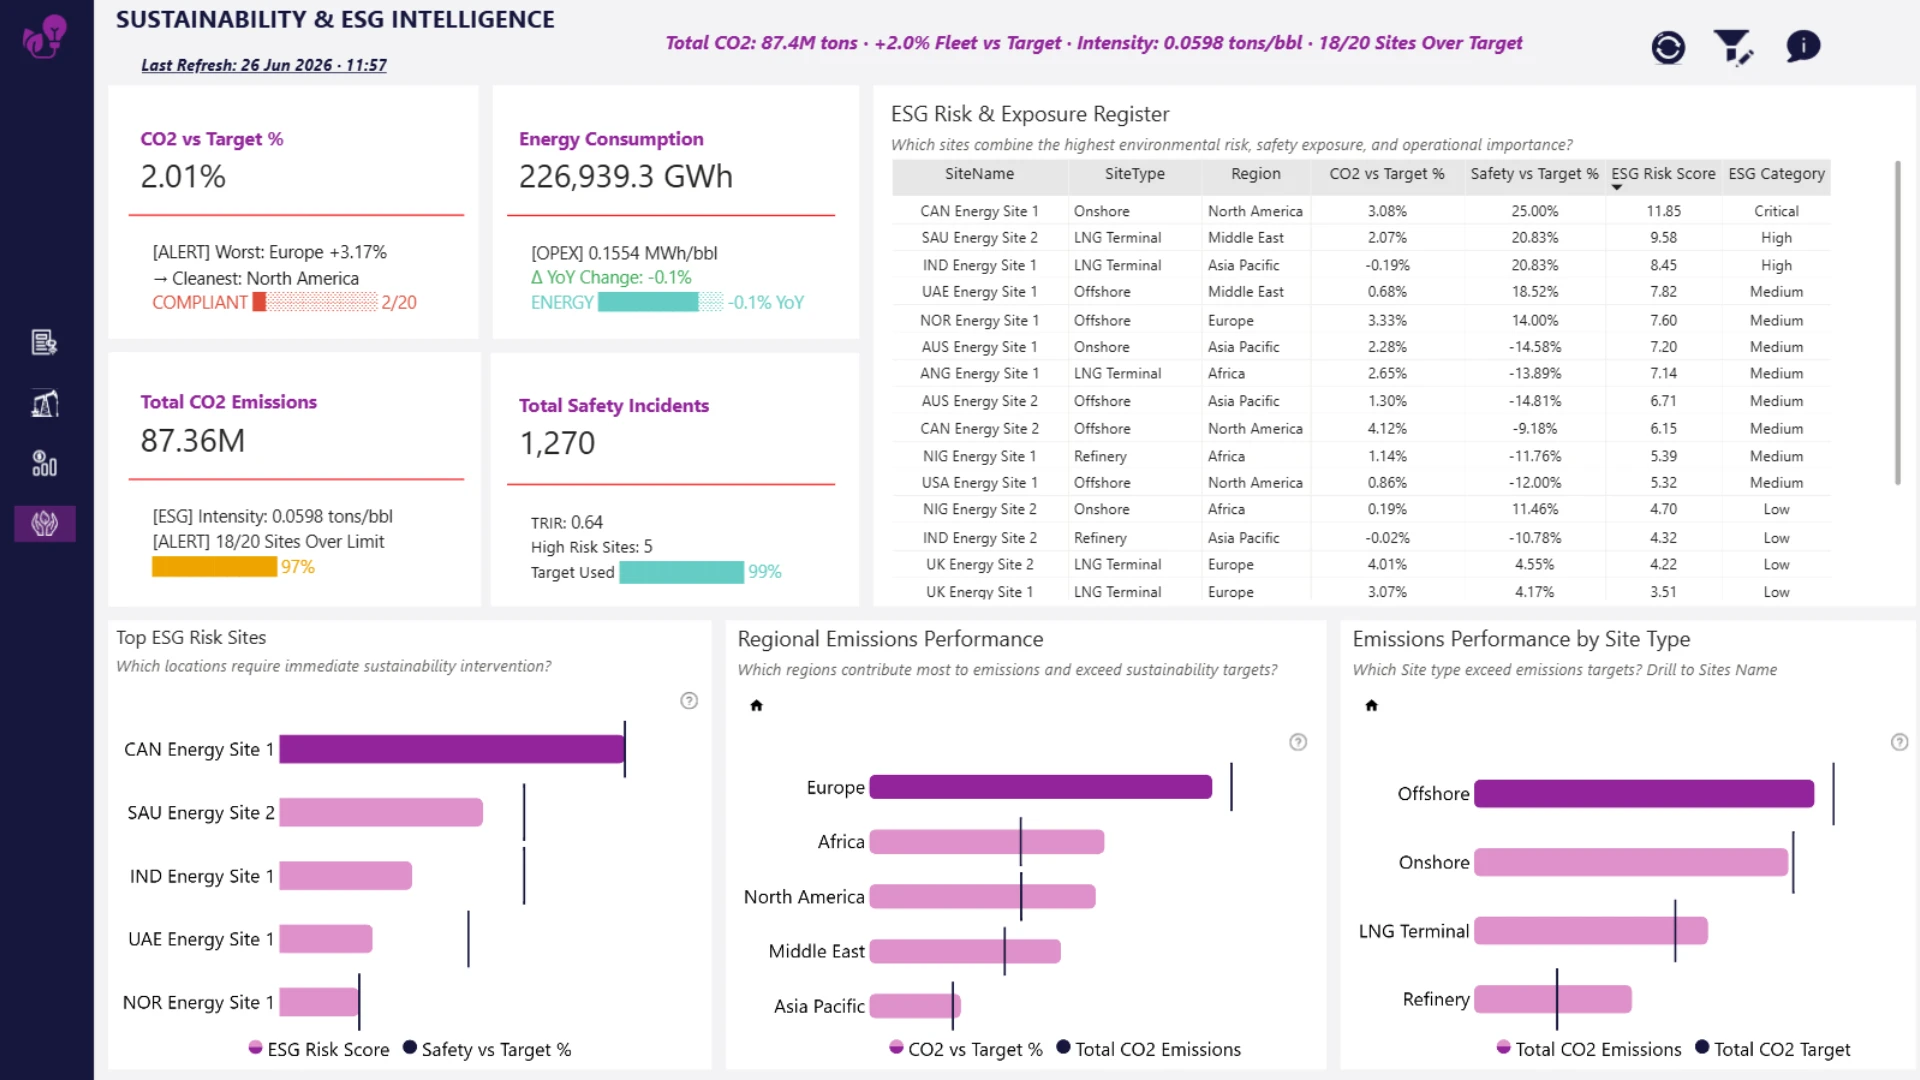
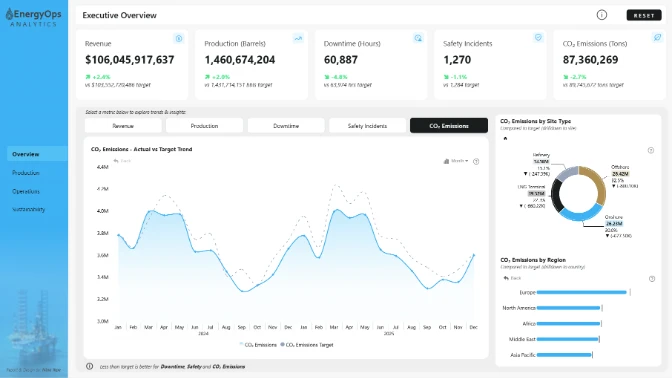
Explore an interactive Power BI dashboard for production analytics. Built with native Power BI visuals and ZoomCharts Drill Down Visuals, the report helps analyze production, maintenance, downtime, safety, sustainability, operational performance, and financial KPIs to support better business decisions. This report was created for the ZoomCharts 4U Report Challenge June 2026, where Power BI developers showcase their data visualization expertise by solving real-world business use cases using native Power BI visuals together with ZoomCharts Drill Down Visuals.
Author's description: This report provides an integrated executive view of global oil and gas operations across five regions and twenty operational sites. The solution combines operational performance, financial outcomes, risk exposure, and sustainability metrics into a single decision-support platform. Key features include interactive drill-down analysis, regional benchmarking, target-based performance monitoring, risk scoring, financial impact assessment, and ESG exposure tracking. The report is designed to support executive decision-making by transforming operational data into actionable business insights while maintaining a clear narrative from performance, to risk, to financial impact, and finally sustainability outcomes. The dashboard enables stakeholders to identify high-performing assets, prioritize operational interventions, reduce revenue leakage, and focus sustainability efforts on the locations with the greatest business and environmental impact.
ZoomCharts visuals used
4U Report Challenges
Participate in data challenges, build and submit reports to get free template downloads.
Join CommunityMobile view allows you to interact with the report. To Download the template please switch to desktop view.
Was this helpful? Thank you for your feedback!
Sorry about that.
How can we improve it?