1325
Power BI Maintenance Analytics Dashboard for Energy Sites
Power BI Maintenance Analytics Dashboard for Energy Sites
More Report pages
Report Author: Nina Ikpe
1325
Share template with others
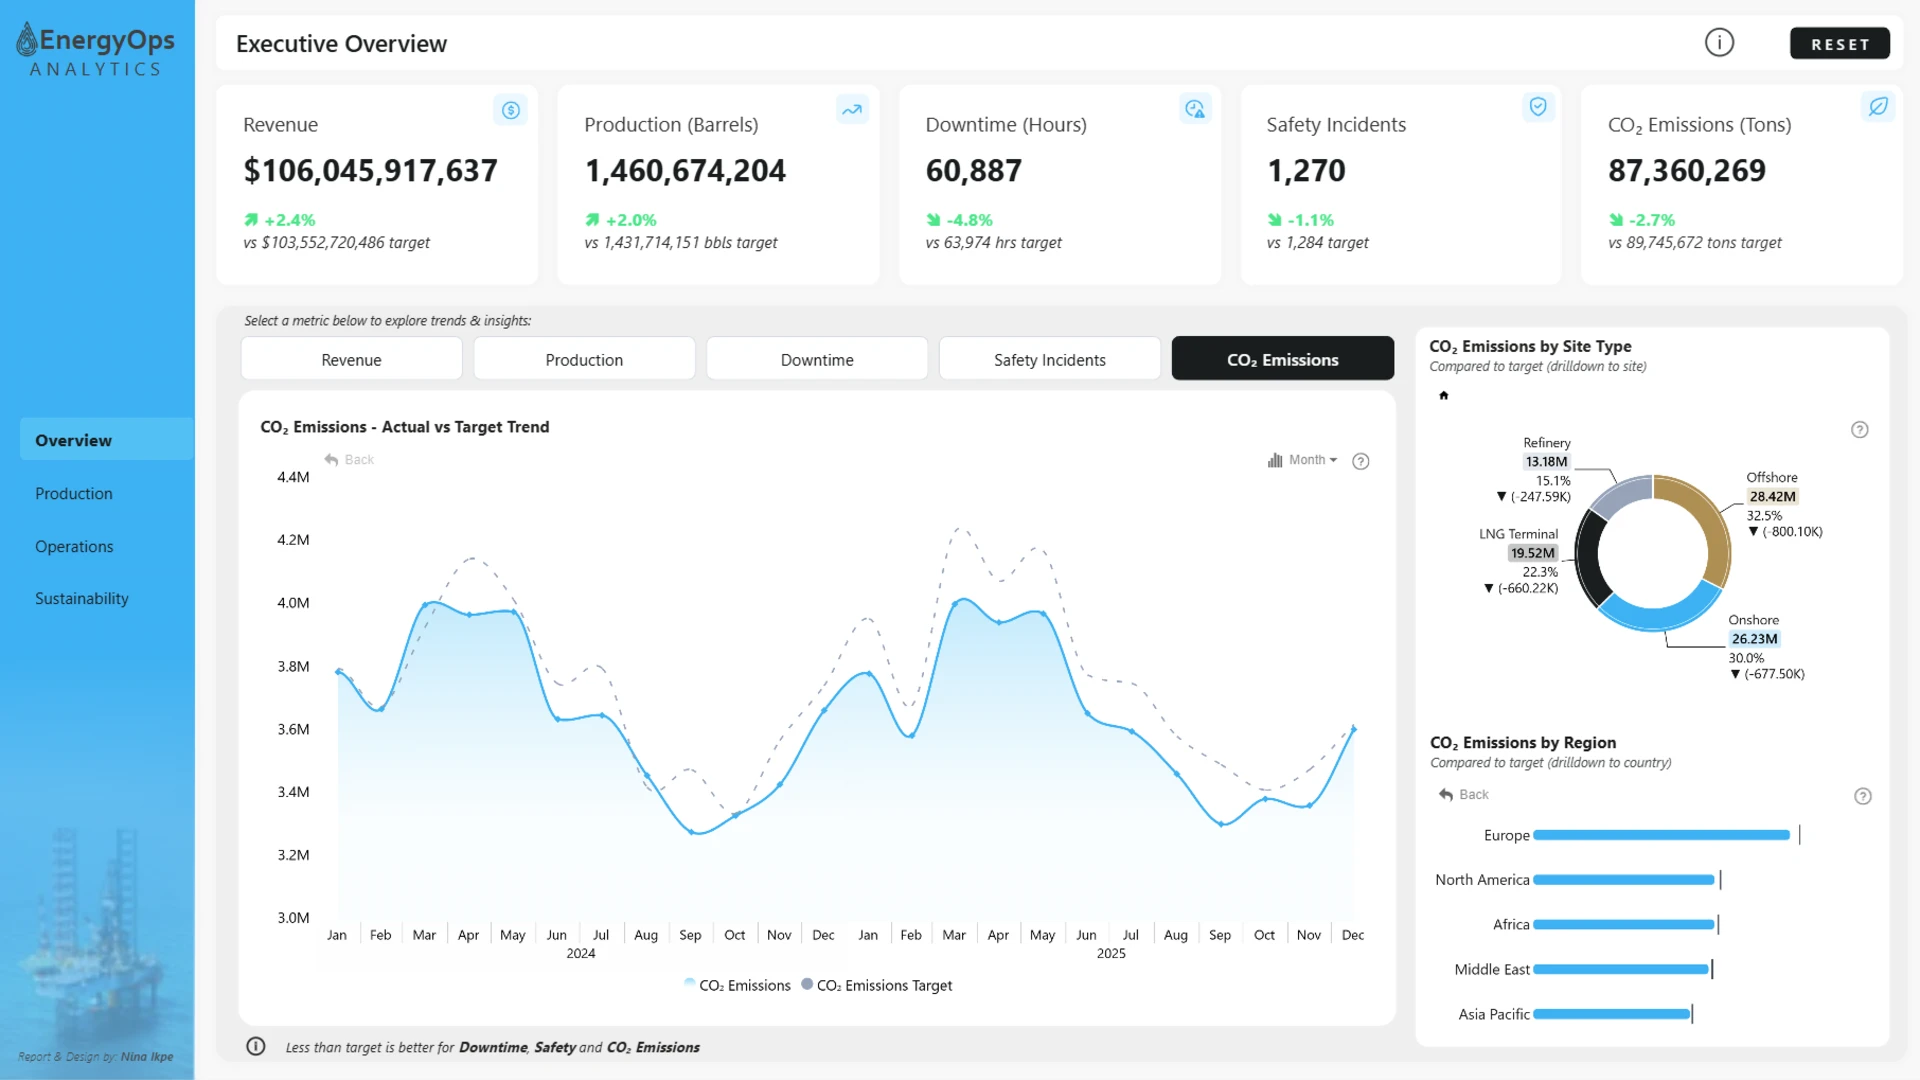
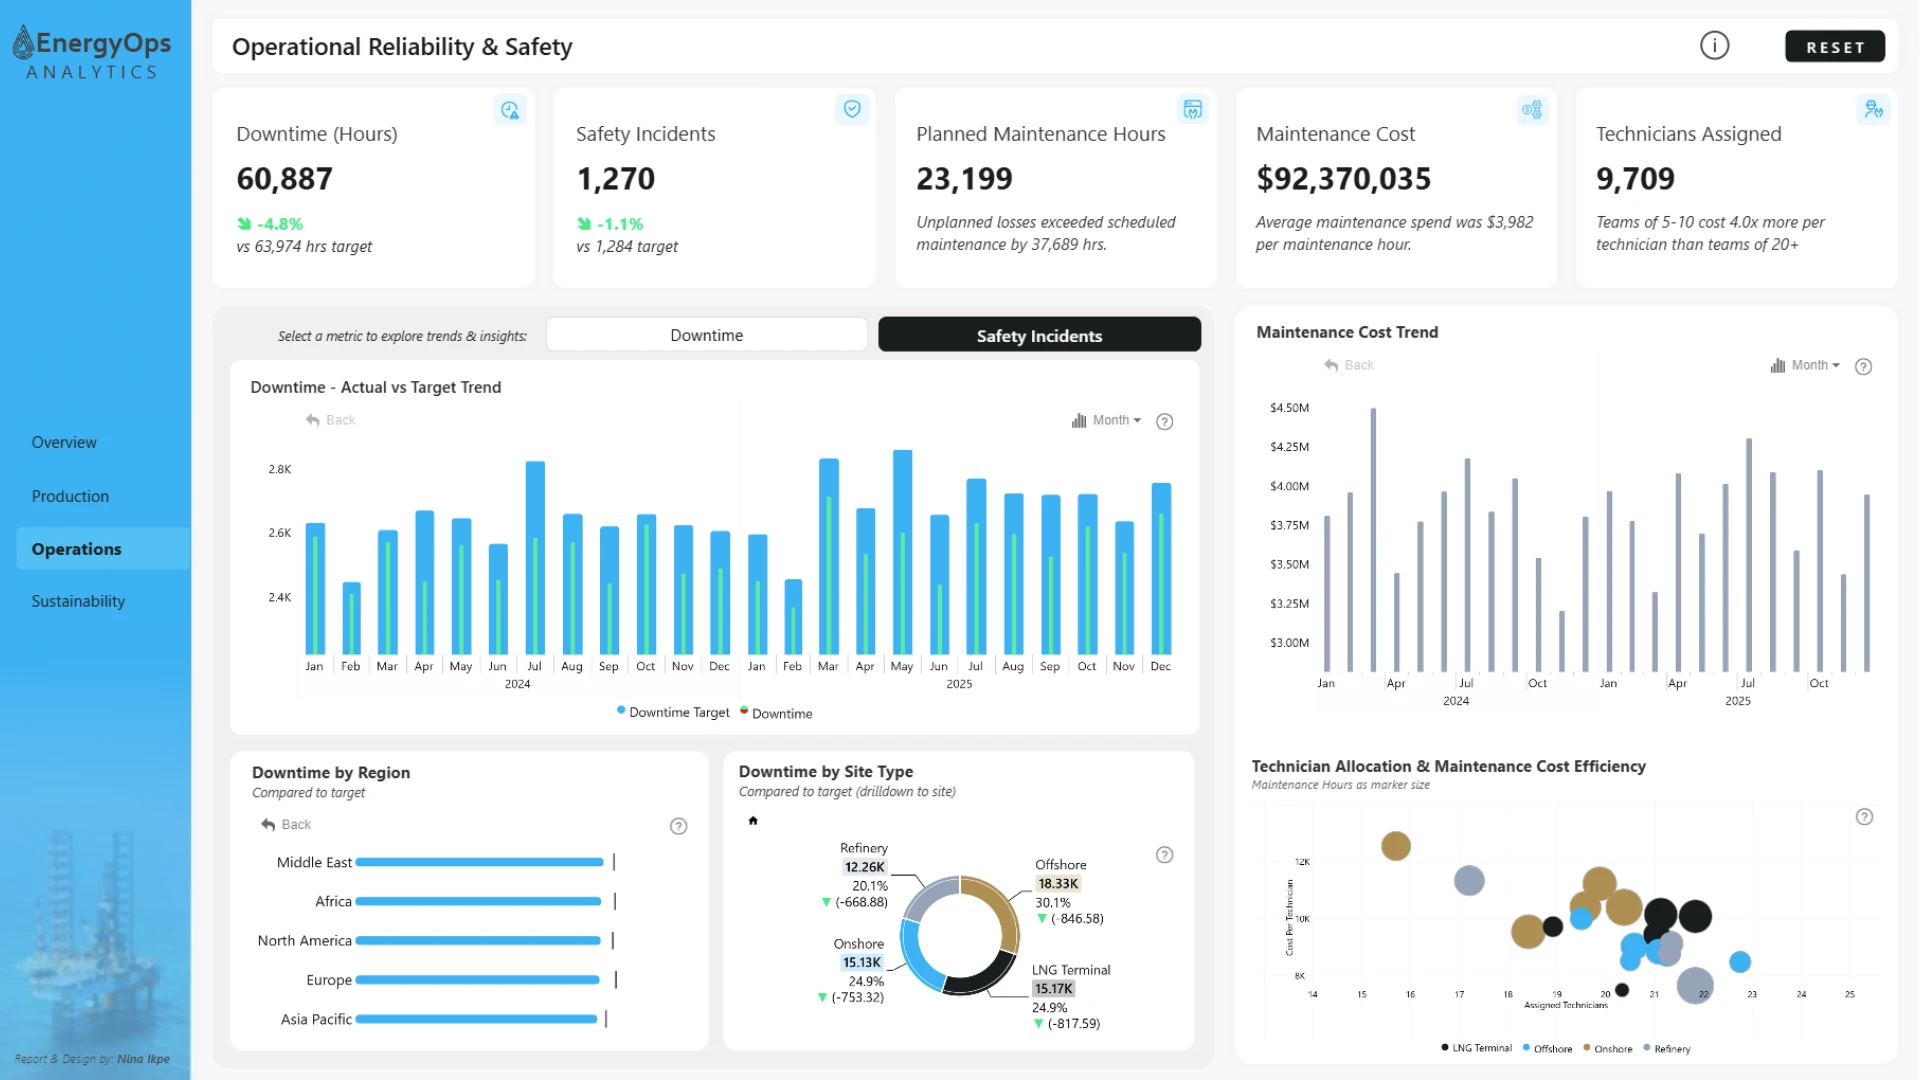
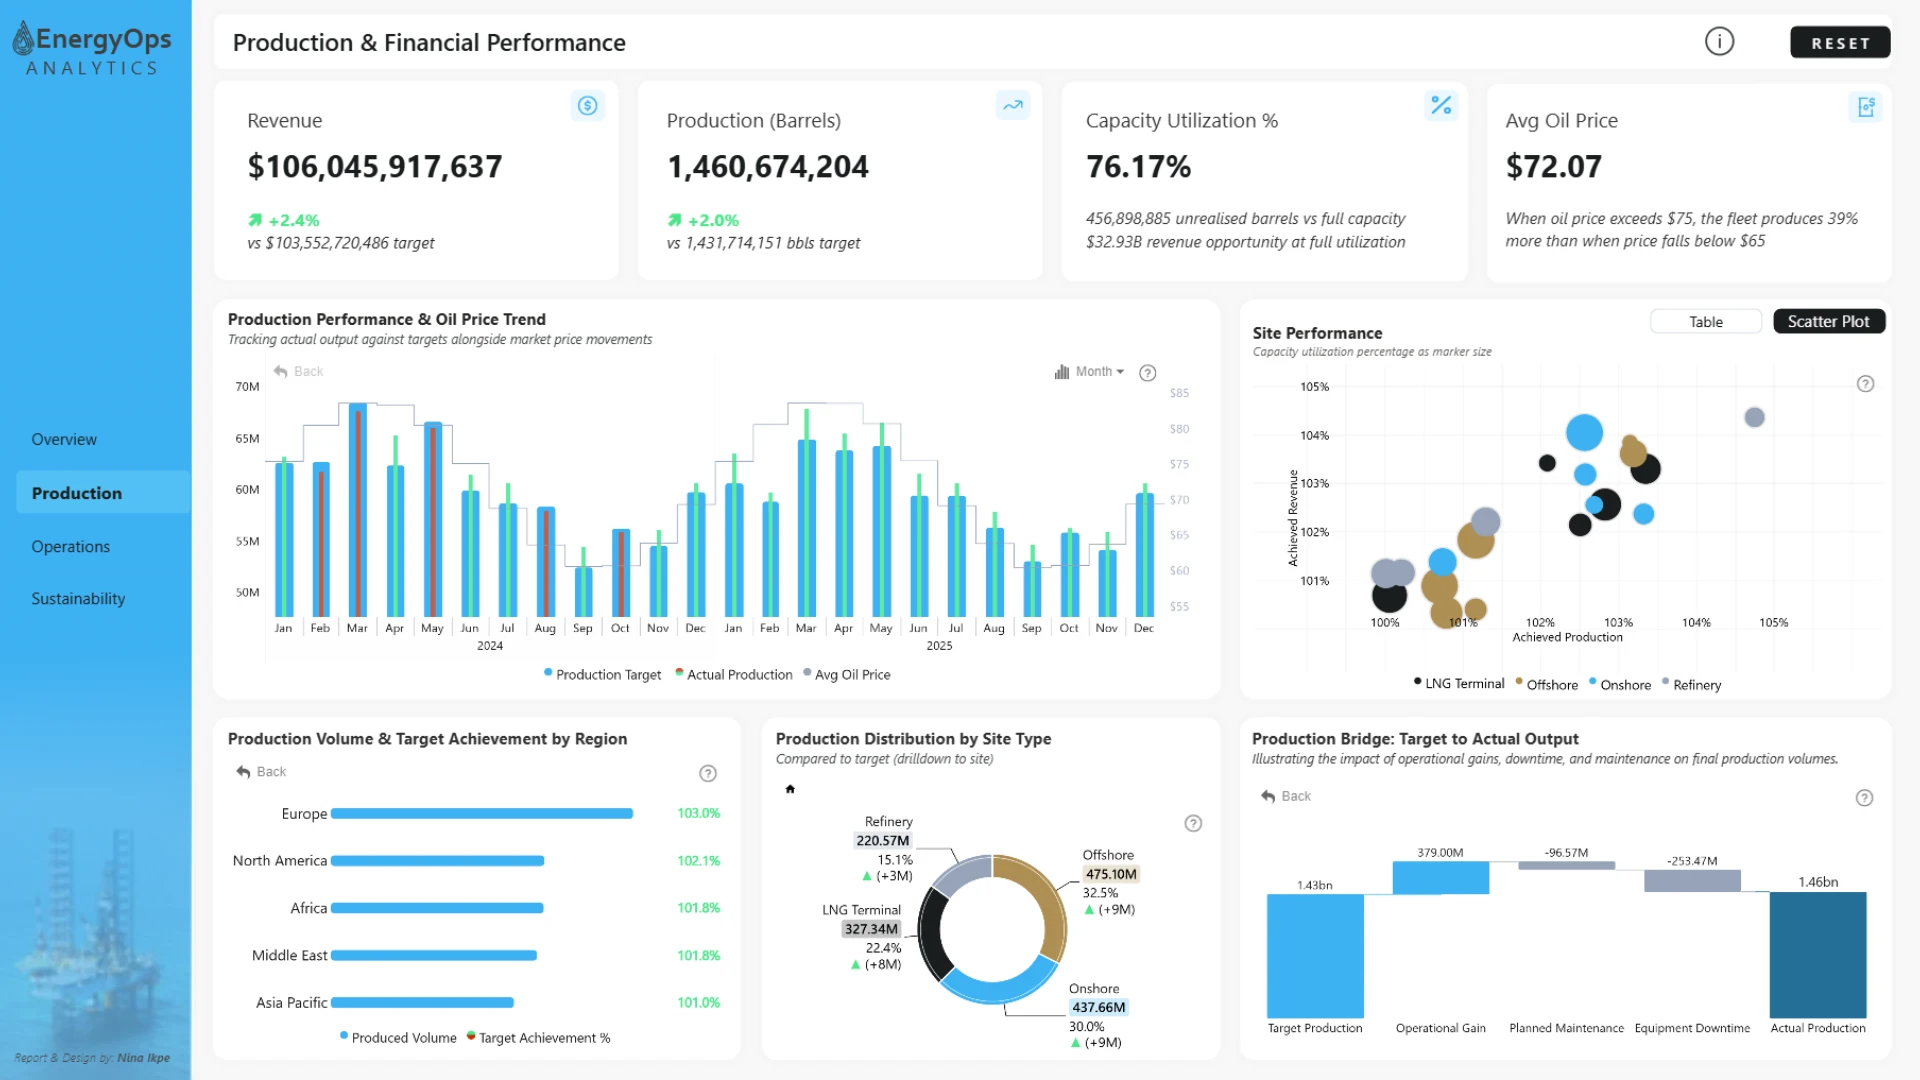
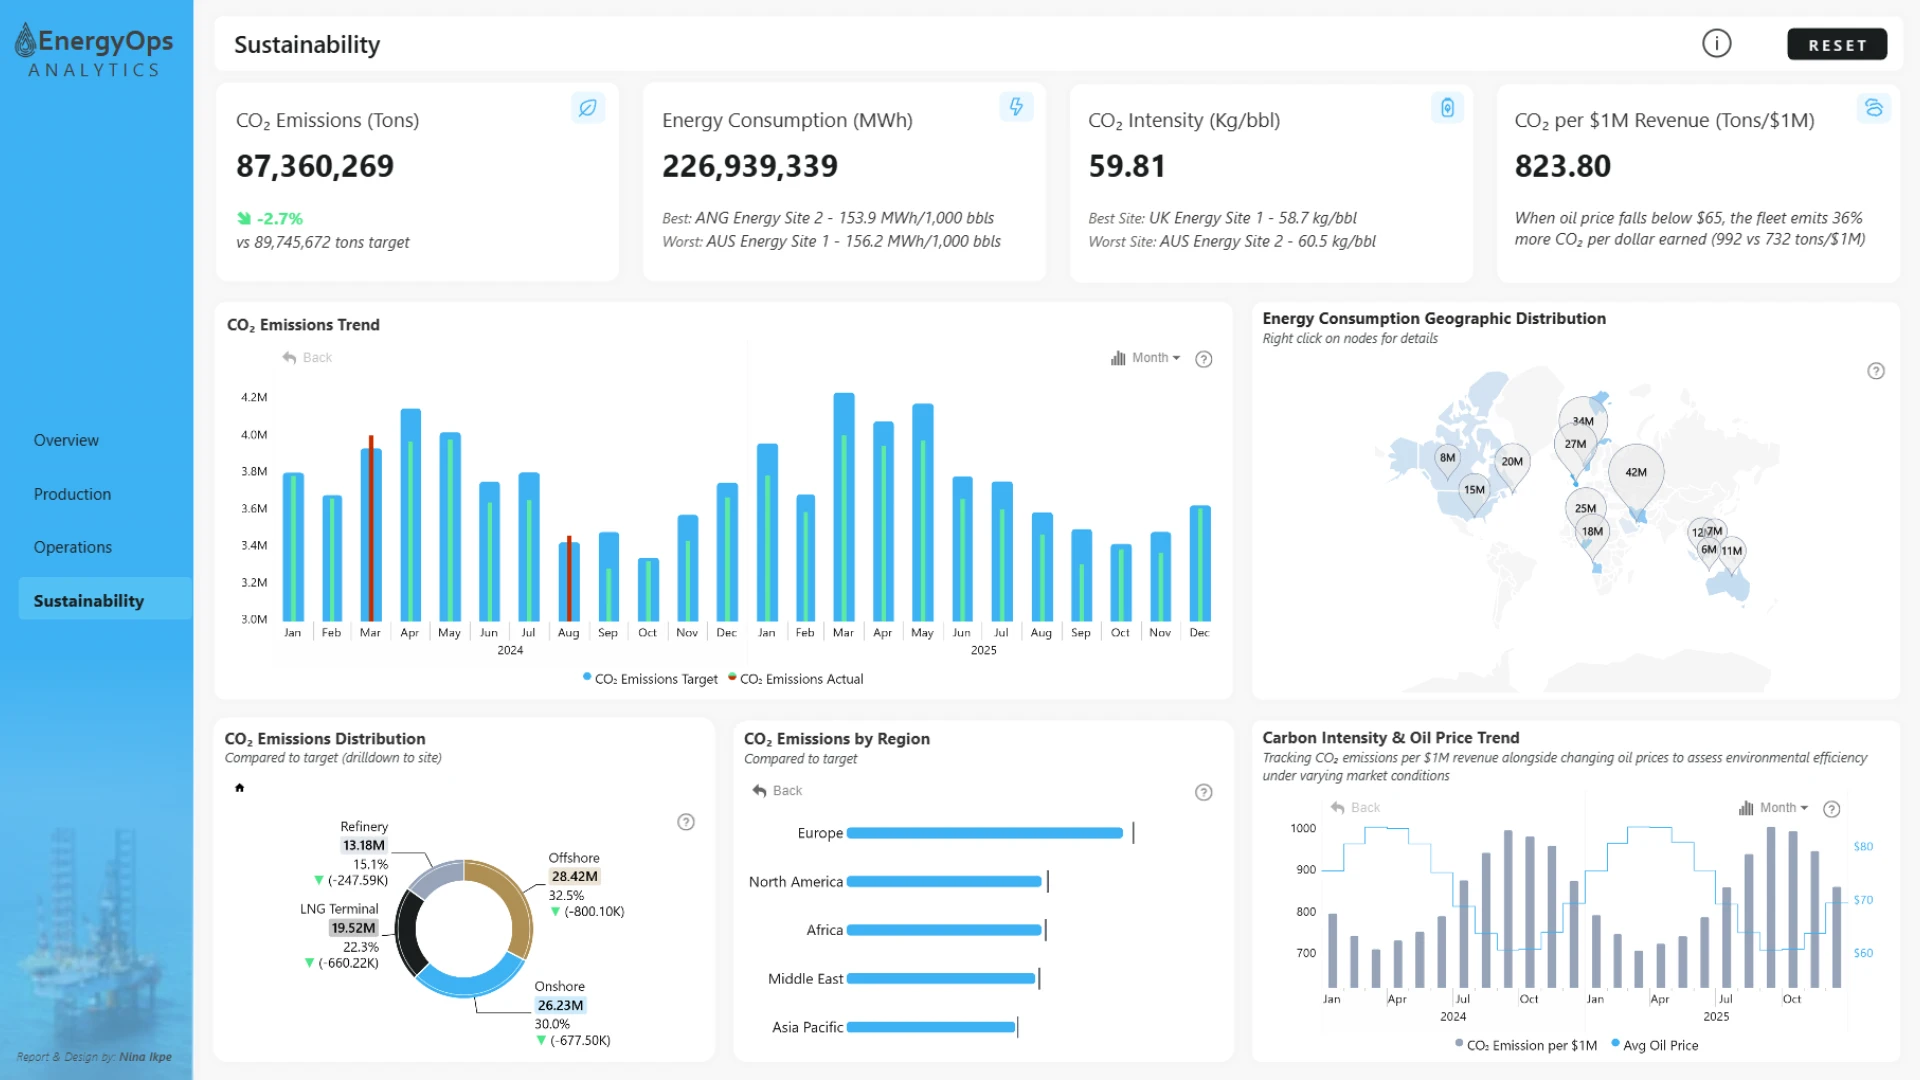
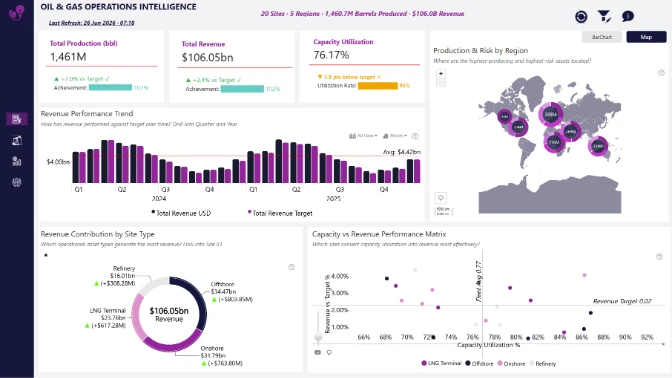
Explore an interactive Power BI dashboard for maintenance analytics. Built with native Power BI visuals and ZoomCharts Drill Down Visuals, the report helps analyze production, maintenance, downtime, safety, sustainability, operational performance, and financial KPIs to support better business decisions. This report was created for the ZoomCharts 4U Report Challenge June 2026, where Power BI developers showcase their data visualization expertise by solving real-world business use cases using native Power BI visuals together with ZoomCharts Drill Down Visuals.
Author's description: Having spent some time in the Oil and Gas Industry, this project was particularly exciting for me. It provided an opportunity to combine my passion for data storytelling with a domain I’m familiar with and appreciate. Building this report felt less like analyzing numbers and more like uncovering the story behind production performance, asset reliability, operational risks, and sustainability. Designed for operations managers, plant leaders, and executives, the report delivers a holistic view of Oil, Gas and Energy operations across production, financial performance, maintenance, safety, and environmental efficiency. The objective was not just to monitor KPIs, but to understand what drives performance, where inefficiencies exist, and where opportunities for improvement lie. The report is structured into four interconnected pages, taking users from a high-level executive overview into deeper analysis of production and financial performance, Operational reliability and safety, and finally Sustainability. Interactive visuals and contextual insights were intentionally incorporated to guide users from "what happened" to "why it happened." Throughout the design, I focused on creating an experience that is executive friendly, visually engaging, and insight-driven. My goal was to ensure that complex operational data could be explored intuitively and transformed into meaningful decisions that support production excellence, operational resilience, and sustainable growth. This was an enjoyable project to work on, and one that allowed me to bring together industry knowledge, analytical thinking, and dashboard design to tell a compelling operational story.
ZoomCharts visuals used
4U Report Challenges
Participate in data challenges, build and submit reports to get free template downloads.
Join CommunityMobile view allows you to interact with the report. To Download the template please switch to desktop view.
Was this helpful? Thank you for your feedback!
Sorry about that.
How can we improve it?