36
Executive KPI Dashboard Power BI 3
Executive KPI Dashboard Power BI 3
More Report pages
Report Author: Mohamed Elbushra
36
Share template with others
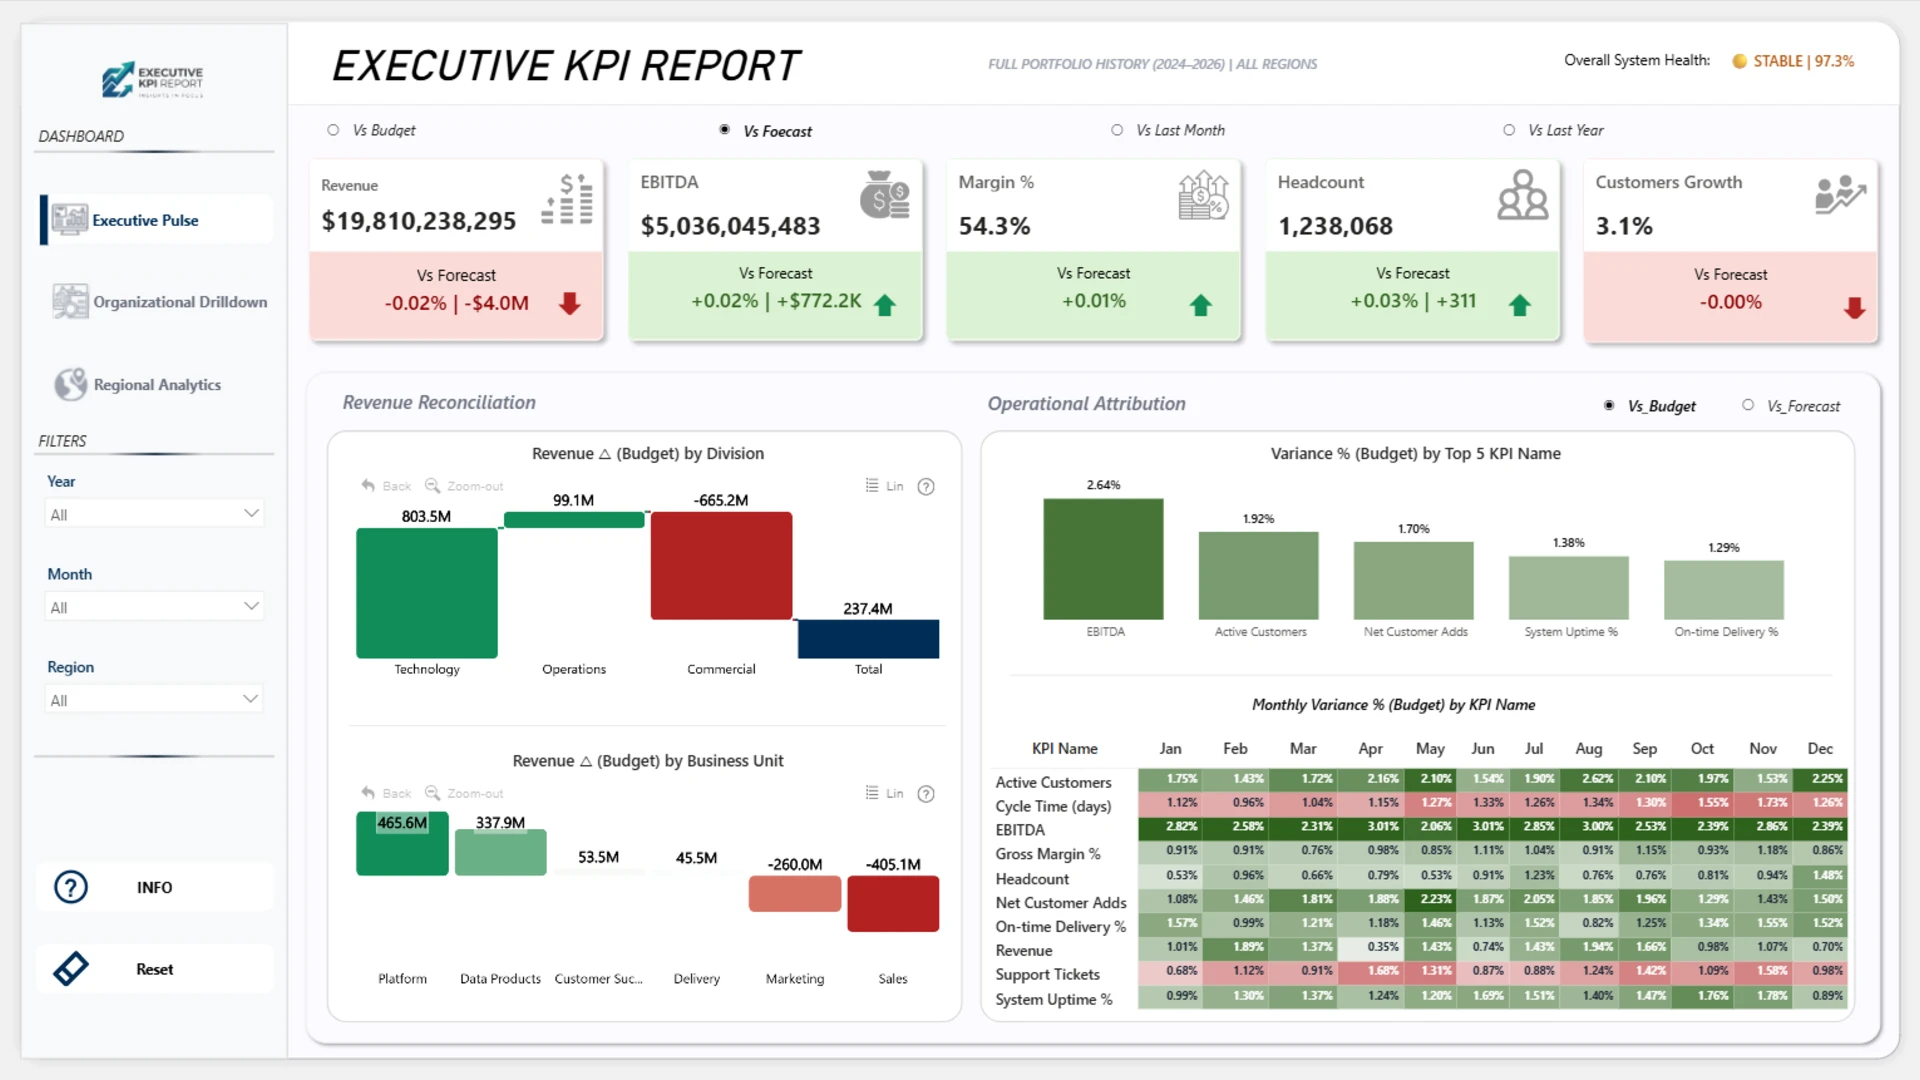
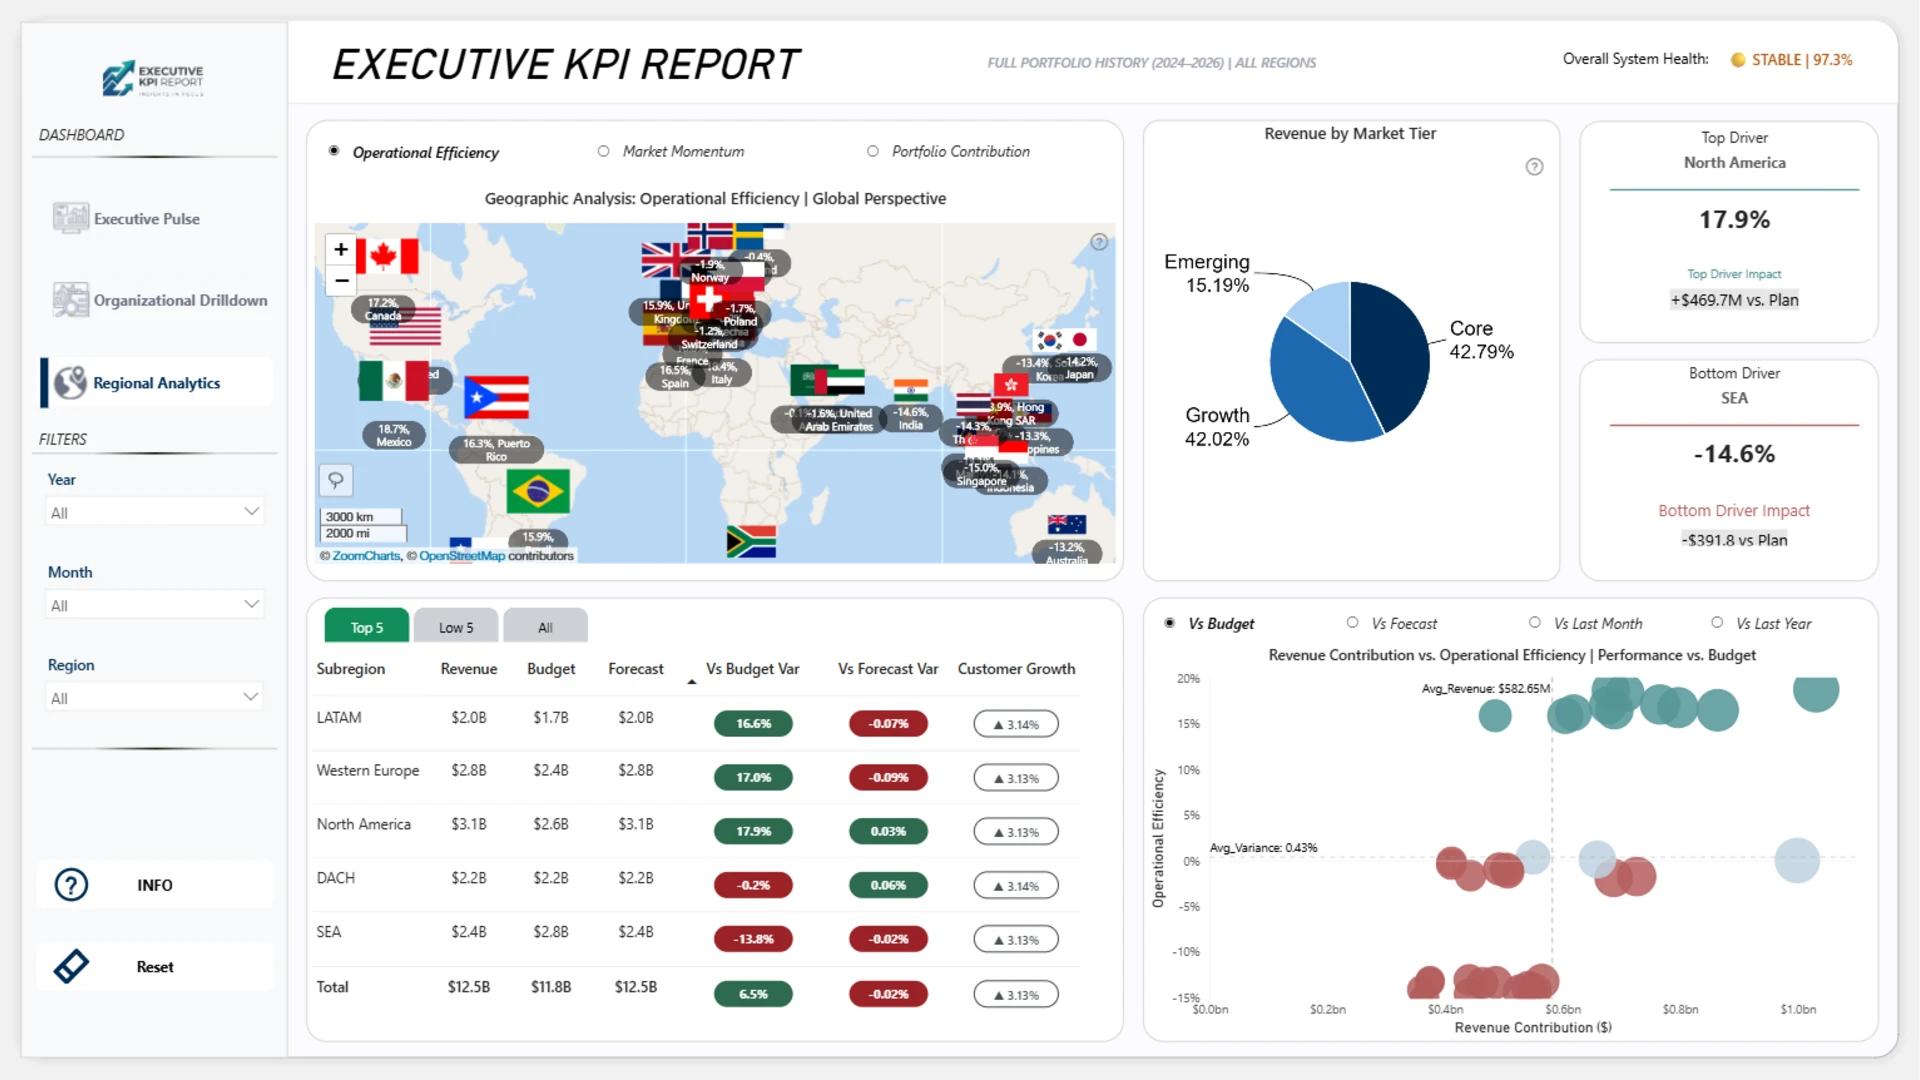
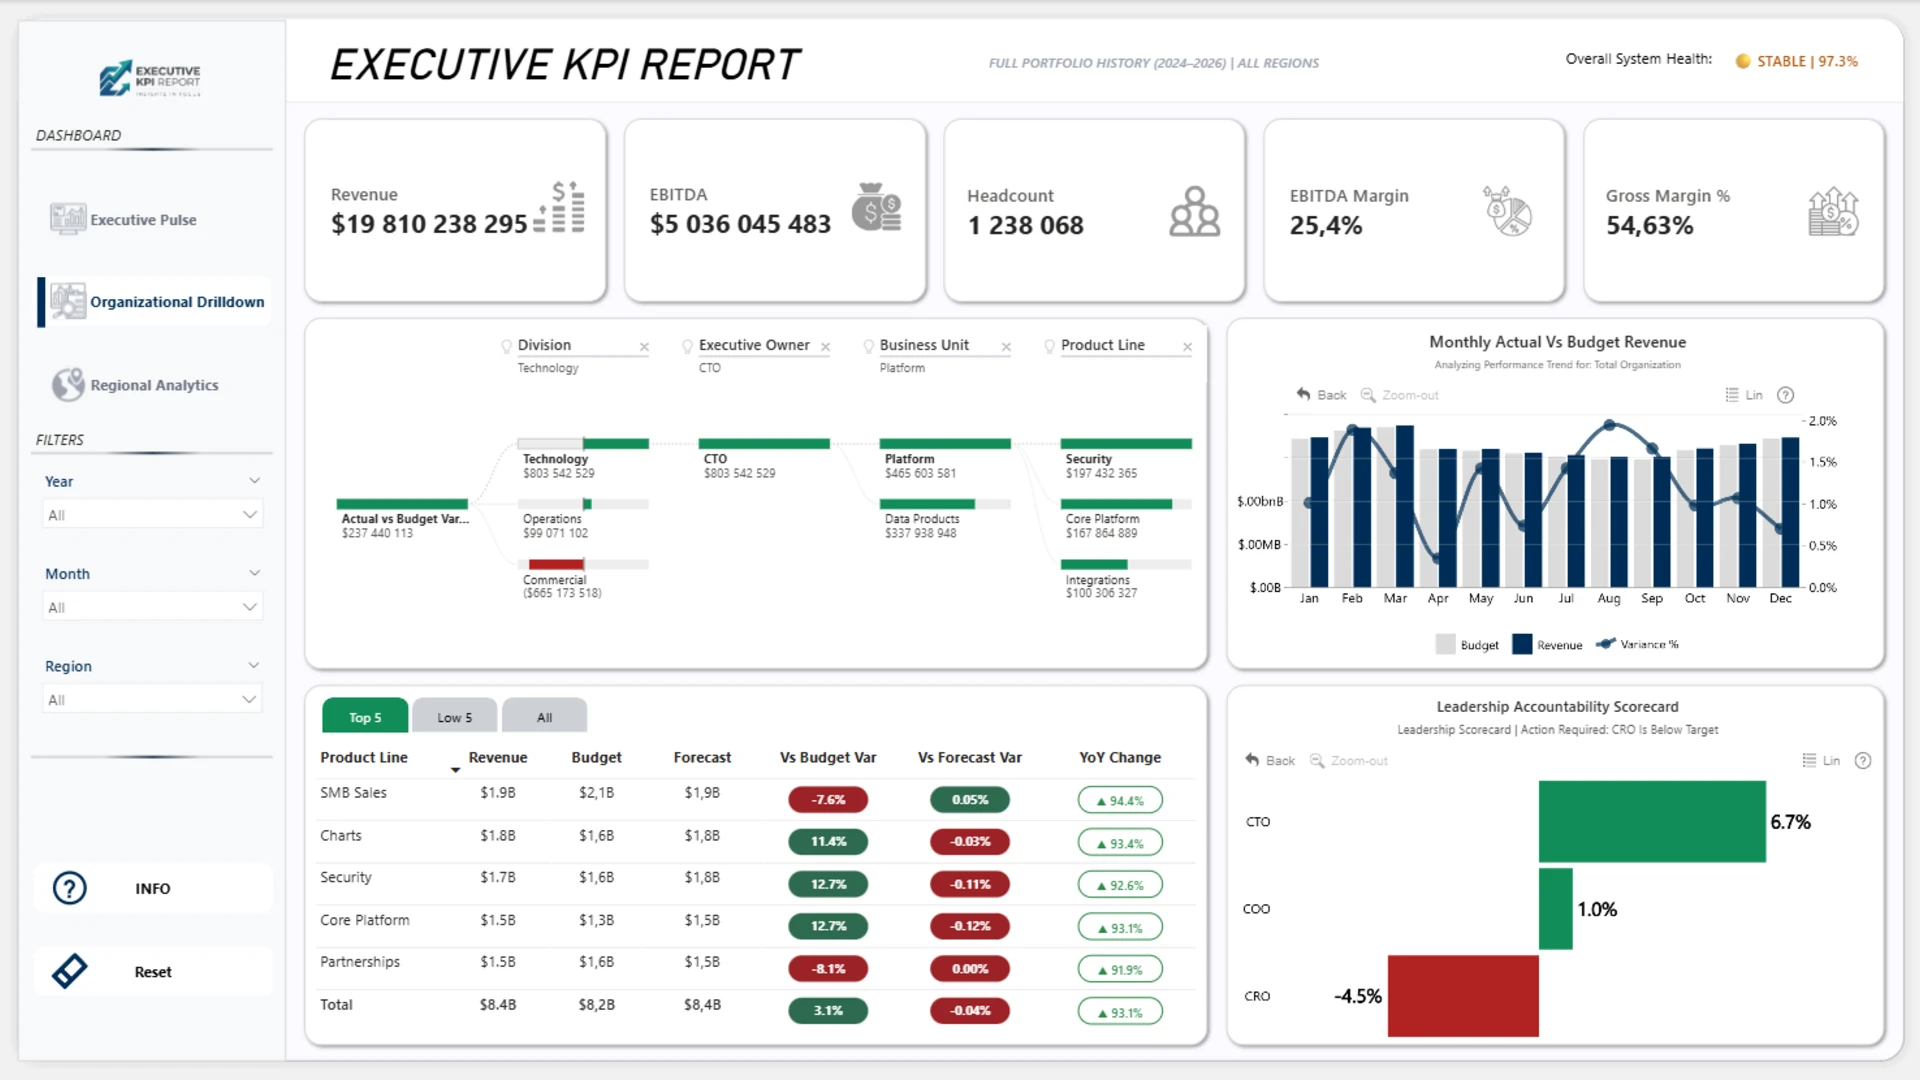
This interactive Power BI report presents an executive KPI dashboard built with ZoomCharts Drill Down custom visuals for Power BI. It highlights key metrics such as Revenue, EBITDA, Margin, Headcount, and Customer Growth, with Actual vs Budget vs Forecast comparisons, organizational drill-down, and regional performance analysis to support strategic decision-making.
The report was submitted to the ZoomCharts “4U Reports Challenge” (April 2026), using ZoomCharts Drill Down custom visuals for Power BI.
Author's Description:
This dashboard was designed to solve the "data-noise" problem for C-Suite executives. Instead of static reporting, it provides a Dynamic Decision Framework that bridges the gap between high-level financial health and granular operational accountability. The solution is built on three core pillars: Strategic Pulse, Structural Deep-Dives, and Geographic Efficiency.
ZoomCharts visuals used
4U Report Challenges
Participate in data challenges, build and submit reports to get free template downloads.
Join CommunityMobile view allows you to interact with the report. To Download the template please switch to desktop view.


Was this helpful? Thank you for your feedback!
Sorry about that.
How can we improve it?