856
Enterprise Sales Pipeline Analysis
Enterprise Sales Pipeline Analysis
More Report pages
Report Author: Ugochukwu Nwasuruba
856
Share template with others
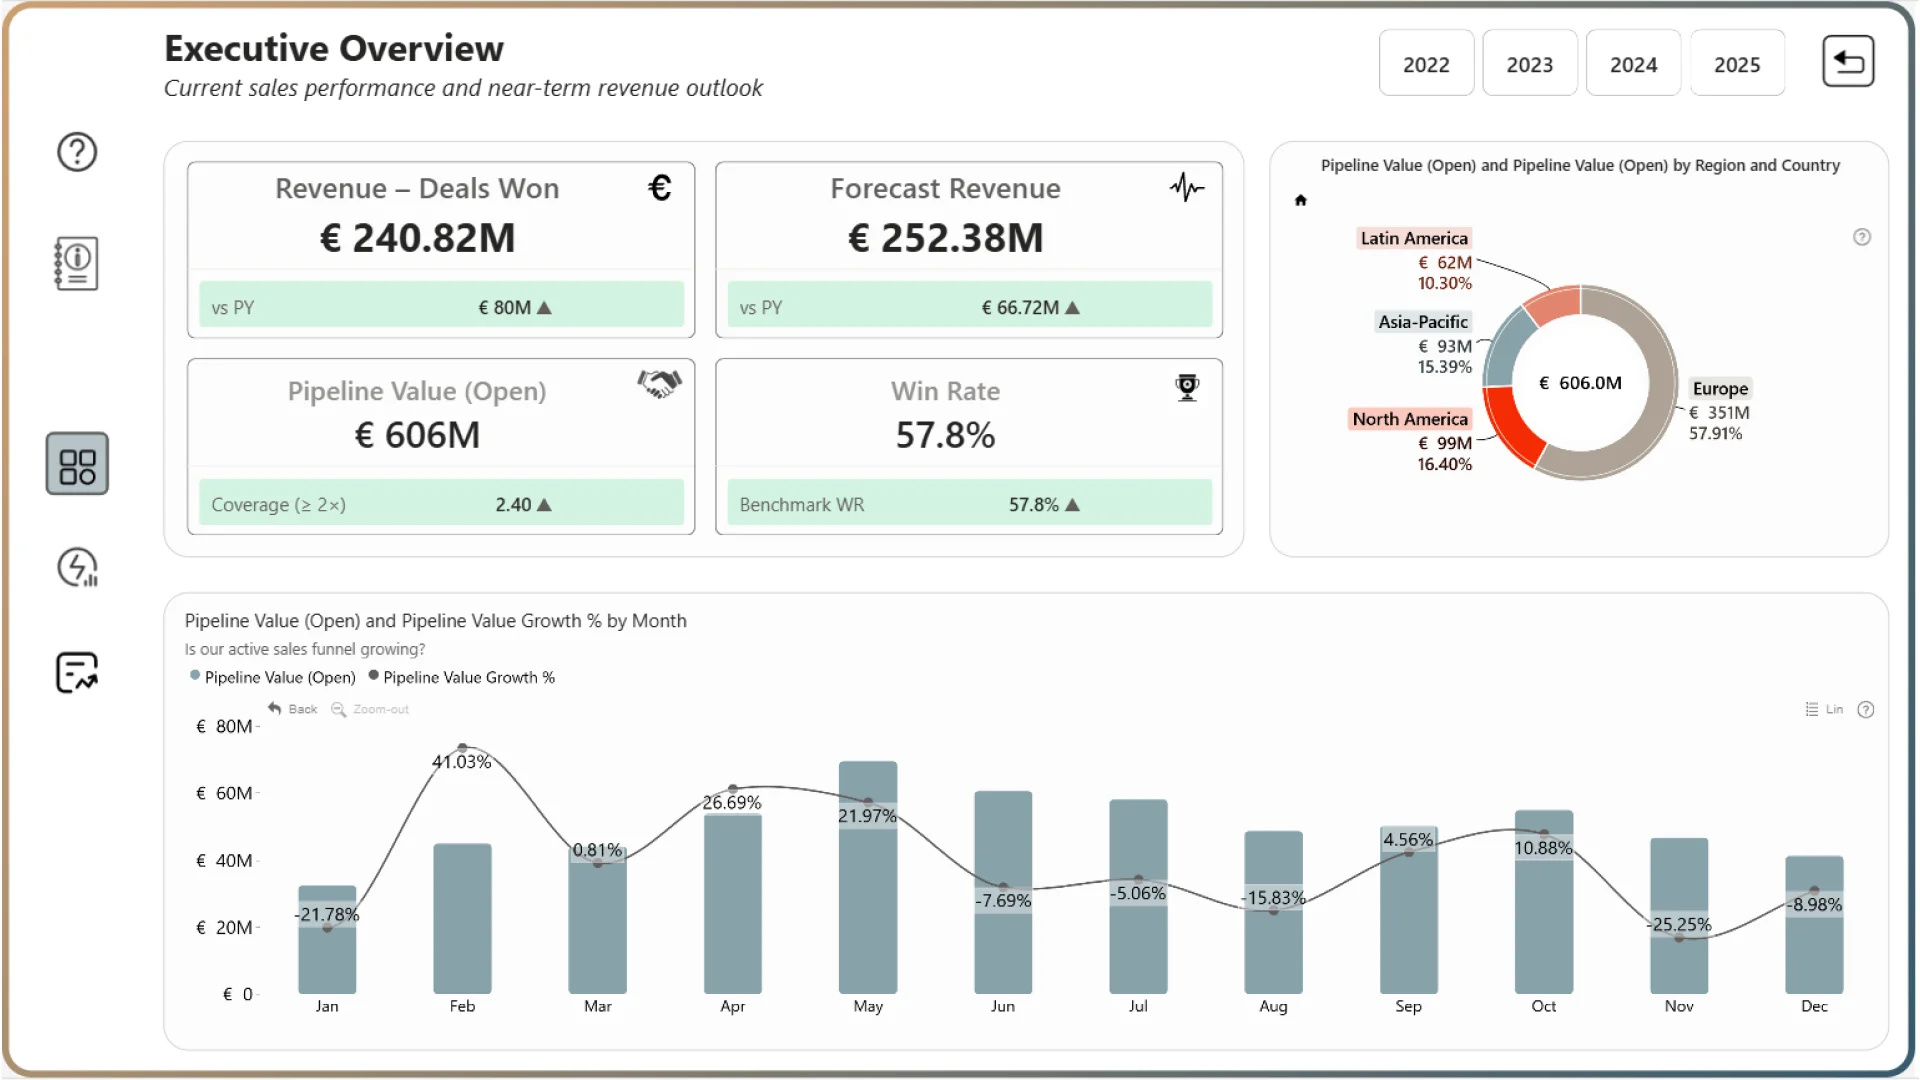
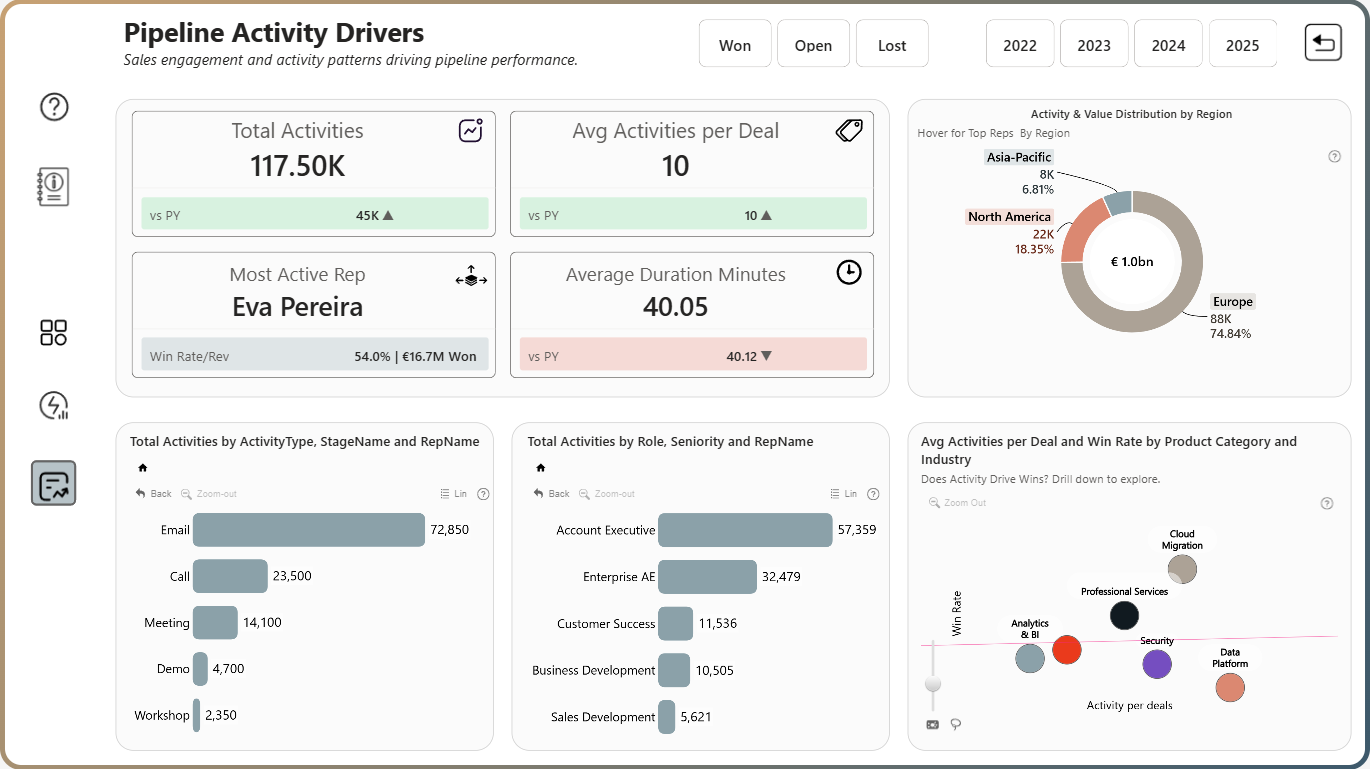
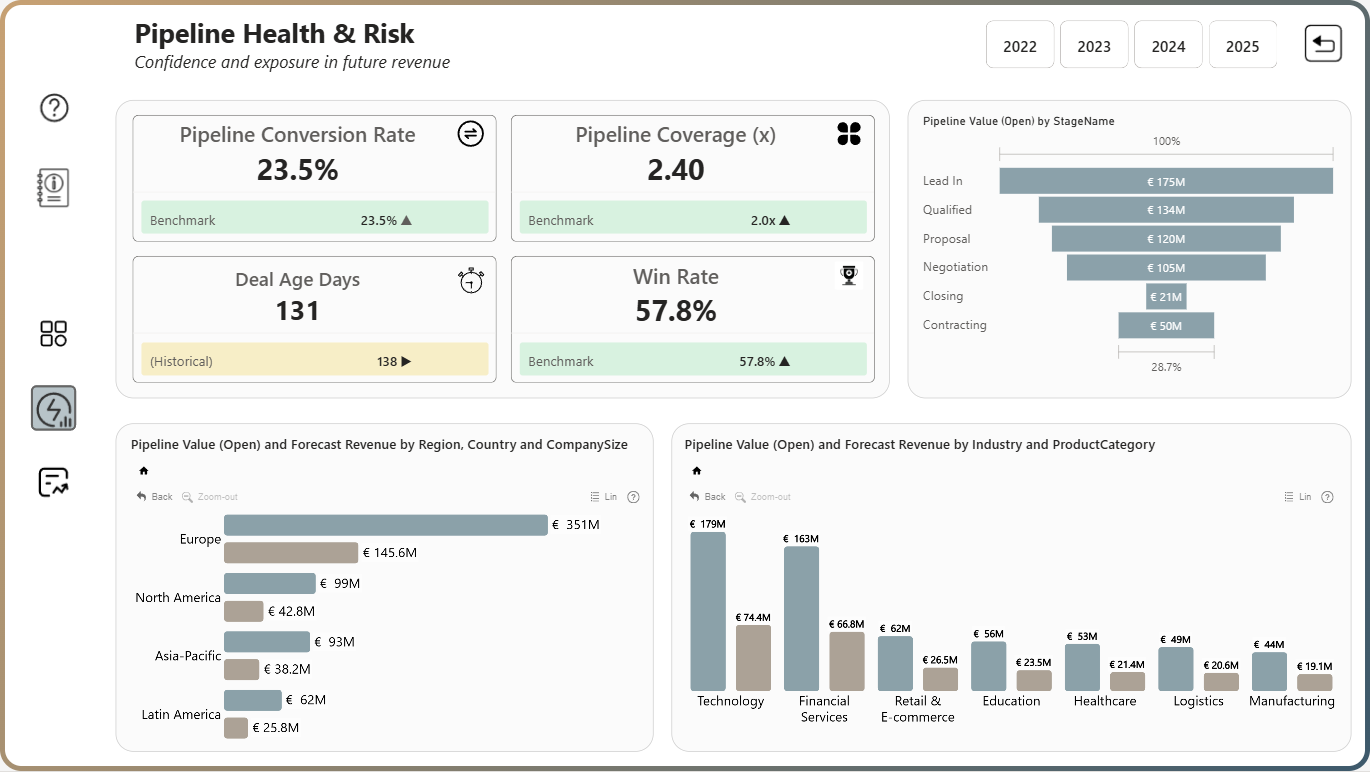
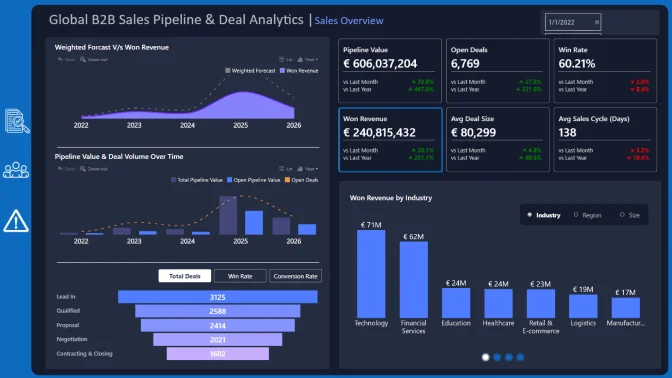
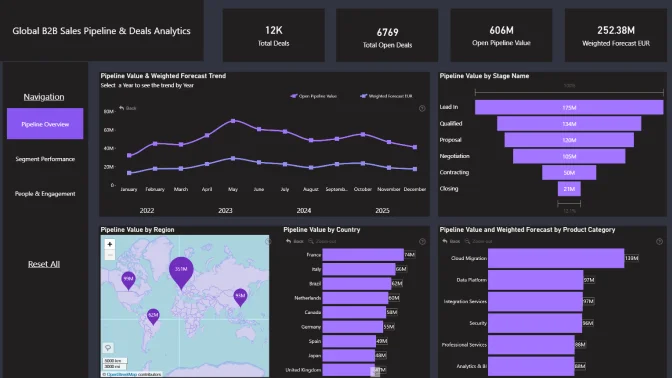
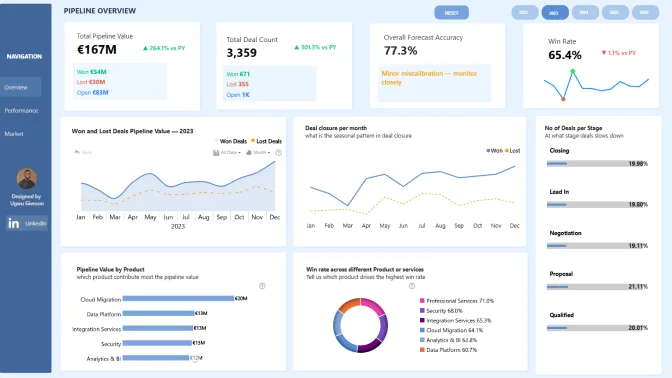
This interactive Power BI report explores the Global B2B Sales Pipeline & Deals Analytics dataset using ZoomCharts Drill Down PRO custom visuals for Power BI. It highlights pipeline value, deal progression, sales activity, and client engagement across regions and industries, helping teams monitor pipeline health and identify stalled or high-risk deals.
The report was submitted to the FP20 Analytics ZoomCharts Data Challenge #35 (February – March 2026).
Author’s Description
An executive Power BI report built with ZoomCharts that delivers end-to-end visibility across €171.72M in won revenue. The report analyzes pipeline performance, pipeline health, and activity drivers, enabling sales leaders to answer three key questions: What have we won? Is our pipeline healthy? What behaviors are driving results?
With a 55.3% win rate, 2.40× pipeline coverage, and Europe representing 57% of open pipeline value, the report highlights where opportunities are won, where risks exist, and which sales representatives and activities are driving growth. Interactive drilldowns and tooltips allow users to explore insights in greater detail.
ZoomCharts visuals used




4U Report Challenges
Participate in data challenges, build and submit reports to get free template downloads.
Join CommunityMobile view allows you to interact with the report. To Download the template please switch to desktop view.
How to use a PBIX template
Preview the interactive report, download the PBIX file, open it in Power BI Desktop, and replace the same data connection with your own dataset.
Preview and download
Explore the report online and download the PBIX template file.
Open in Power BI Desktop
Open the downloaded PBIX file in Power BI Desktop.
Connect your data
Replace the sample data source with your own dataset.
Refresh and adjust
Refresh the model and update fields or visual were needed.
Save and share
Save your report and publish it for your audience.


