1149
Sales Pipeline Dashboard 7
Sales Pipeline Dashboard 7
More Report pages
Report Author: AashriyaRawat Rawat
1149
Share template with others
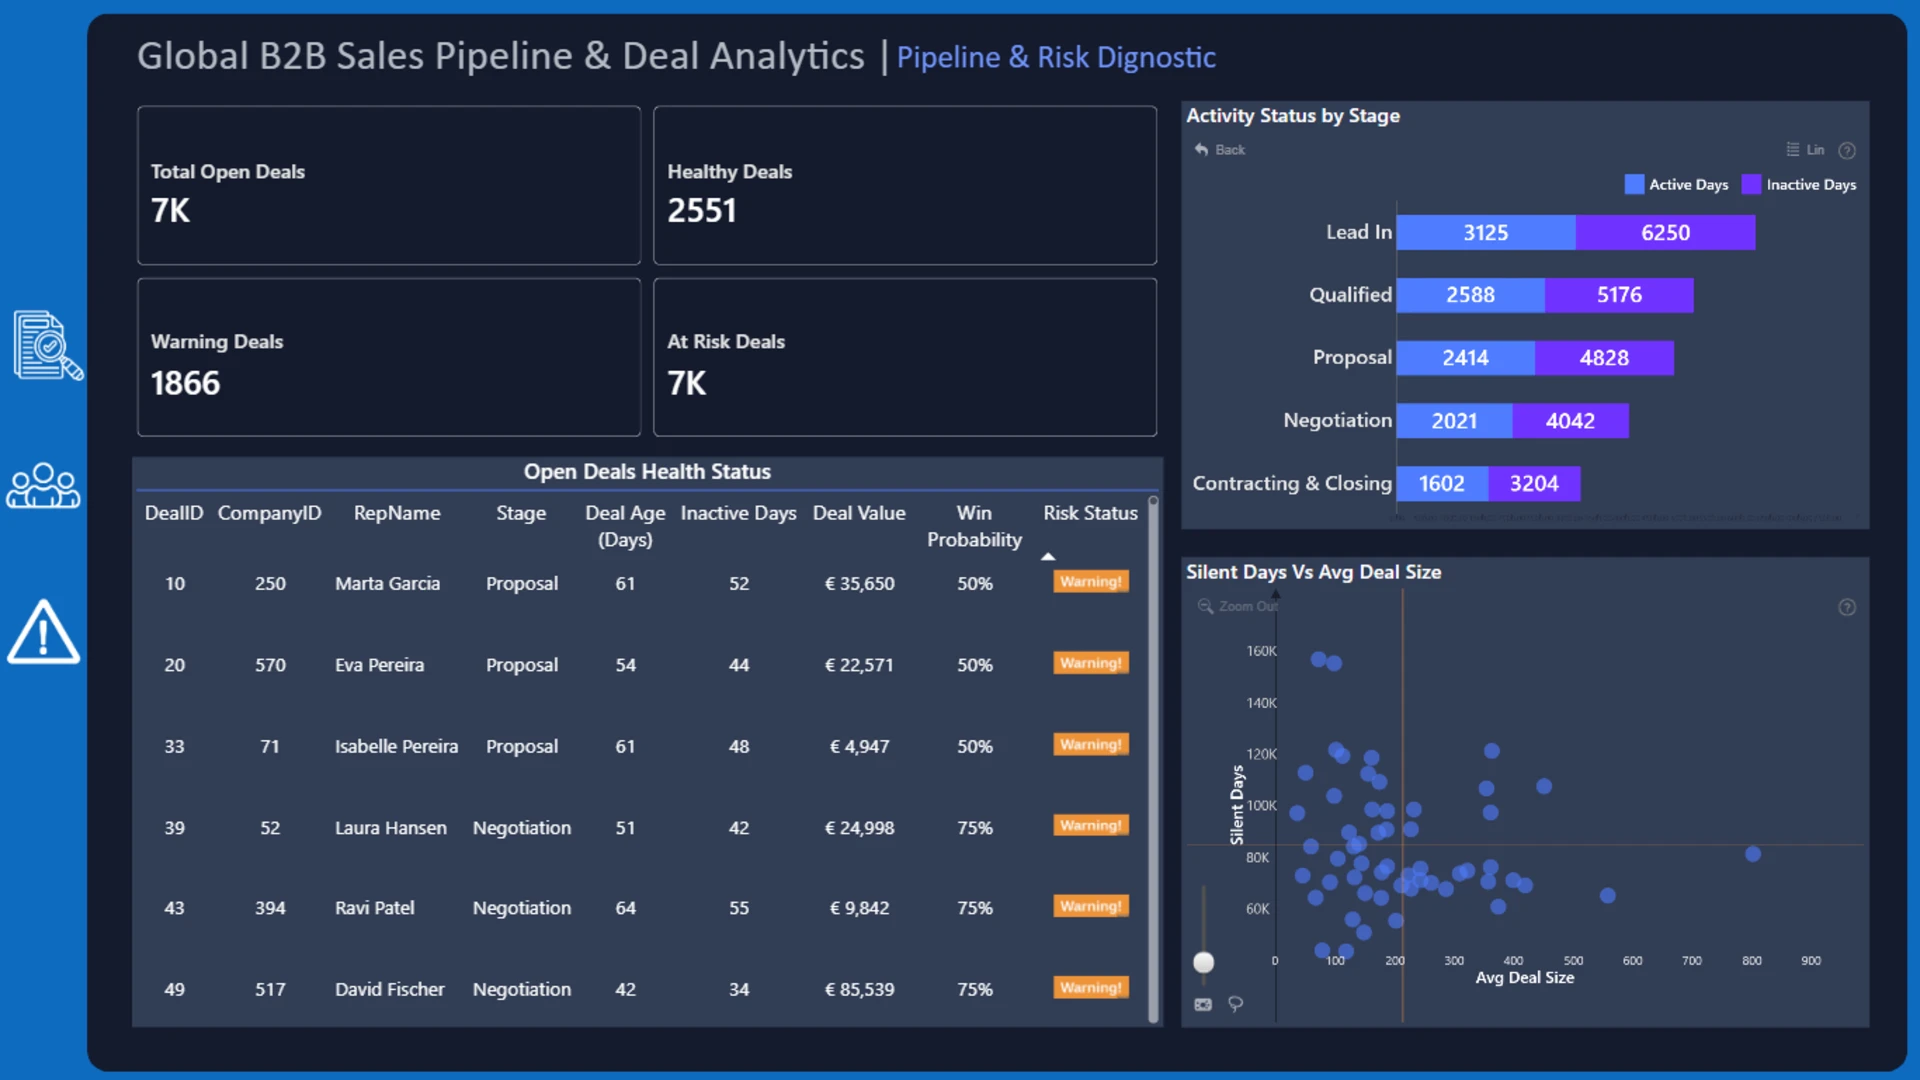
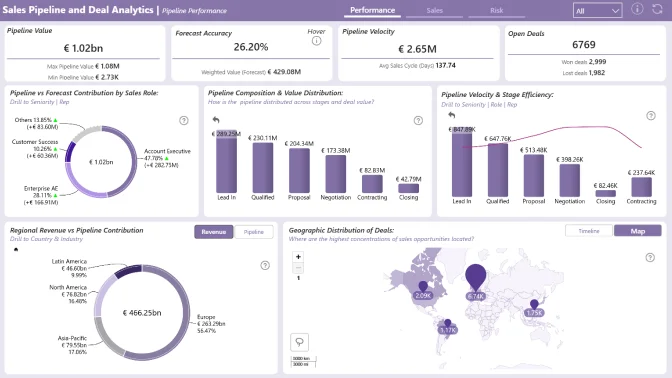
This interactive Power BI report explores the Global B2B Sales Pipeline & Deals Analytics dataset using ZoomCharts Drill Down PRO custom visuals for Power BI. It highlights pipeline value, deal progression, sales activity, and client engagement across regions and industries, helping teams monitor pipeline health and identify stalled or high-risk deals.
The report was submitted to the FP20 Analytics ZoomCharts Data Challenge #35 (February – March 2026).
Author’s Description:
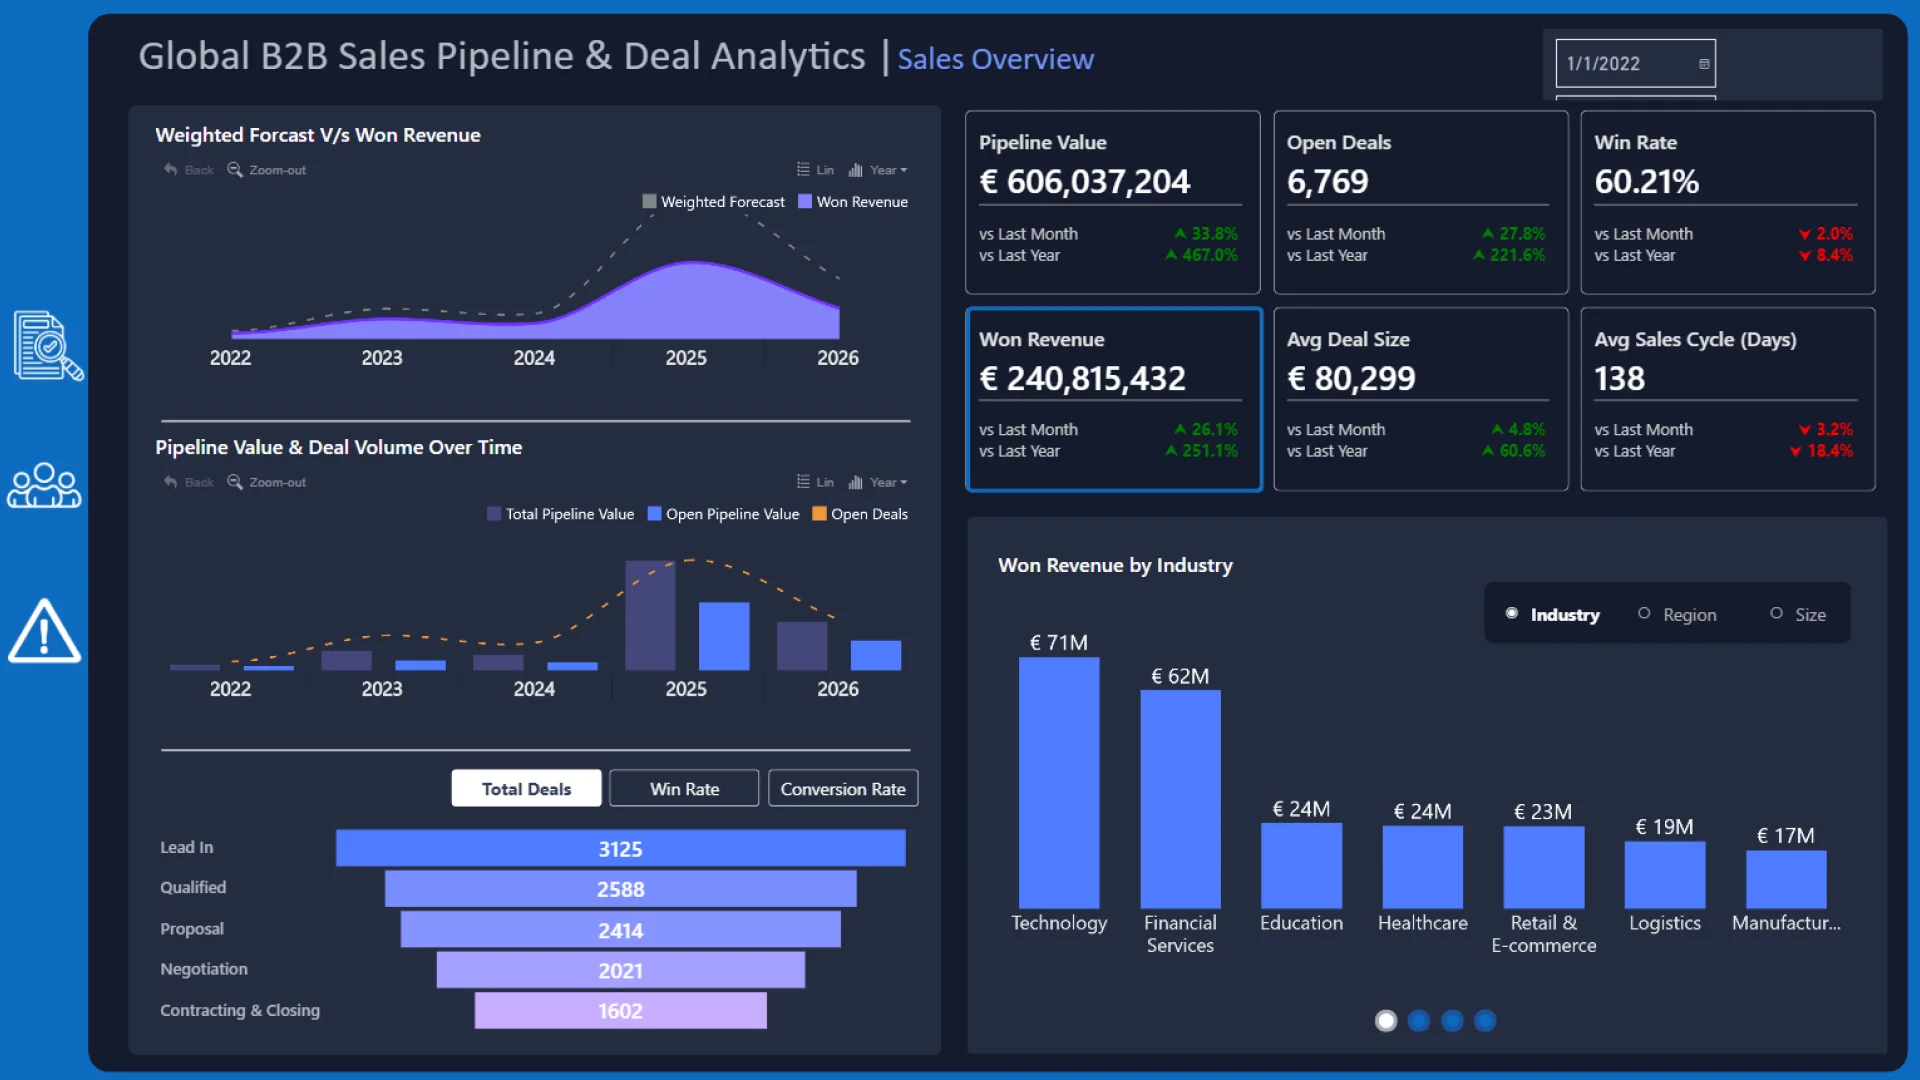
The Sales Pipeline Analytics Dashboard provides a comprehensive overview of sales performance and deal progression across the pipeline. It highlights key metrics such as won revenue, win rate, deal distribution by stage, and sales representative performance.
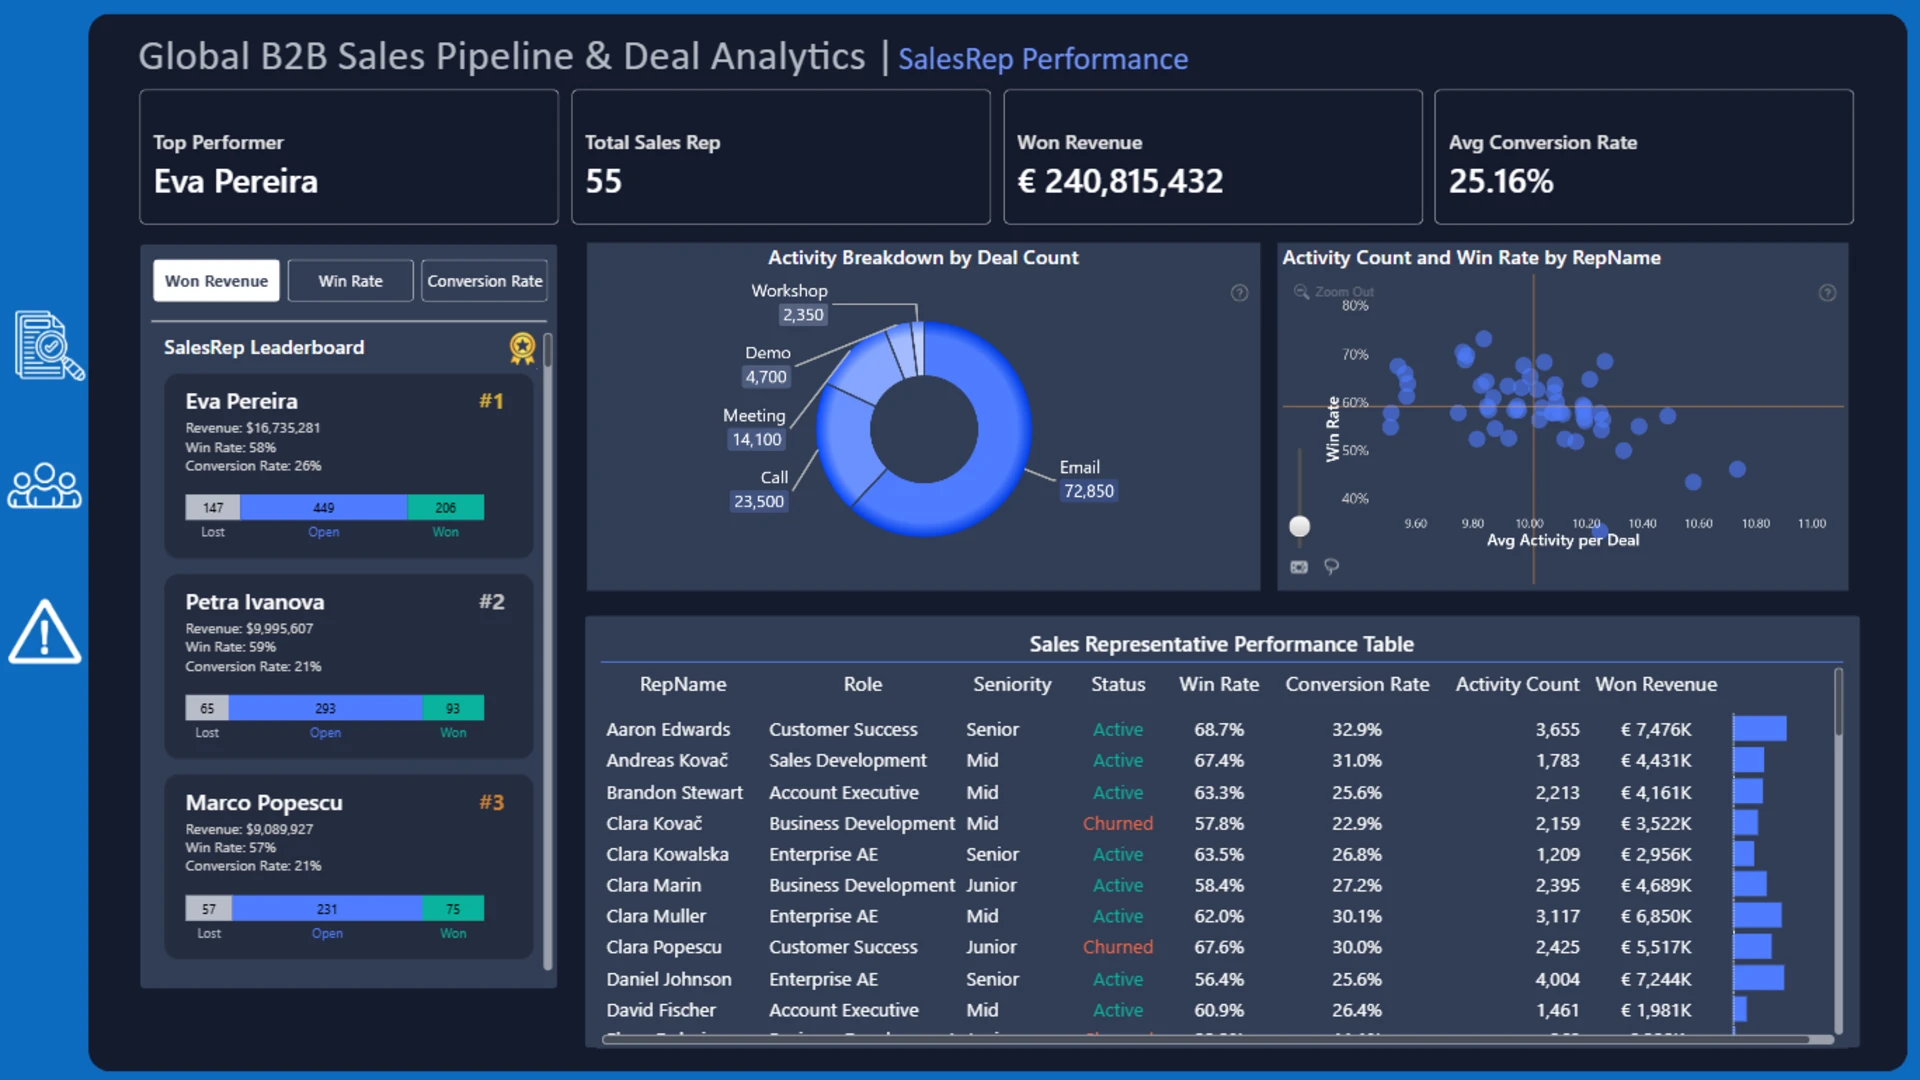
The dashboard also includes a Sales Representative Leaderboard, enabling comparison of deal outcomes (Won, Open, and Lost) and helping identify top performers as well as opportunities that require attention. Interactive visuals allow users to quickly analyze pipeline health, monitor sales activity, and support data-driven decision-making to improve conversion rates and drive revenue growth.
Although several additional features and improvements were planned, they could not be implemented due to time constraints.
ZoomCharts visuals used
4U Report Challenges
Participate in data challenges, build and submit reports to get free template downloads.
Join CommunityMobile view allows you to interact with the report. To Download the template please switch to desktop view.
Was this helpful? Thank you for your feedback!
Sorry about that.
How can we improve it?