995
Data Quality Power BI Report 2
Data Quality Power BI Report 2
More Report pages
Report Author: WalaaHafeez
995
Share template with others
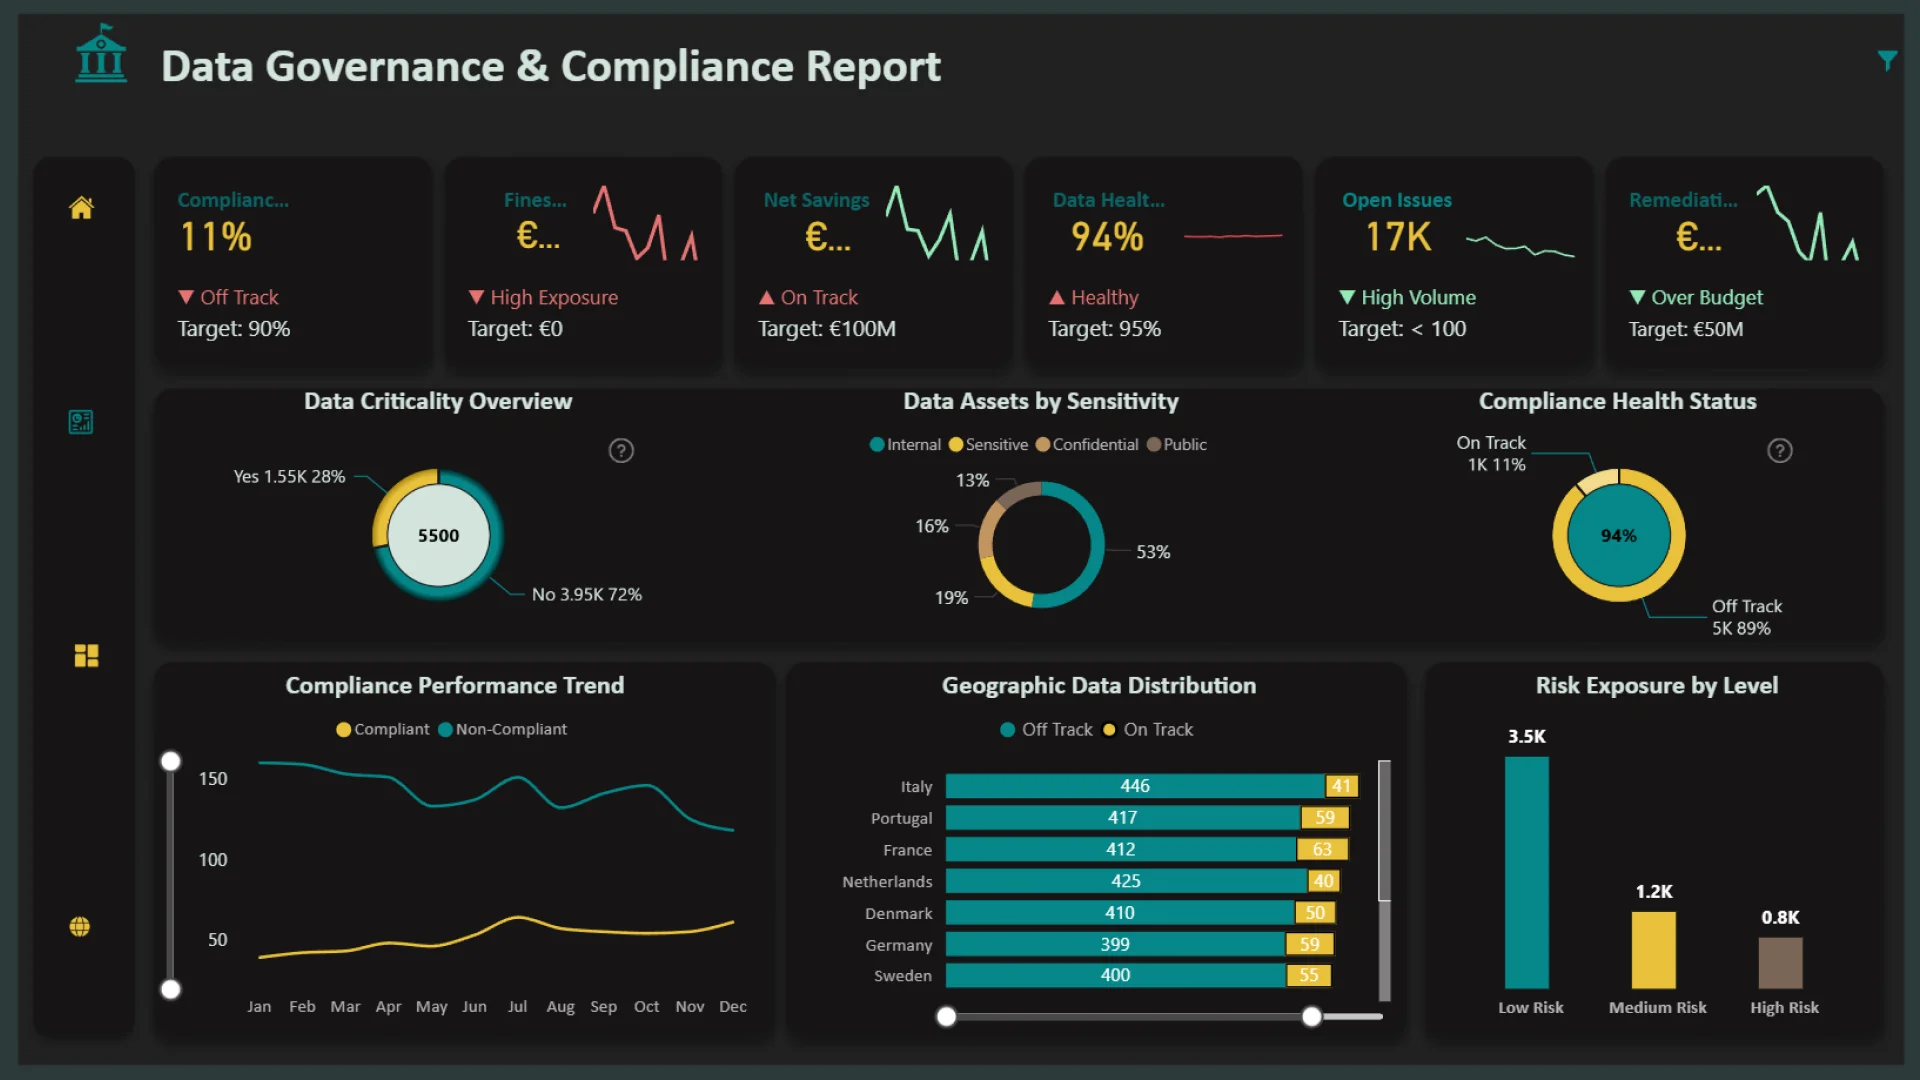
This Power BI report is built using the Enterprise Data Governance Dataset and features ZoomCharts Drill Down PRO custom visuals for Power BI. It was submitted to the FP20 Analytics ZoomCharts Data Challenge #34 (January 2026 – February 2026).
Author's Description:
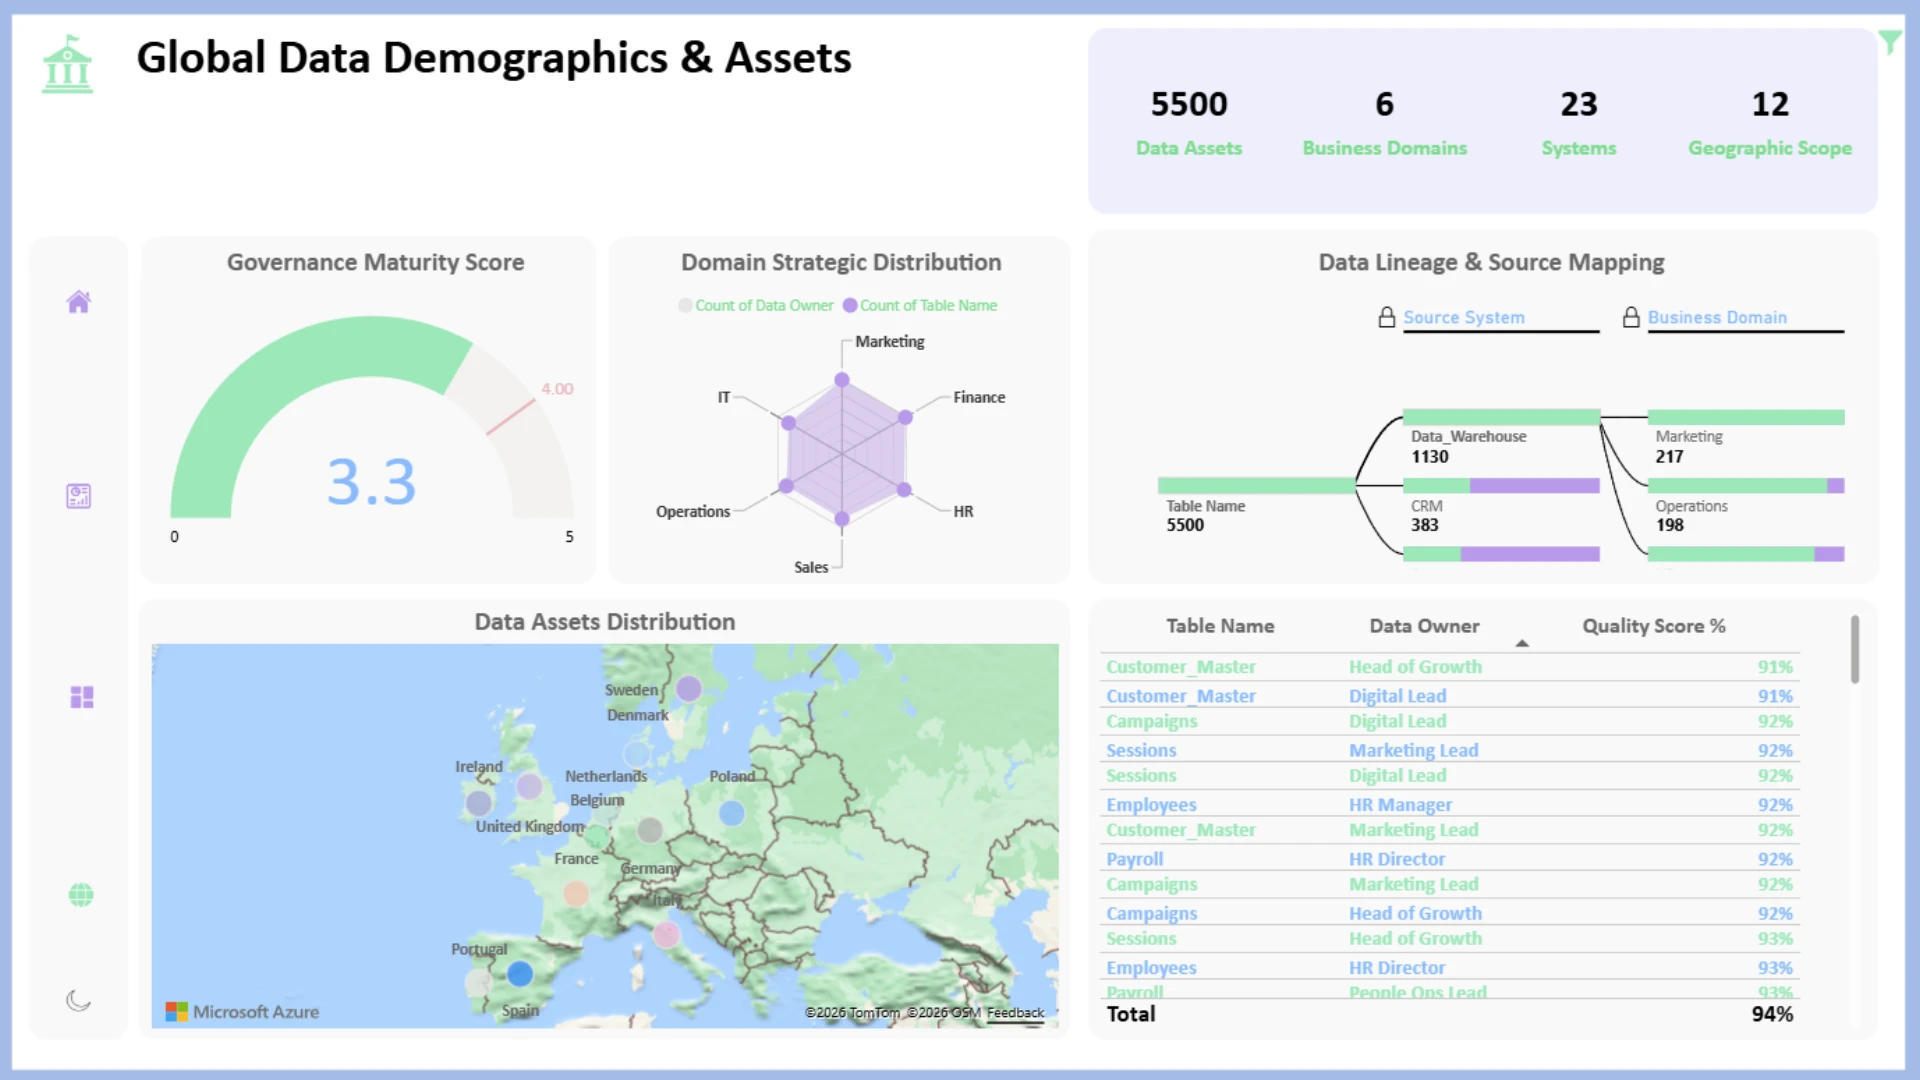
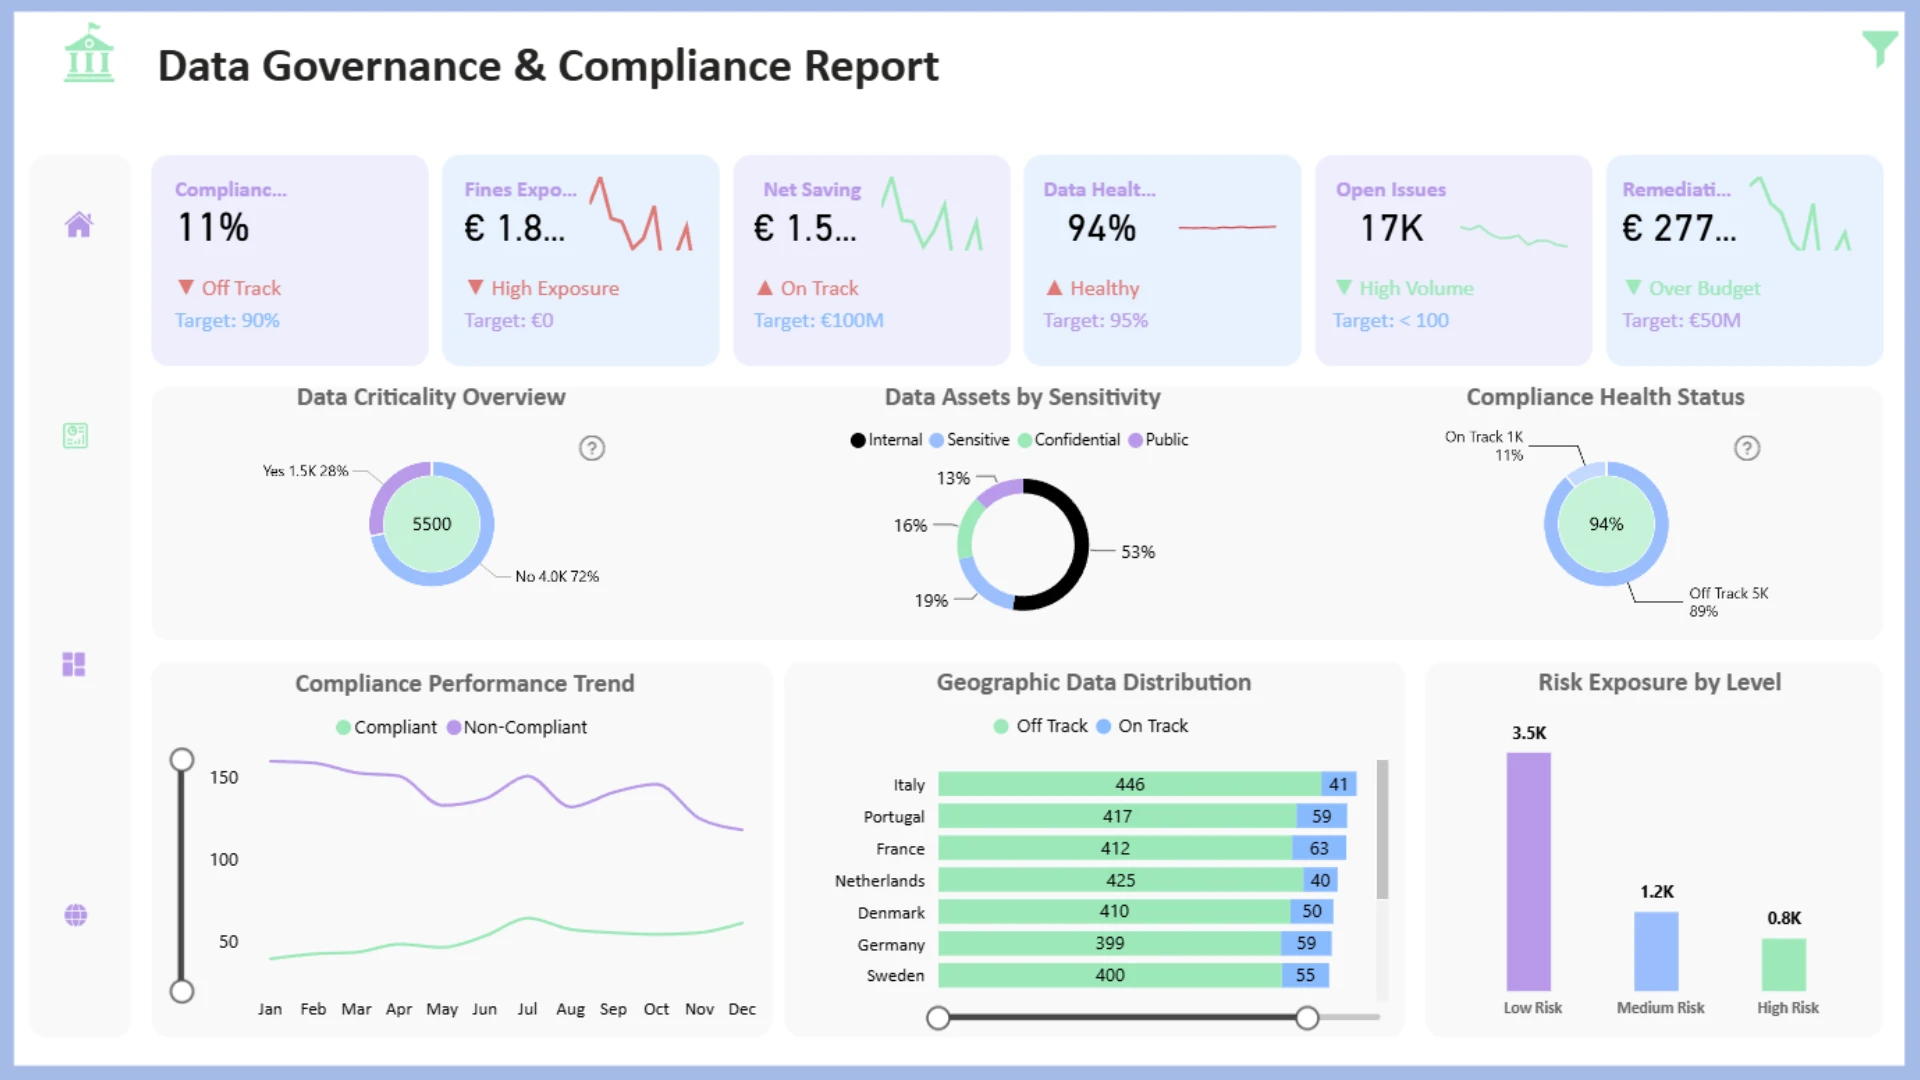
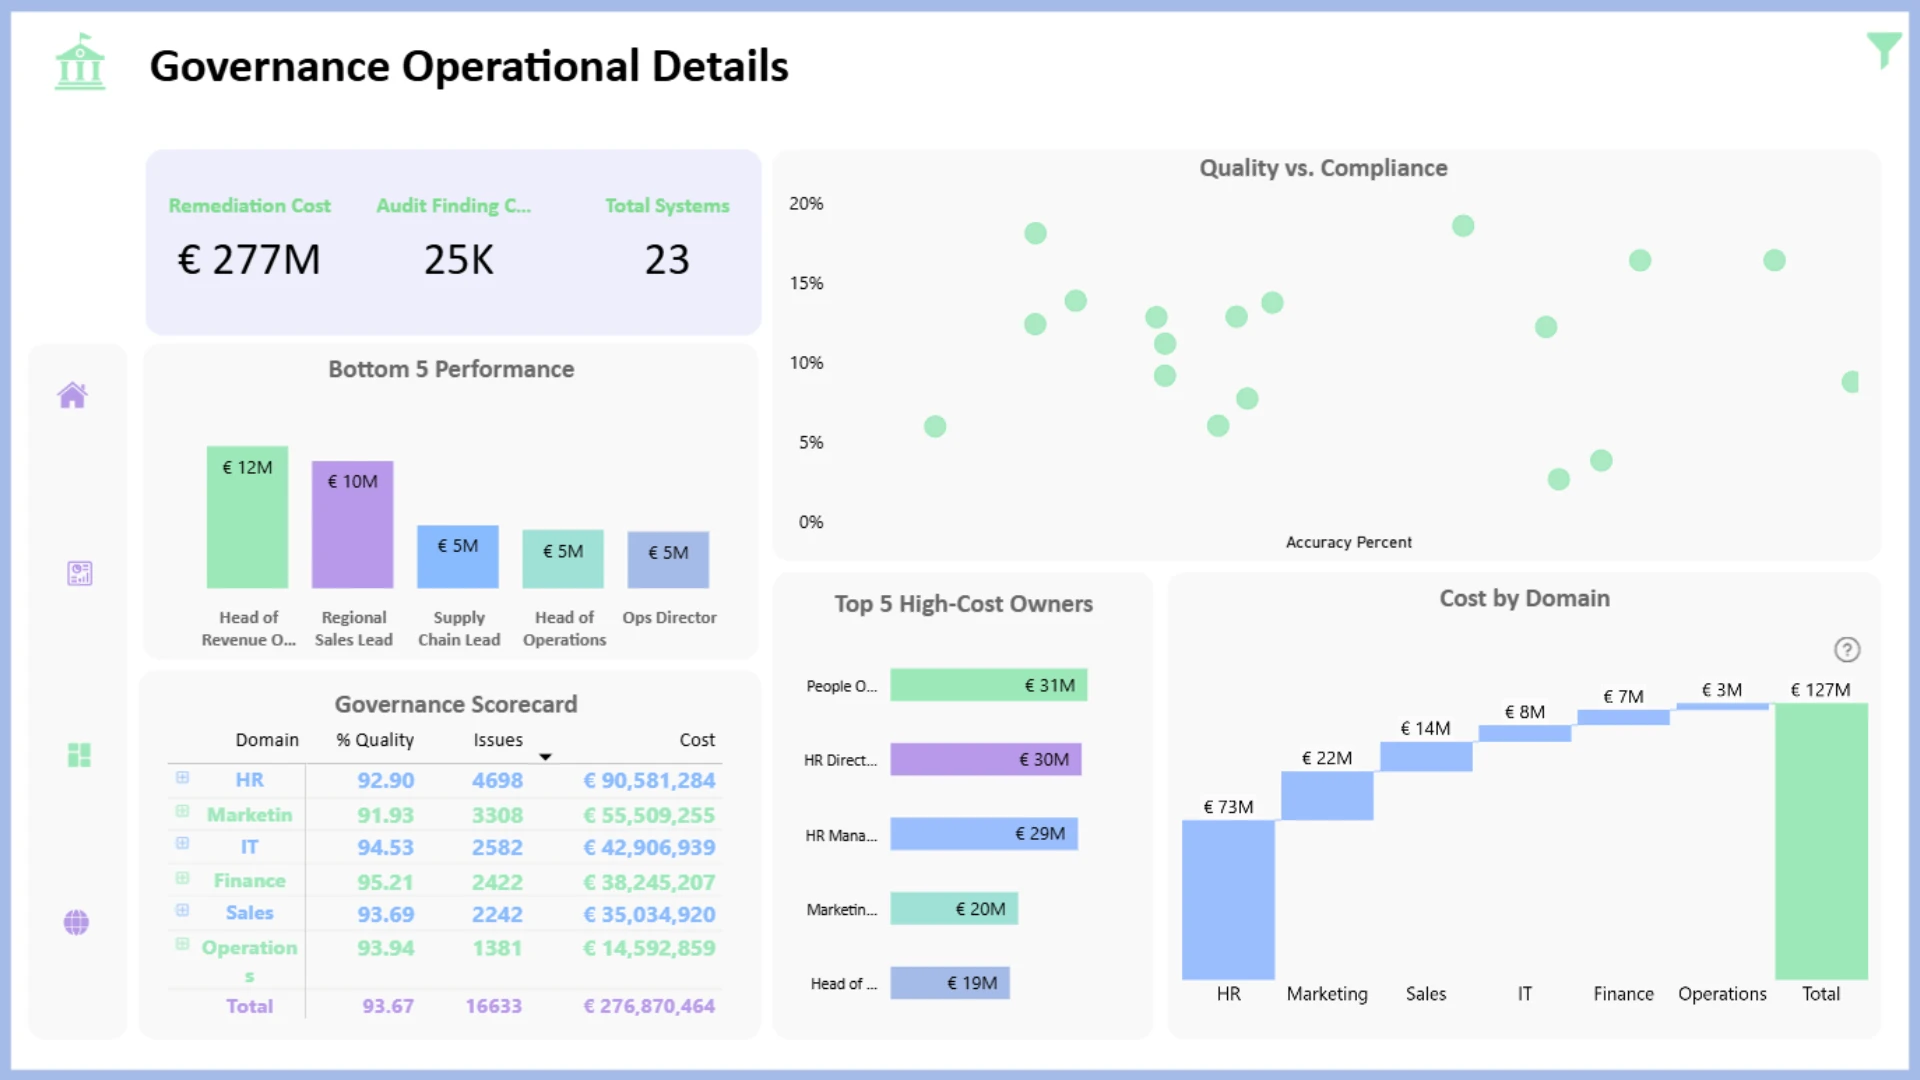
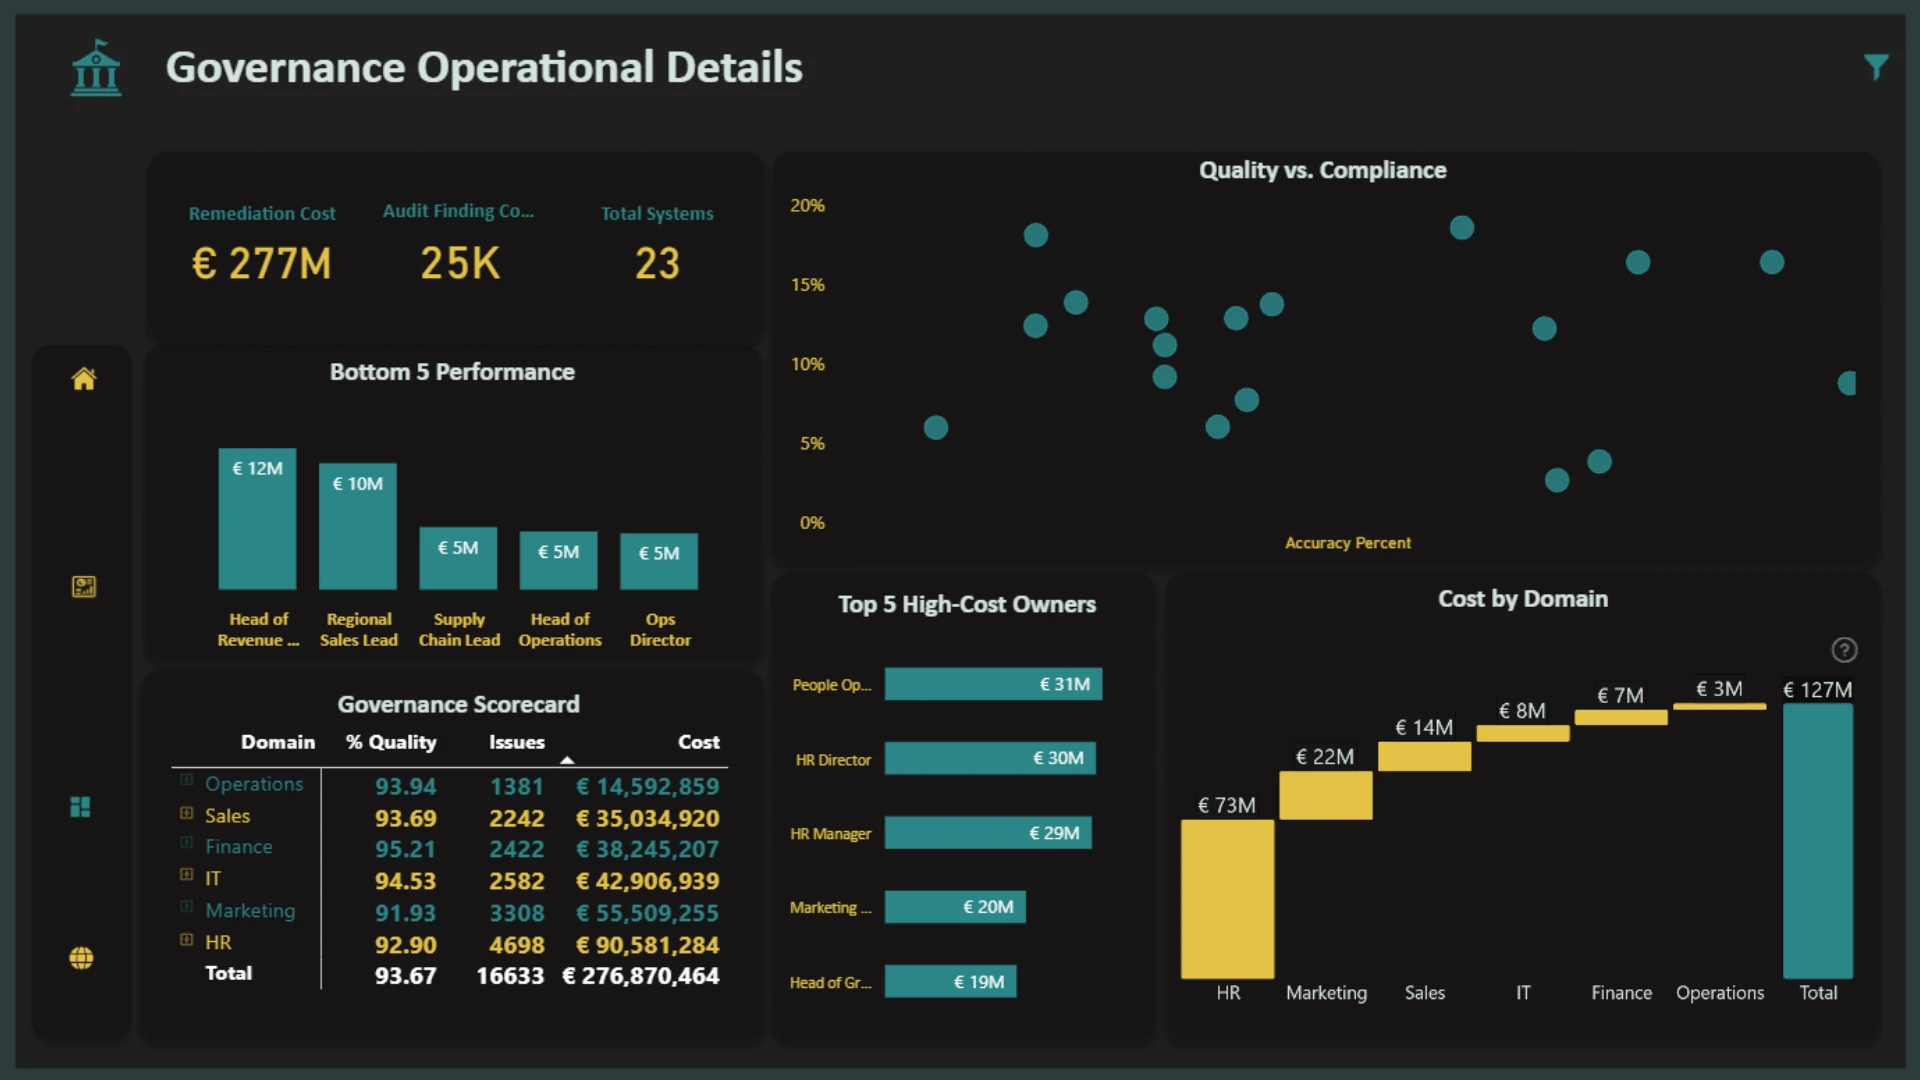
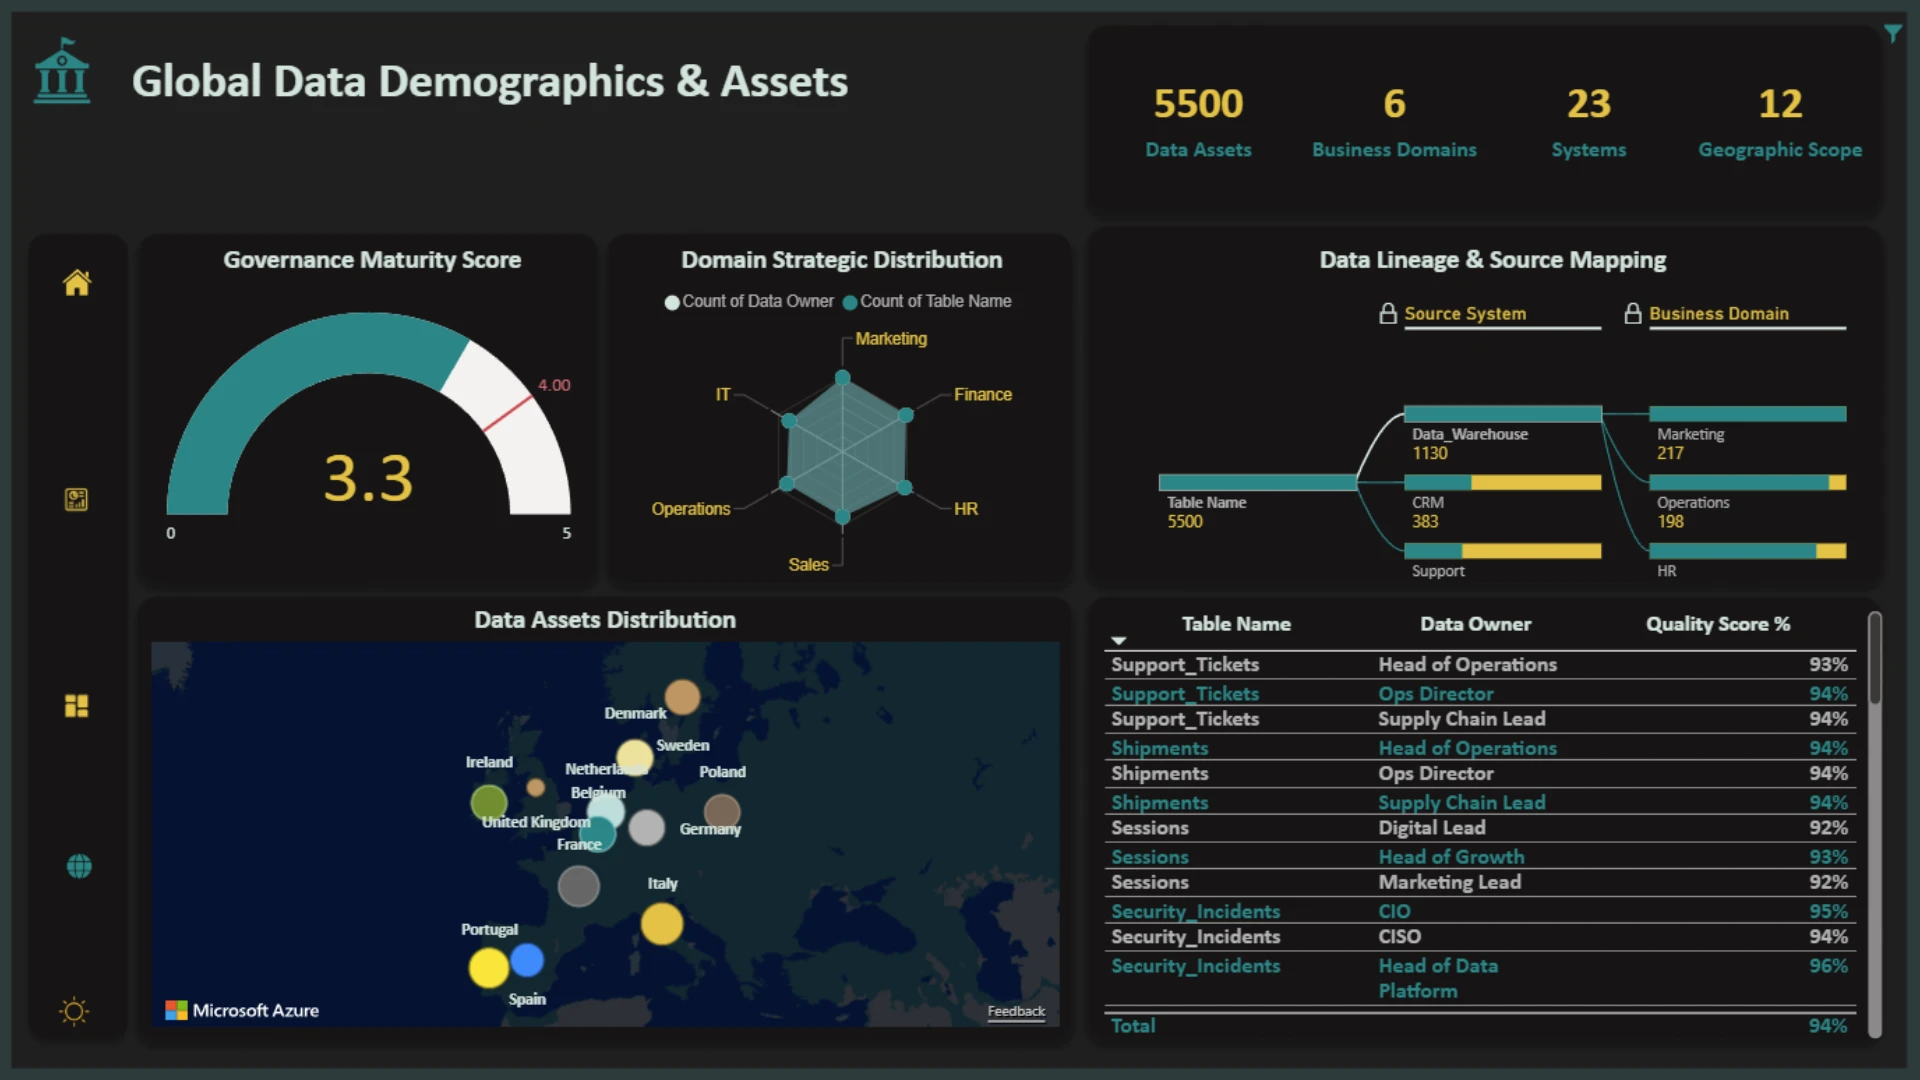
This report provides a comprehensive analysis of IT Governance and Risk Management, with a focus on asset criticality and compliance health. Key features include advanced visualisations using integrated ZoomCharts Drill Down Donut PRO visuals for an interactive user experience, centralised KPIs displayed directly within charts for immediate insight, and seamless drill-downs across risk levels and compliance statuses. The dashboard also uses a dual-mode design, balancing clarity and visual appeal to support high data density without compromising readability.
ZoomCharts visuals used
4U Report Challenges
Participate in data challenges, build and submit reports to get free template downloads.
Join CommunityMobile view allows you to interact with the report. To Download the template please switch to desktop view.


Was this helpful? Thank you for your feedback!
Sorry about that.
How can we improve it?