3261
CRM and Sales Pipelines Analysis
CRM and Sales Pipelines Analysis
More Report pages
Report Author: Iris Mejuto Crego
3261
Share template with others
Report submitted for FP20 Analytics ZoomCharts Challenge 17 (July 2024). The report was built with the CRM & Sales Pipeline Analysis dataset and includes ZoomCharts custom Drill Down PRO visuals for Power BI.
Author's description:
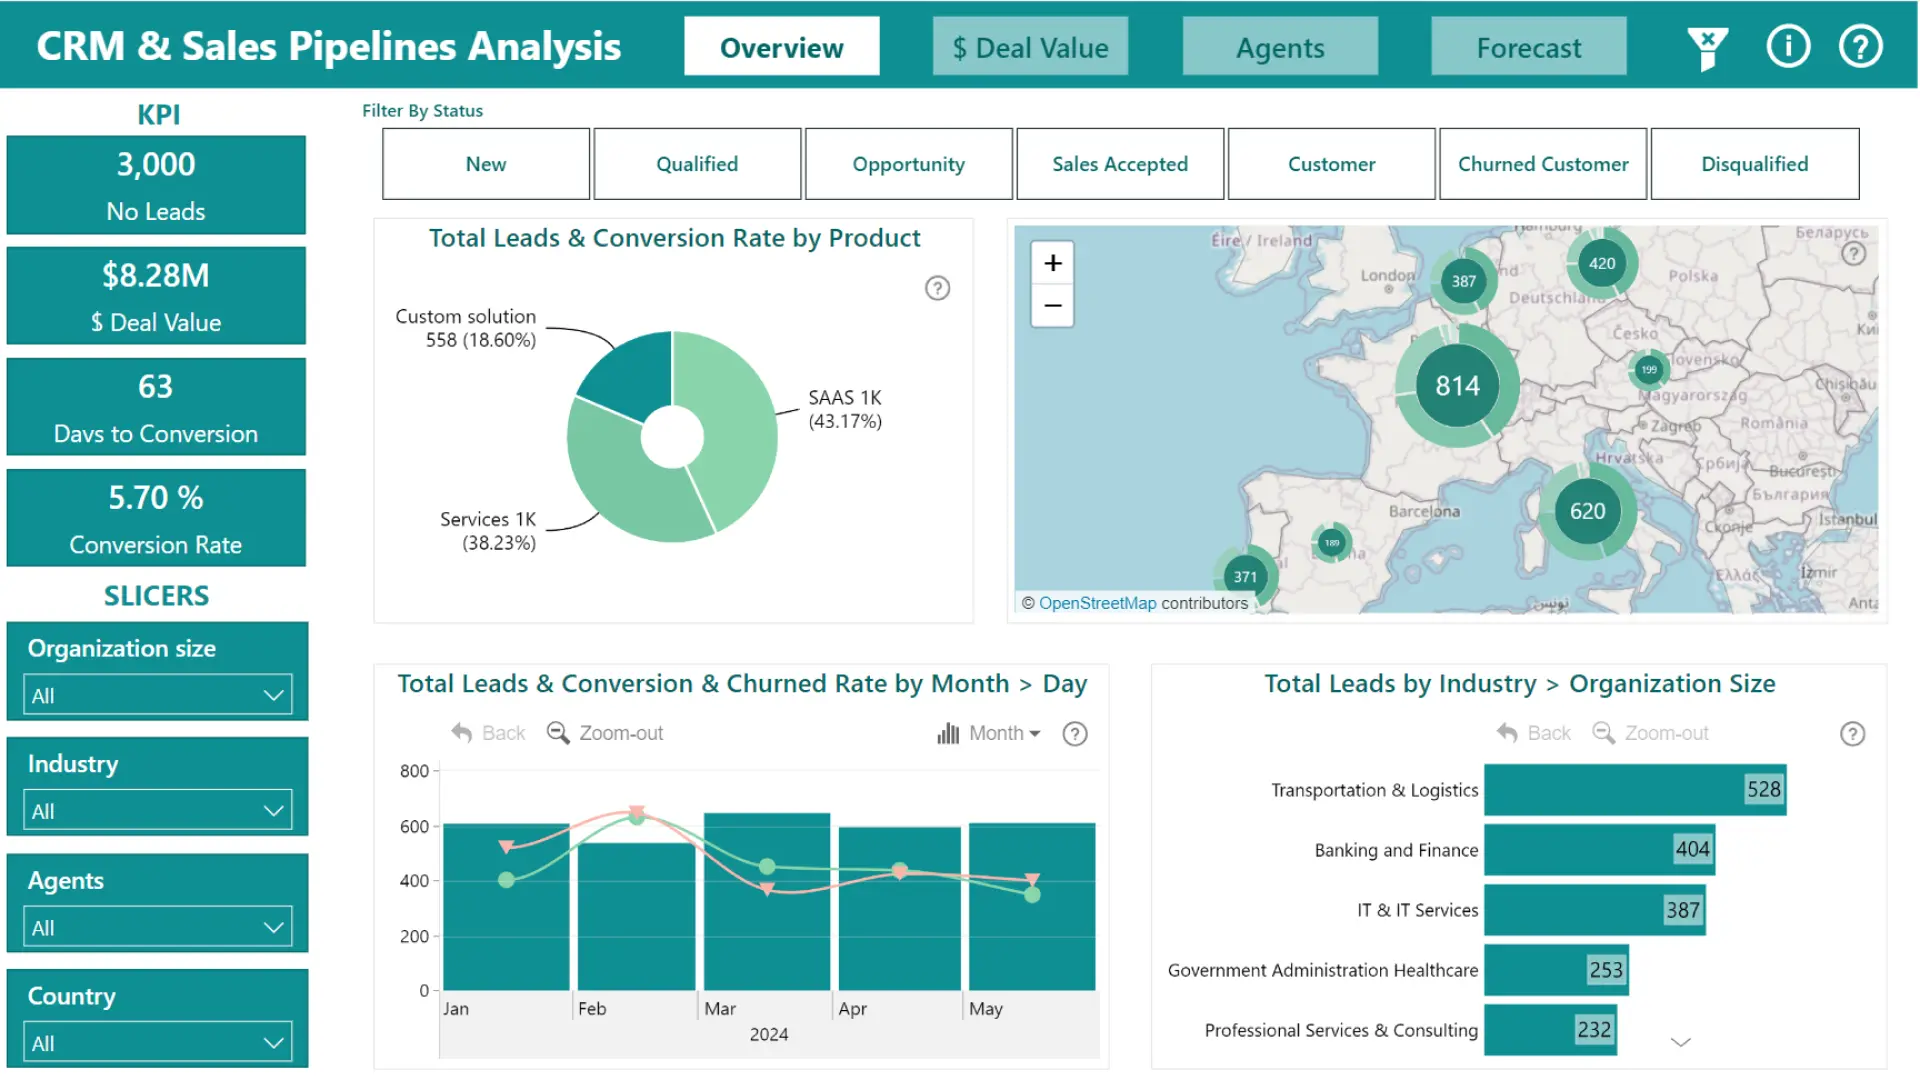
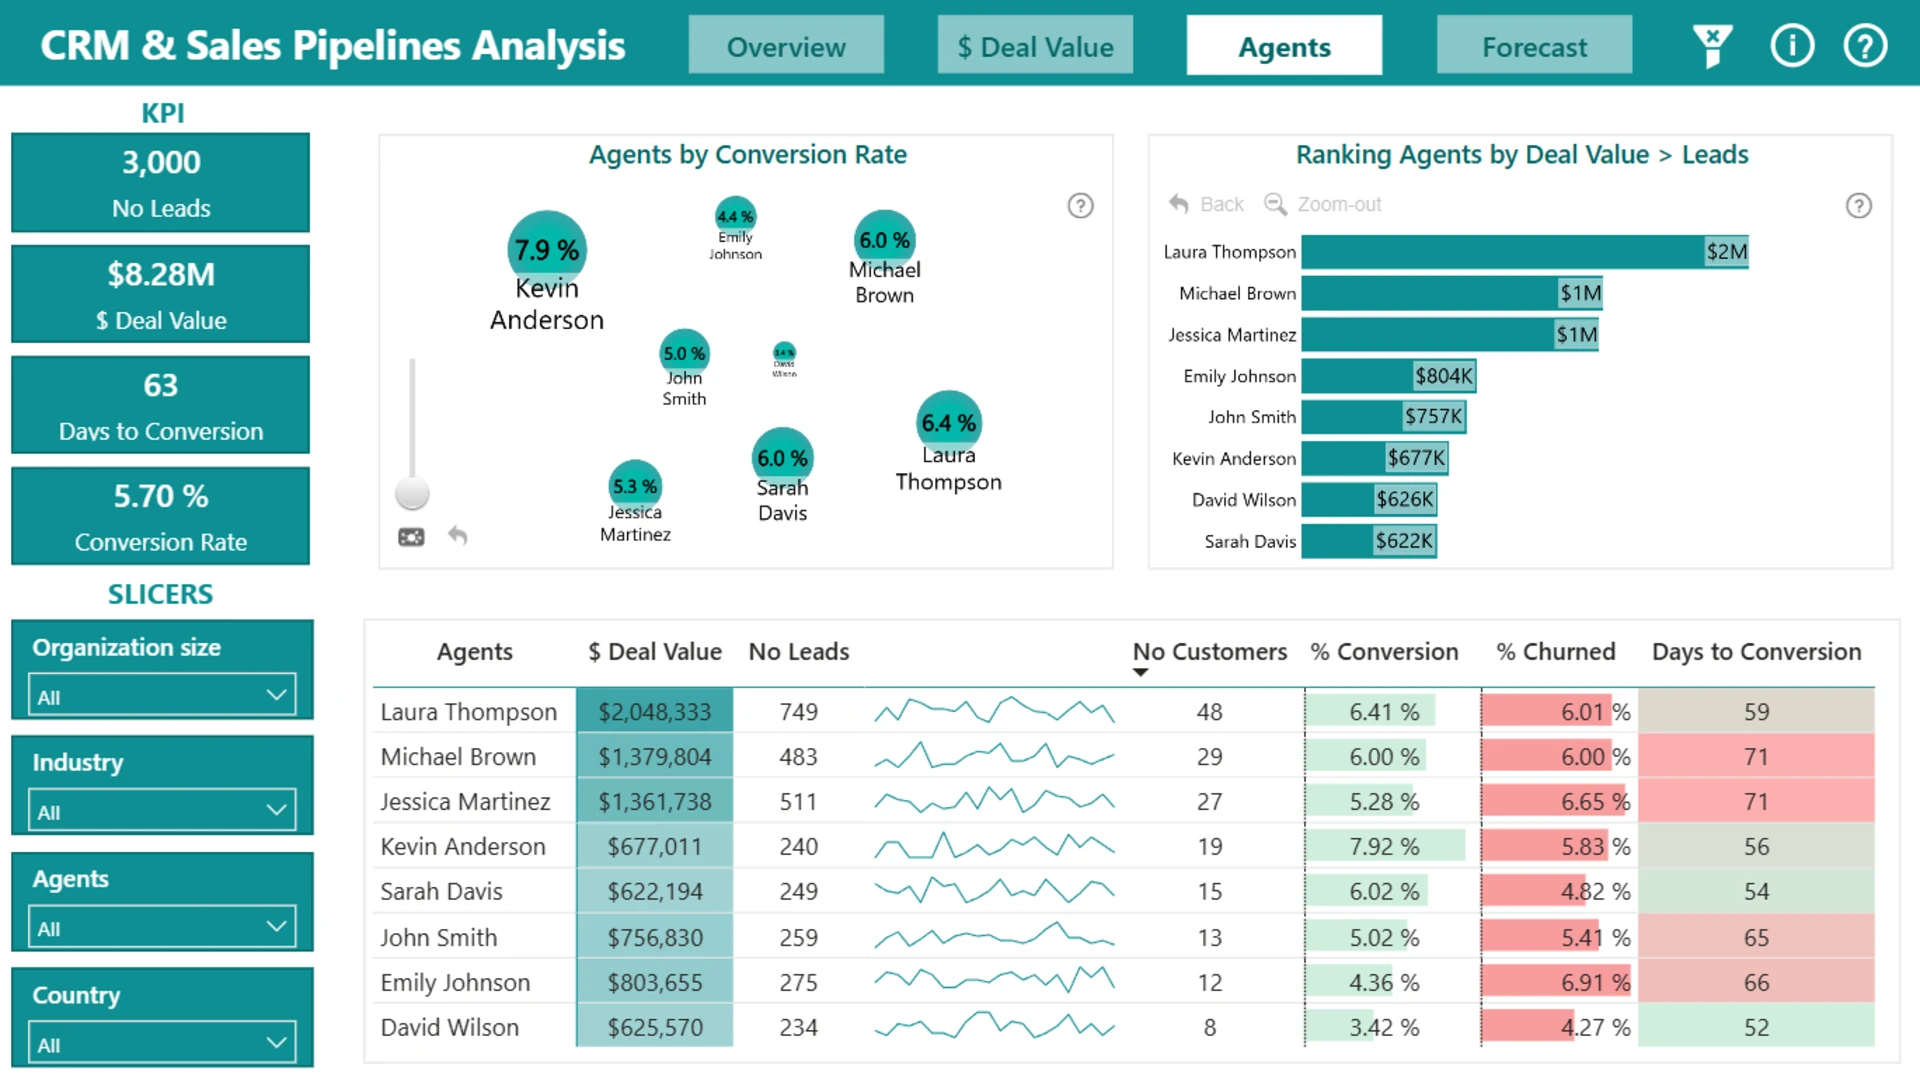
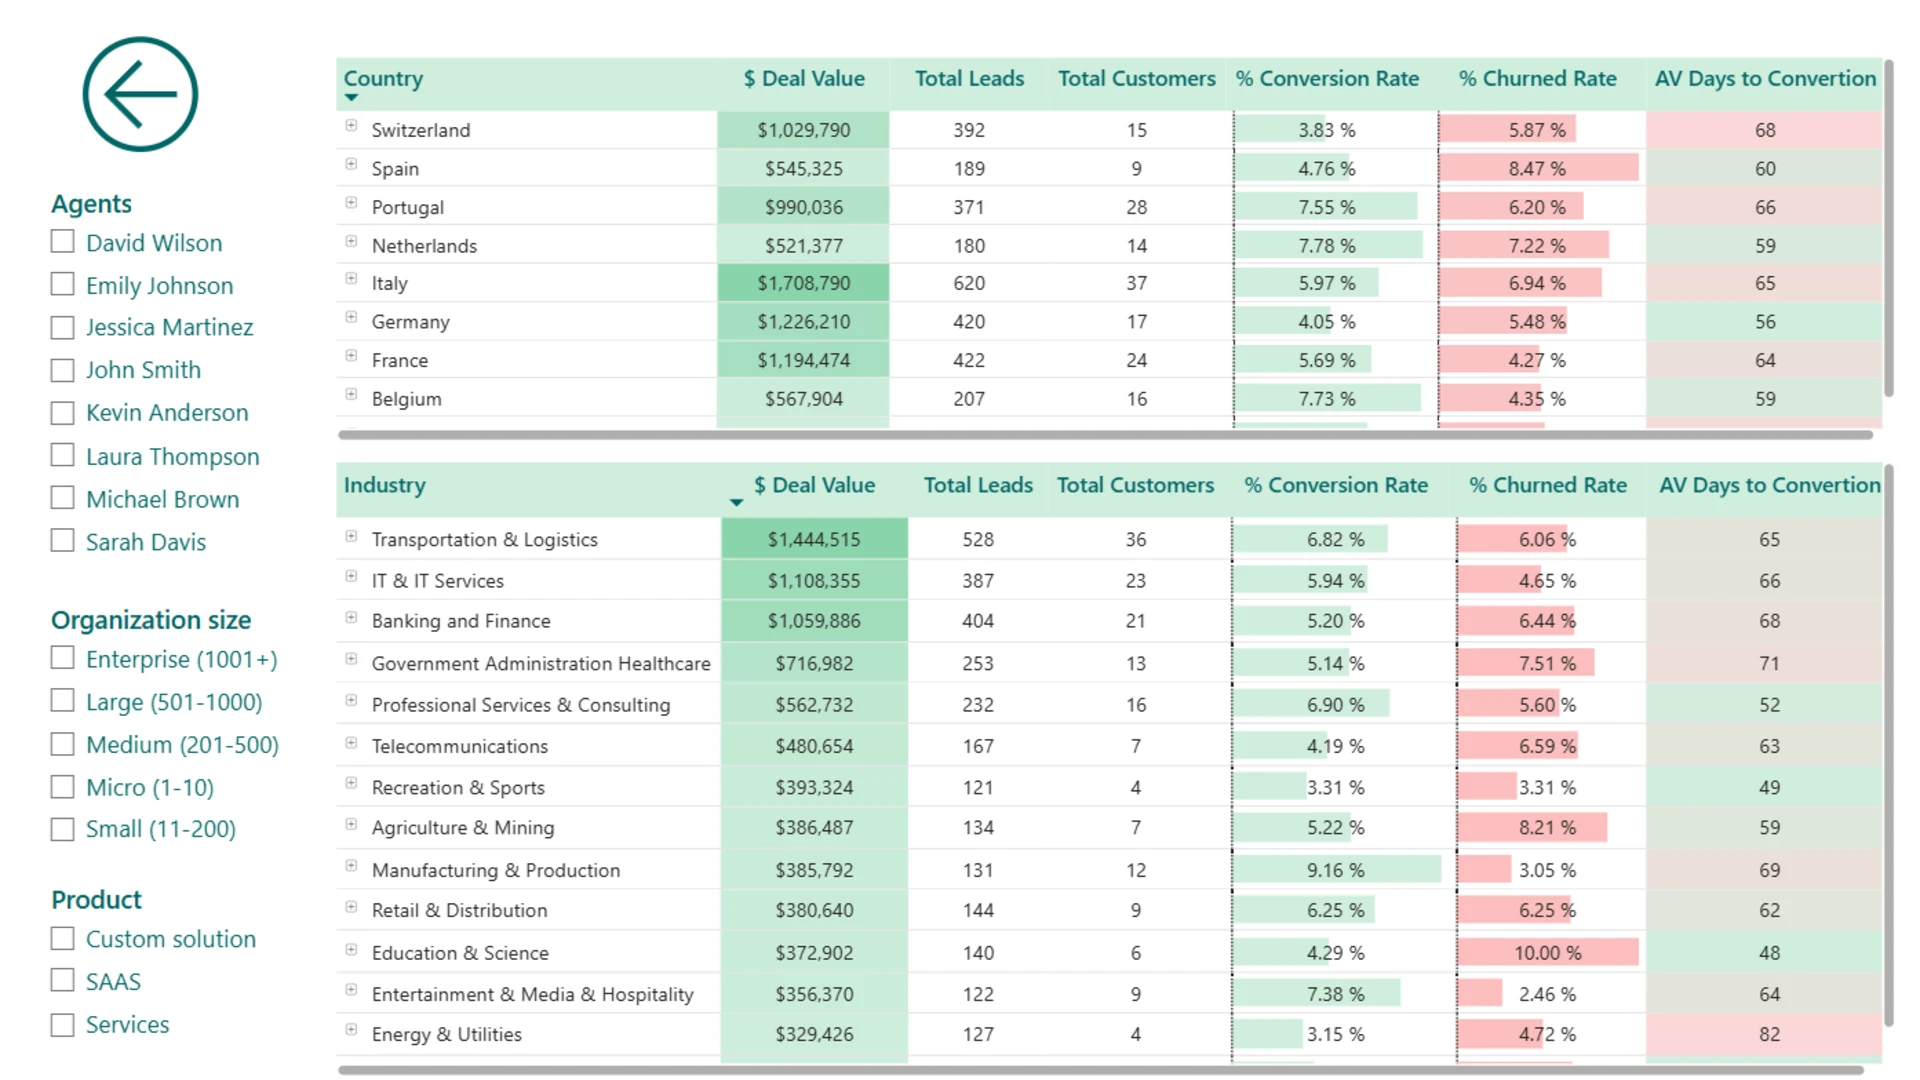
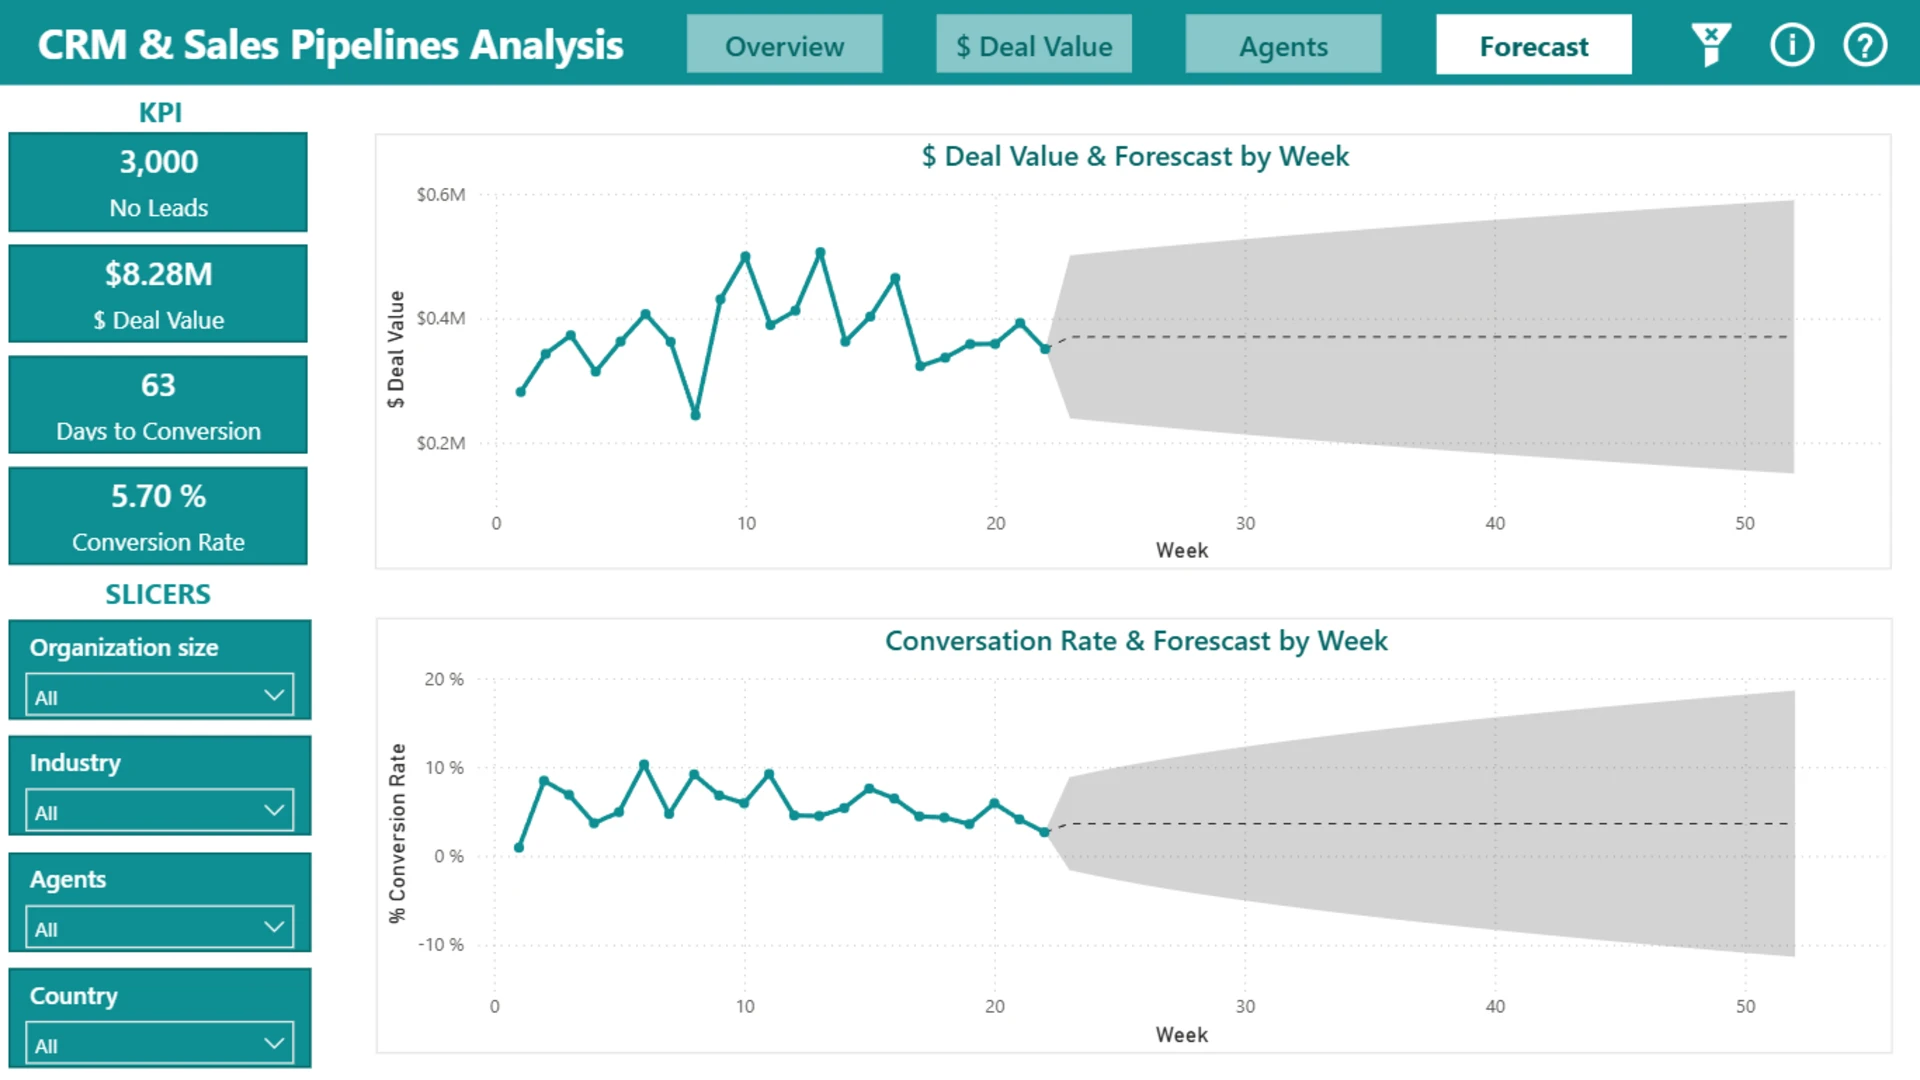
The report updated with some drill down levels in some of the charts. It includes detailed visualizations that provide insights into sales performance, lead conversion rates, and trends across multiple dimensions.
ZoomCharts visuals used
4U Report Challenges
Participate in data challenges, build and submit reports to get free template downloads.
Join CommunityMobile view allows you to interact with the report. To Download the template please switch to desktop view.


Was this helpful? Thank you for your feedback!
Sorry about that.
How can we improve it?