909
Christmas Sales and Trends Analysis 3
Christmas Sales and Trends Analysis 3
More Report pages
Report Author: Sushree Jena
909
Share template with others
Report submitted for the FP20 Analytics ZoomCharts Challenge, December 2024. The report was built using the Christmas Sales & Trends Dataset and includes ZoomCharts custom Drill Down PRO visuals for Power BI.
Author's description:
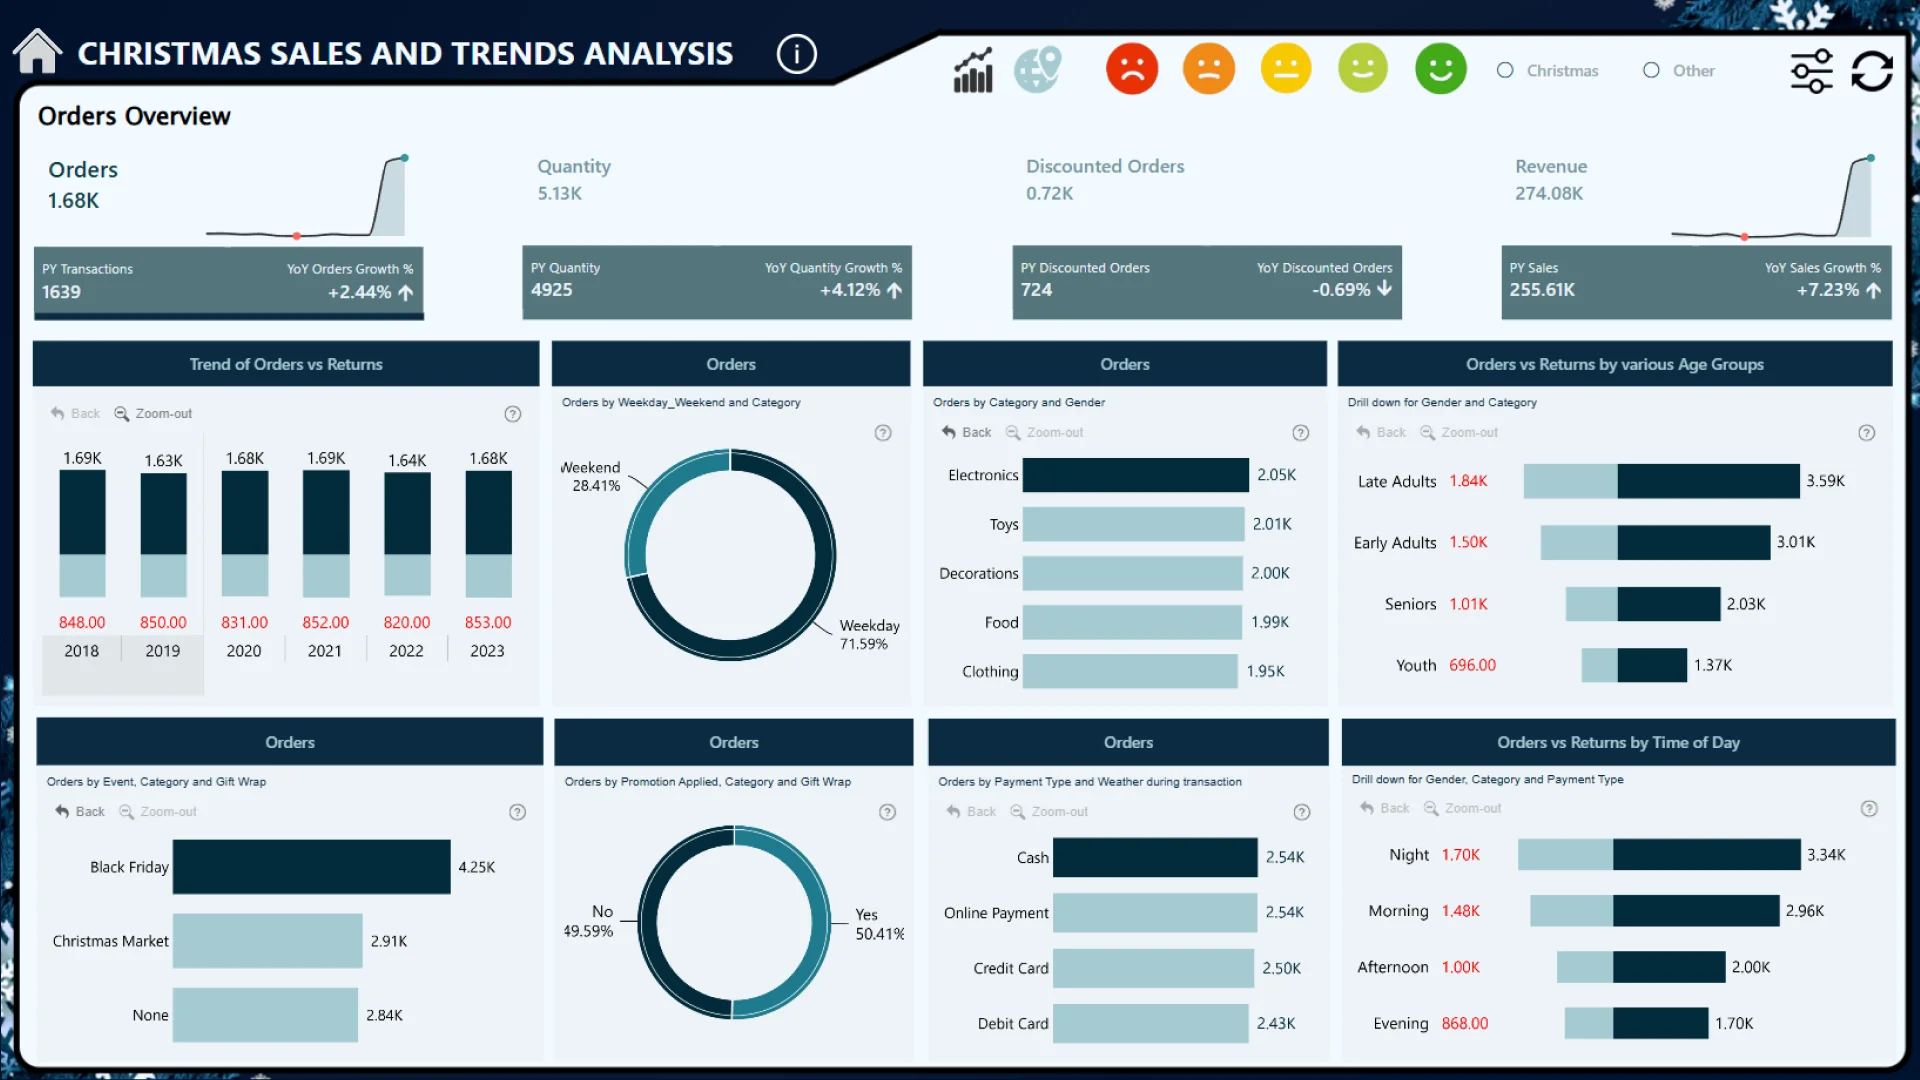
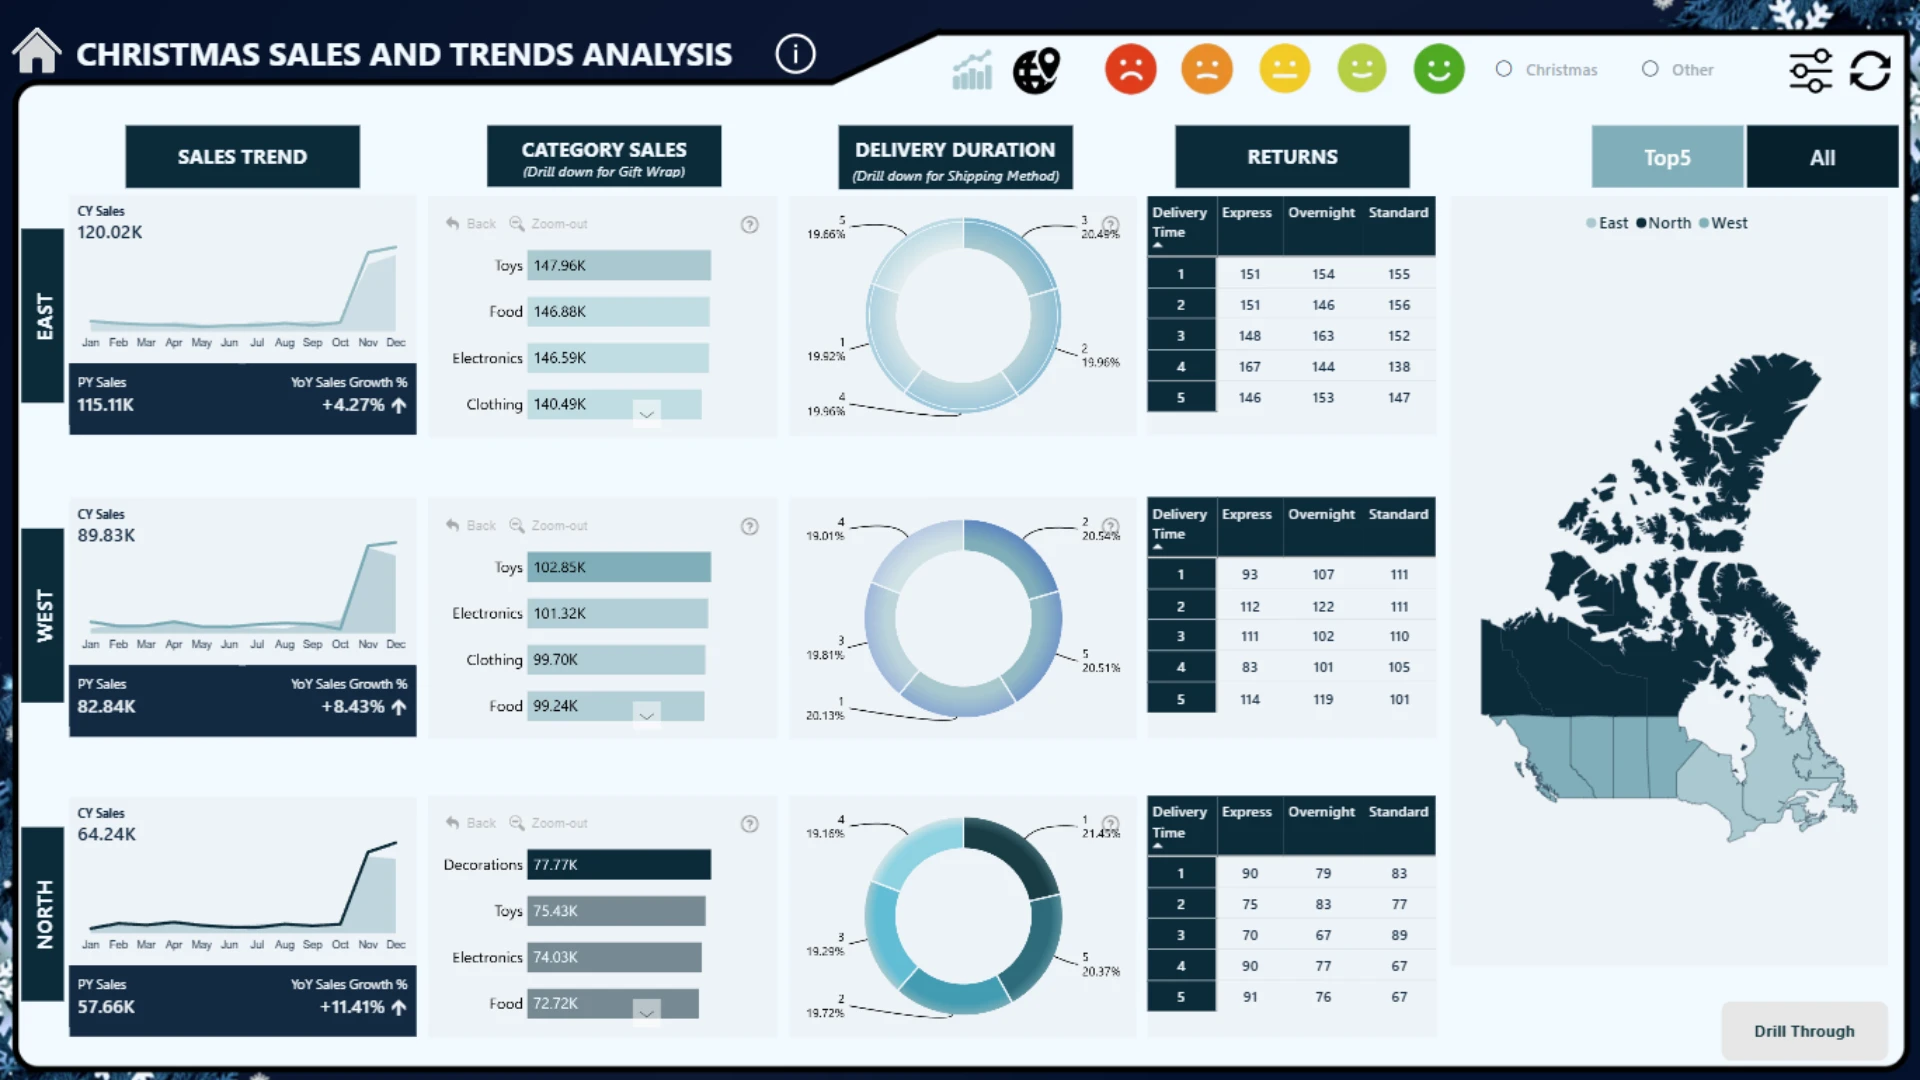
The Christmas Sales and Trends Dashboard provides a comprehensive overview of holiday shopping behavior, customer demographics, and product performance across regions. It allows users to explore key metrics such as total sales, delivery times, and customer satisfaction, with additional insights into payment methods and the impact of weather on transactions. This dashboard could be an essential tool for identifying seasonal sales patterns and optimizing marketing strategies.



4U Report Challenges
Participate in data challenges, build and submit reports to get free template downloads.
Join CommunityMobile view allows you to interact with the report. To Download the template please switch to desktop view.
How to use a PBIX template
Preview the interactive report, download the PBIX file, open it in Power BI Desktop, and replace the same data connection with your own dataset.
Preview and download
Explore the report online and download the PBIX template file.
Open in Power BI Desktop
Open the downloaded PBIX file in Power BI Desktop.
Connect your data
Replace the sample data source with your own dataset.
Refresh and adjust
Refresh the model and update fields or visual were needed.
Save and share
Save your report and publish it for your audience.


