1989
App Store Sales Analysis Power BI Dashboard Example
App Store Sales Analysis Power BI Dashboard Example
More Report pages
Report Author: Ashkan Darabi
1989
Share template with others
Summary
This Power BI App Store games analysis report explores mobile game performance, pricing, ratings, genres, developers, and user engagement across the App Store games category.
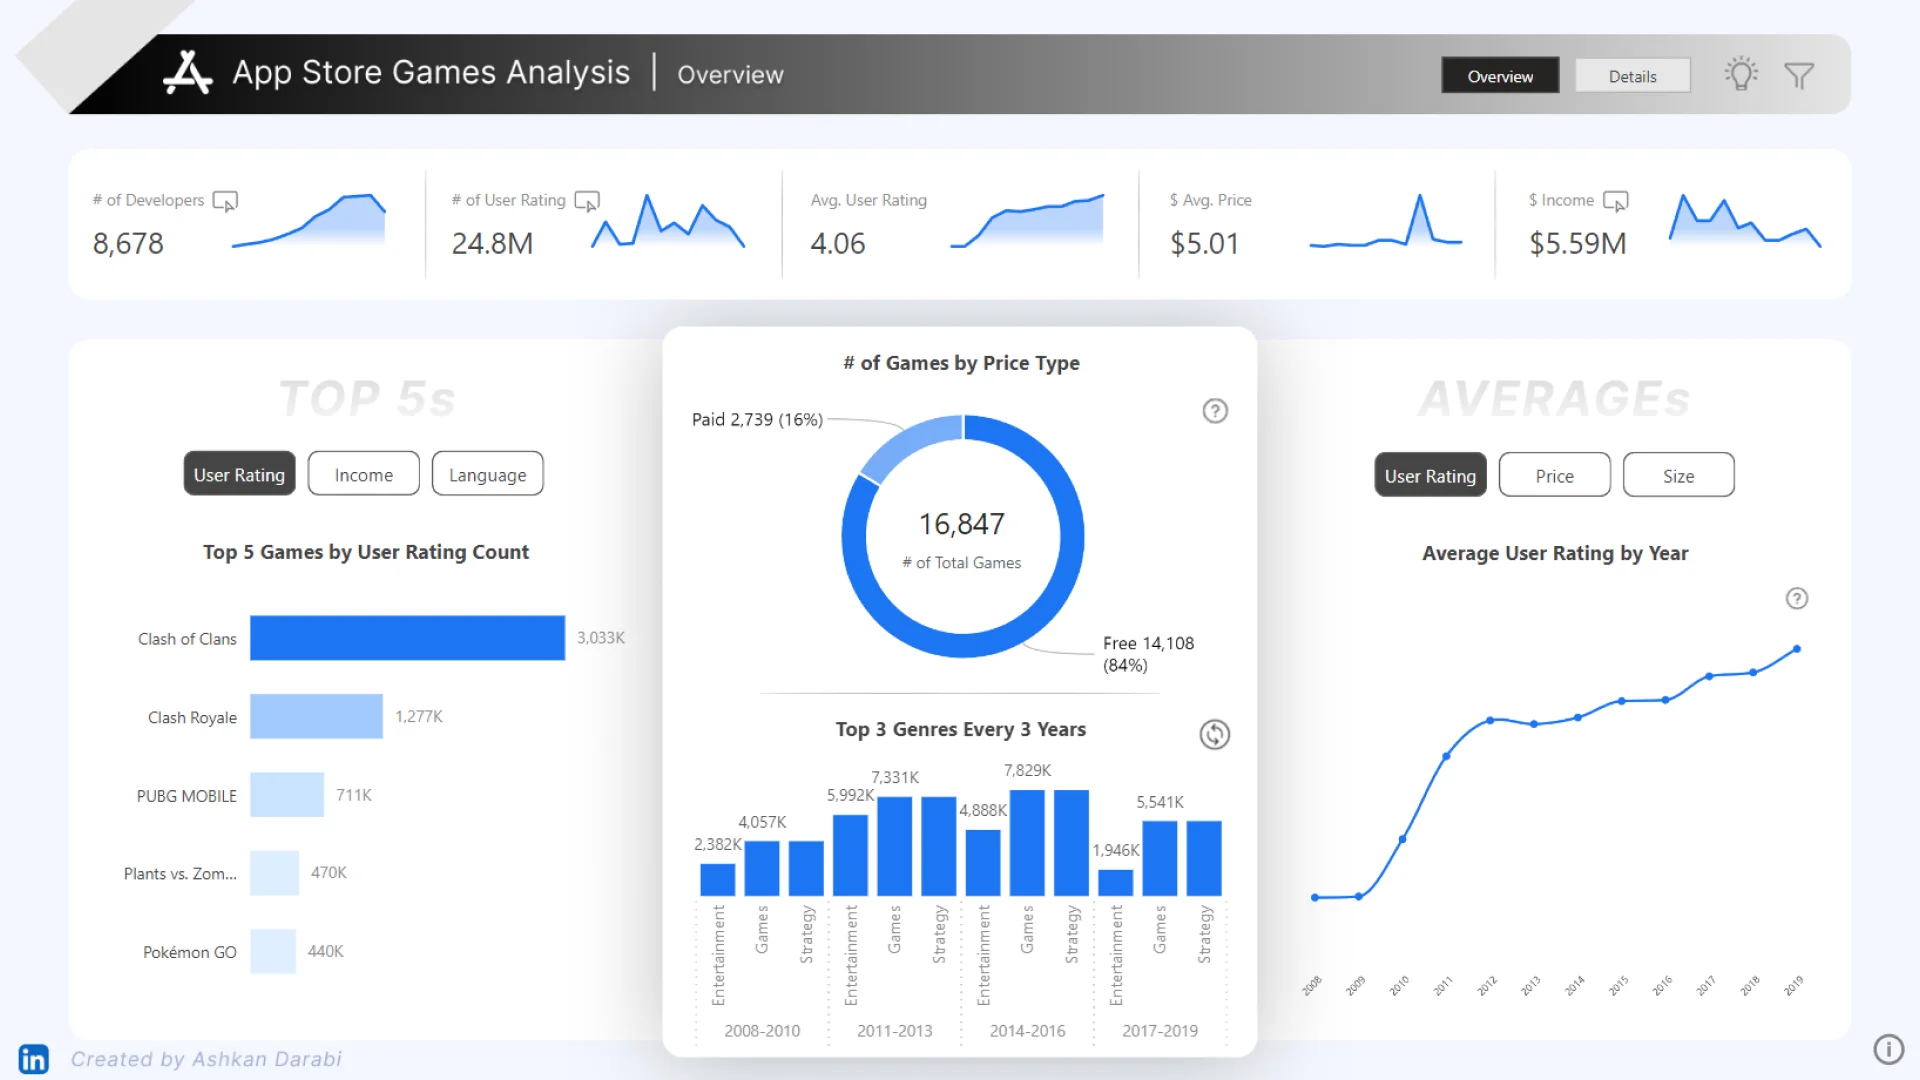
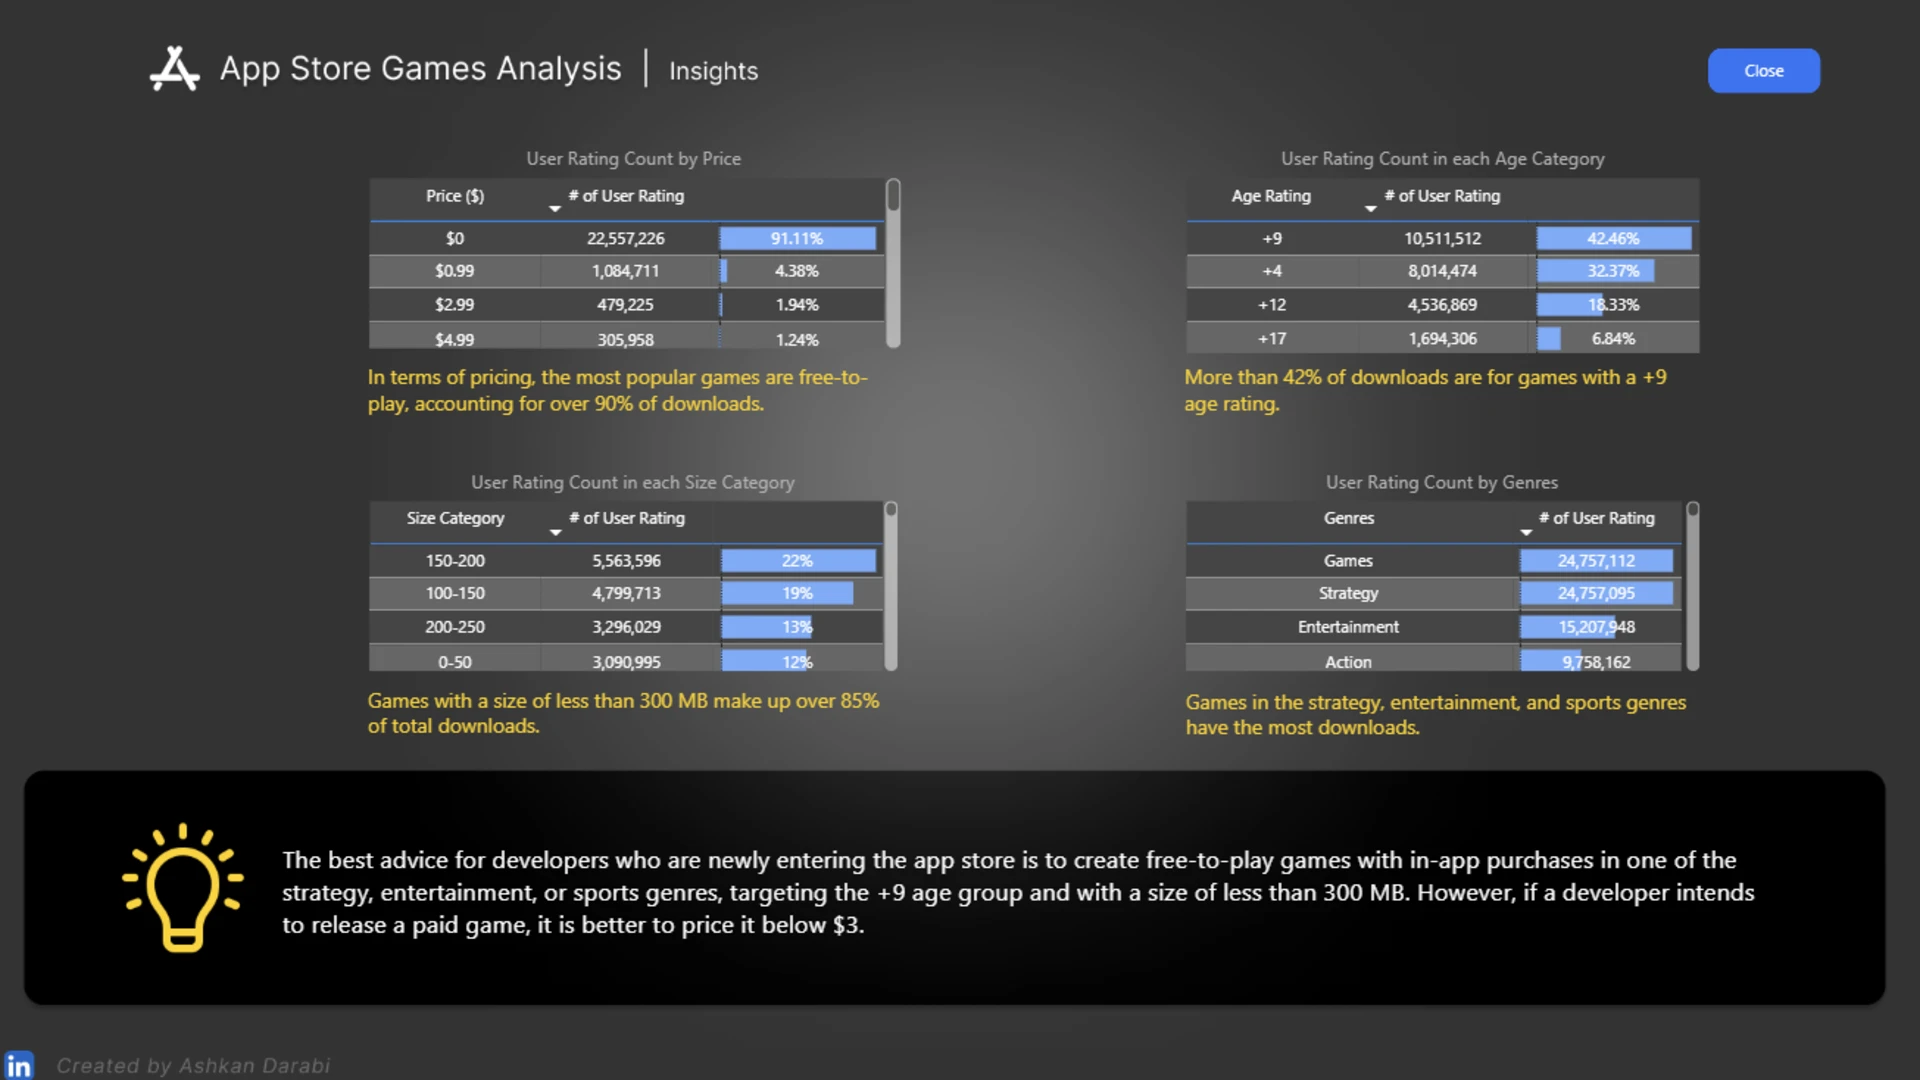
The report analyzes more than 16K games and 24.8M user ratings to reveal insights into game popularity, pricing models, average ratings, income, genre trends, and developer performance. It combines ZoomCharts custom visuals with native Power BI visuals to create an interactive two-page analytical experience with overview and detail views.
Key Insights of This Report
This dashboard displays various App Store games metrics, including:
- Number of developers
- Number of user ratings
- Average user rating
- Average app price
- Estimated income
- Free vs. paid game distribution
- Top games by user rating count
- Top genres over time
- Average user rating by year
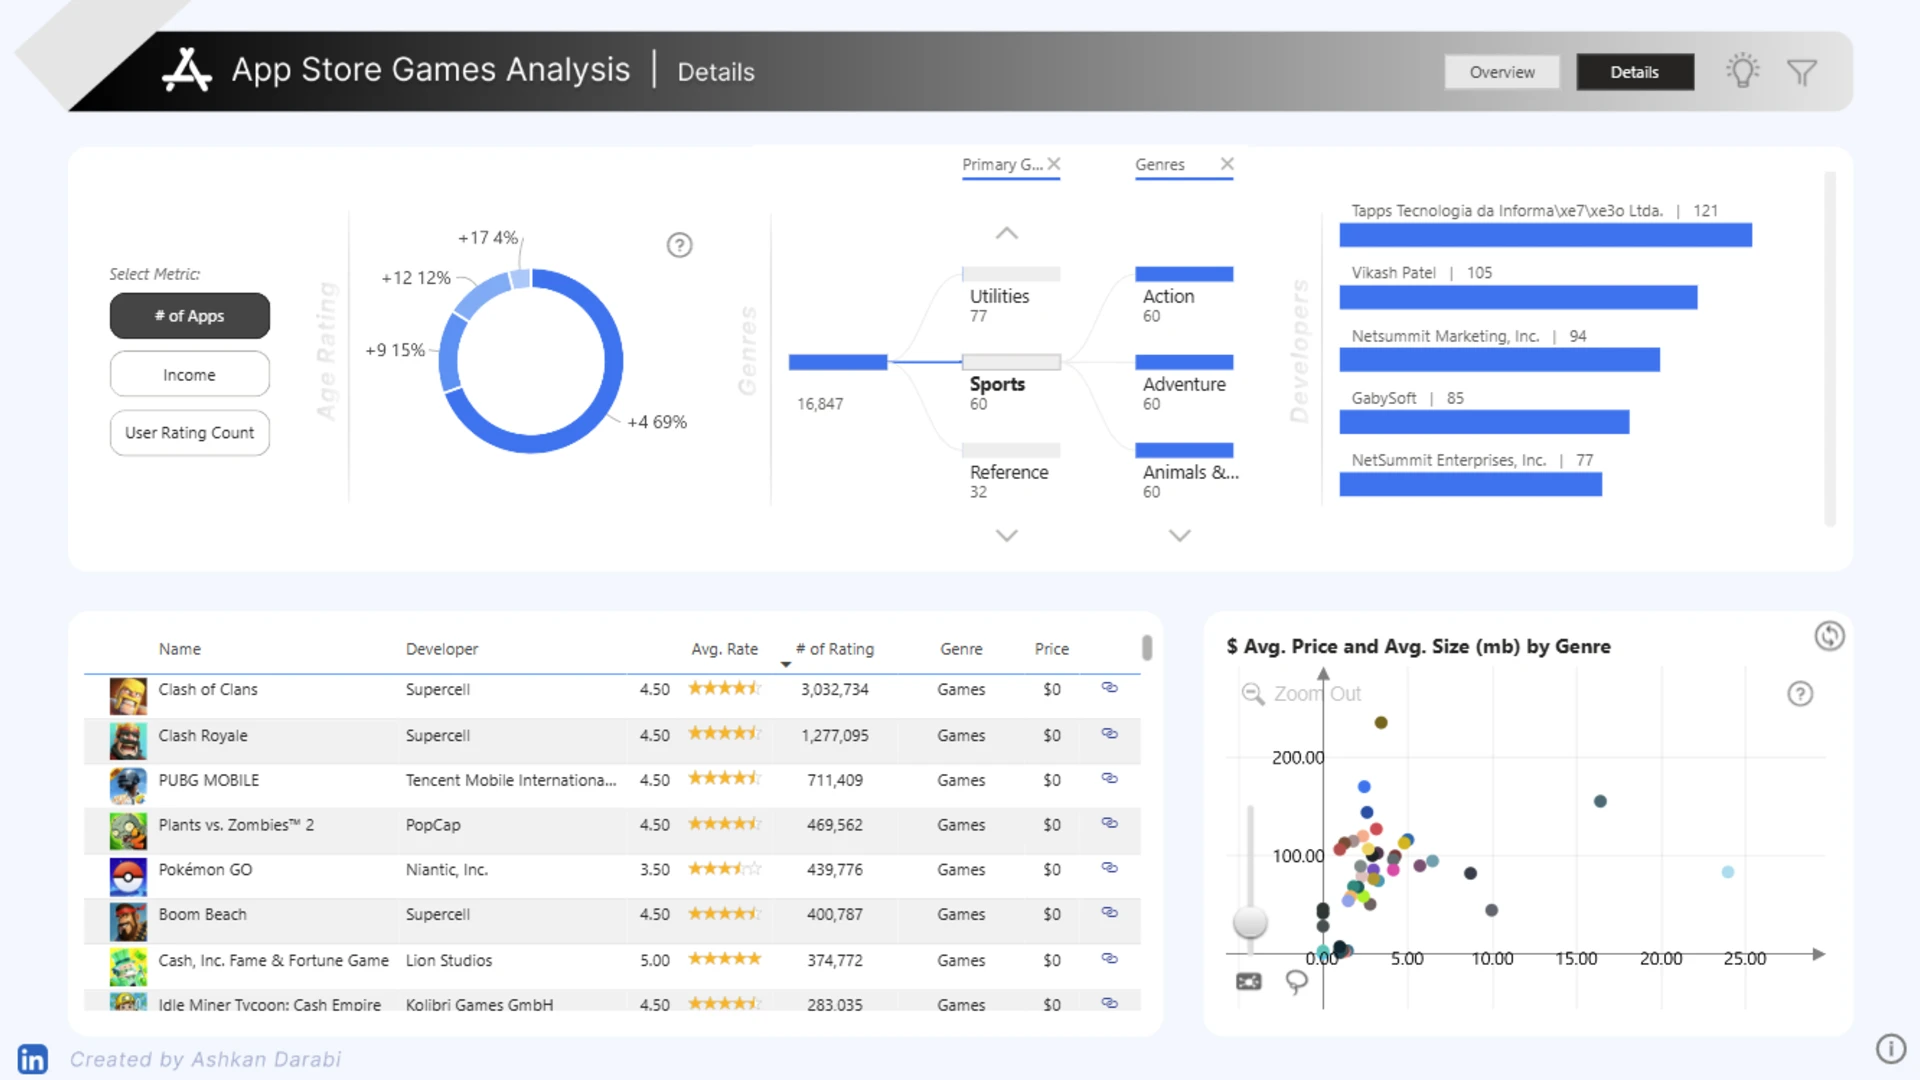
- App age rating distribution
- Developer comparison
- Average price and app size by genre
Each of these metrics can be filtered by selected metric, primary genre, genre, age rating, price type, year, and developer. Simply select data in the interactive visuals to cross-filter other charts and instantly reveal deeper insights into App Store game performance.
The report features a combination of ZoomCharts visuals, KPI cards, donut charts, bar charts, trend analysis, scatter charts, hierarchy visuals, and native Power BI table and filter elements.
The report is based on the original submission by Ashkan Darabi with minor refinements by the ZoomCharts team.
Download this template
Download this report to explore the settings, formulas, calculations, and visual interactions. You can also adapt the report structure for your own app marketplace, gaming, product performance, or digital analytics datasets.


4U Report Challenges
Participate in data challenges, build and submit reports to get free template downloads.
Join CommunityMobile view allows you to interact with the report. To Download the template please switch to desktop view.
How to use a PBIX template
Preview the interactive report, download the PBIX file, open it in Power BI Desktop, and replace the same data connection with your own dataset.
Preview and download
Explore the report online and download the PBIX template file.
Open in Power BI Desktop
Open the downloaded PBIX file in Power BI Desktop.
Connect your data
Replace the sample data source with your own dataset.
Refresh and adjust
Refresh the model and update fields or visual were needed.
Save and share
Save your report and publish it for your audience.


