886
App Analysis
App Analysis
Report Author: Eniola Adekoya
886
Share template with others
Report submitted for FP20 Analytics ZoomCharts Challenge 18 (August 2024). The report was built with the Mobile Game Analysis dataset and includes ZoomCharts custom Drill Down PRO visuals for Power BI.
Author's description:
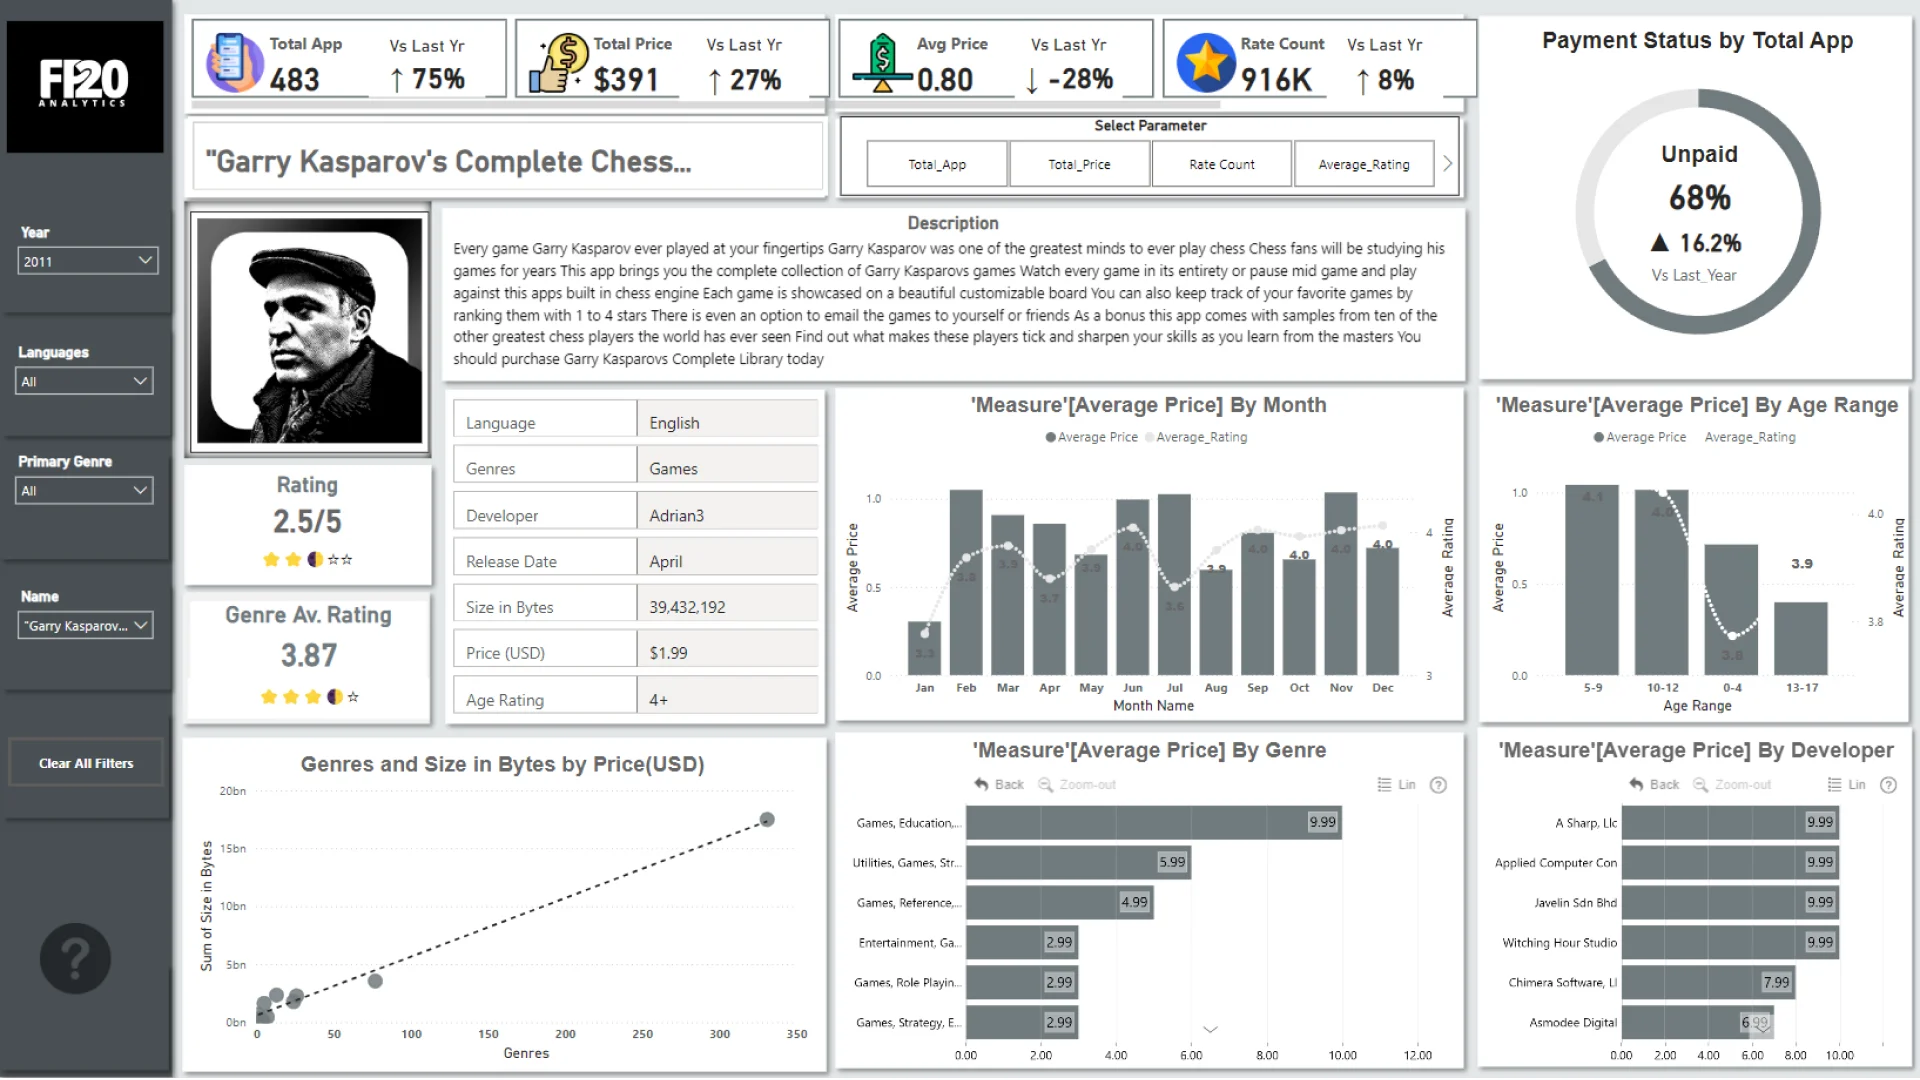
Some Key Insight and Actions : A significant portion of the apps (67%) is unpaid App, selected year (2011), with a 16.4% increase compared to last year. This indicates a need to address monetization or payment collection.
By Age Range: Younger users (ages 5-9) are associated with higher average prices, while other age ranges have lower average prices. There is a correlation between the size of the app and its price, with larger apps generally priced higher.
Price Optimization: Review the pricing strategies across different genres and developers to ensure competitive and optimized pricing. There may be opportunities to adjust prices based on genre popularity or developer reputation.
ZoomCharts visuals used

4U Report Challenges
Participate in data challenges, build and submit reports to get free template downloads.
Join CommunityMobile view allows you to interact with the report. To Download the template please switch to desktop view.
How to use a PBIX template
Preview the interactive report, download the PBIX file, open it in Power BI Desktop, and replace the same data connection with your own dataset.
Preview and download
Explore the report online and download the PBIX template file.
Open in Power BI Desktop
Open the downloaded PBIX file in Power BI Desktop.
Connect your data
Replace the sample data source with your own dataset.
Refresh and adjust
Refresh the model and update fields or visual were needed.
Save and share
Save your report and publish it for your audience.


