712
Animal Shelter Operations Analytics Report 5
Animal Shelter Operations Analytics Report 5
Report Author: Sherif Olalekan
712
Share template with others
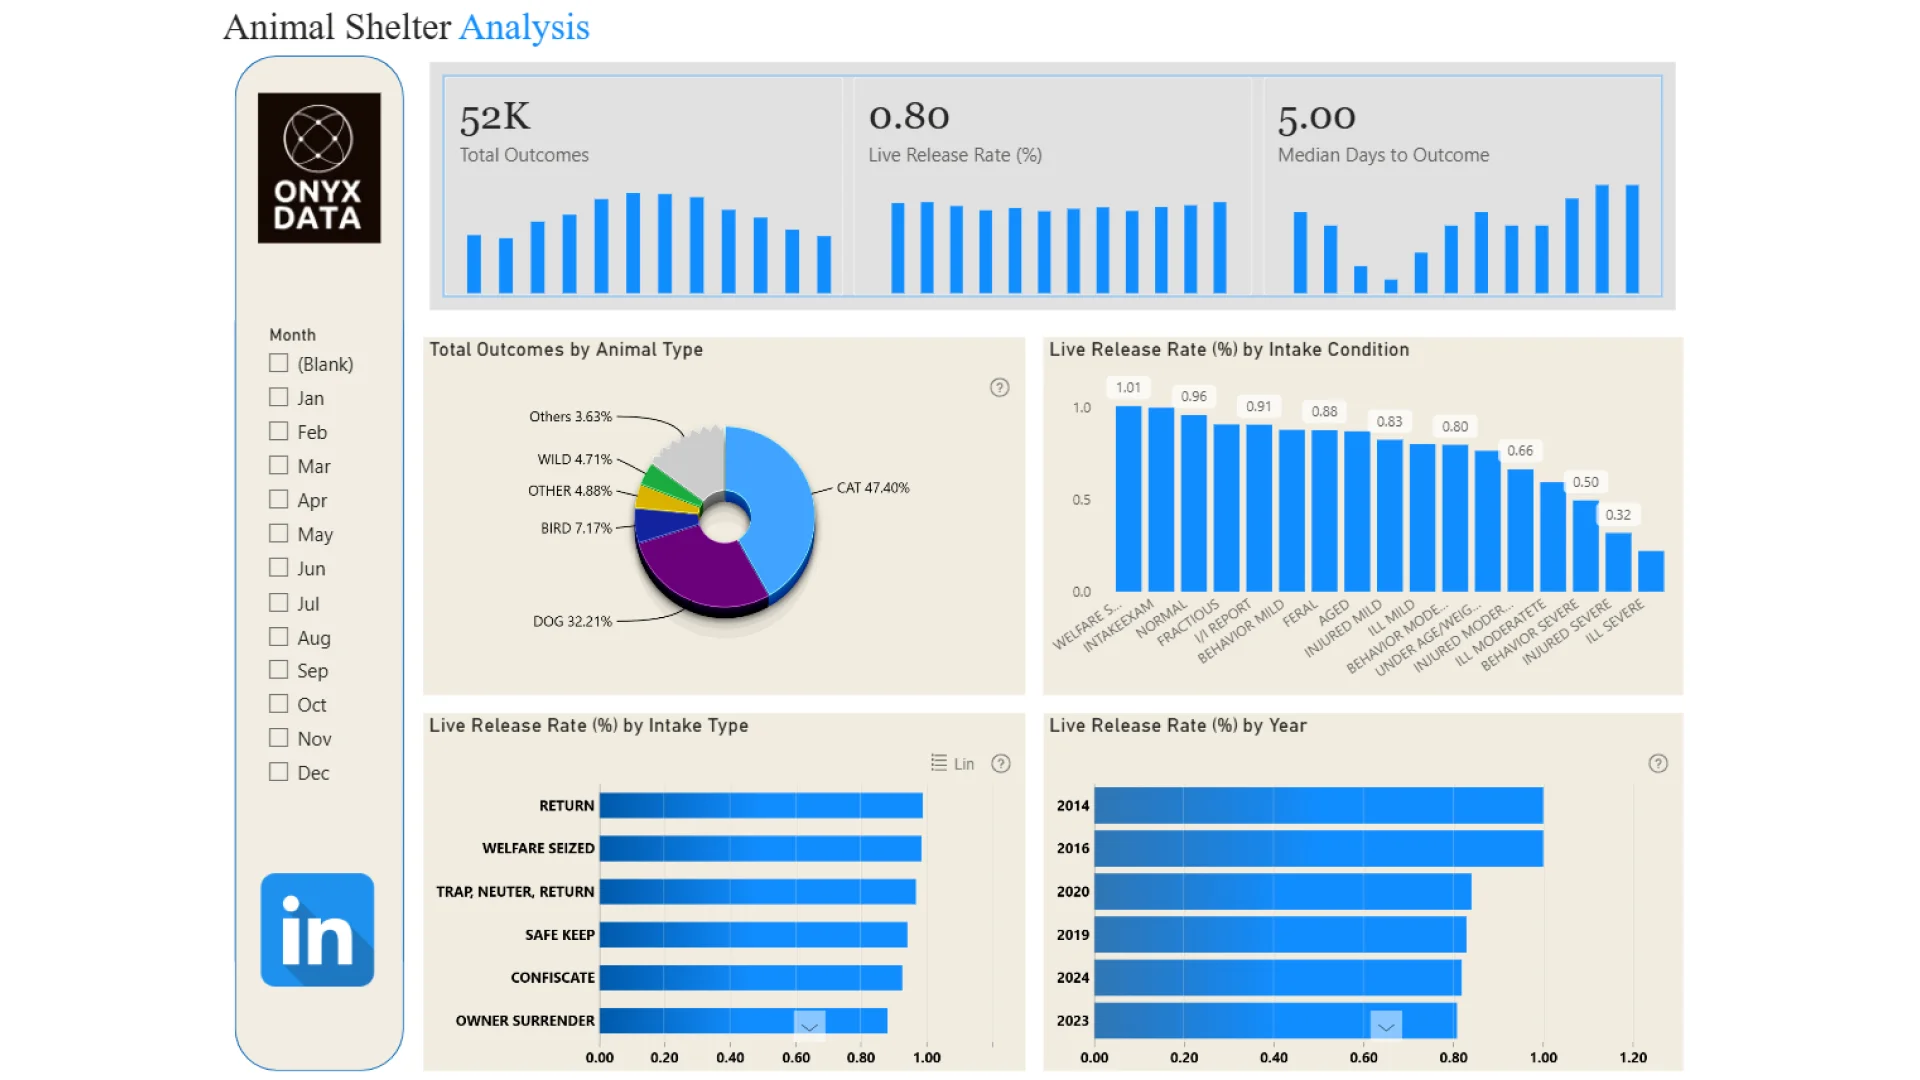
This Power BI report uses the Animal Shelter Operations dataset from a the City of Long Beach Animal Care Services, US. The report features ZoomCharts Drill Down PRO custom visuals for Power BI. It was submitted to the Onyx Data DataDNA ZoomCharts Mini Challenge in December 2025.
Author's Description:
This project visualizes and analyzes an animal shelter dataset using Power BI, highlighting key trends in animal intake, outcomes, health conditions, and overall shelter performance. The dashboard provides clear, actionable insights to support better decision-making, resource planning, and improved animal welfare outcomes.
4U Report Challenges
Participate in data challenges, build and submit reports to get free template downloads.
Join CommunityMobile view allows you to interact with the report. To Download the template please switch to desktop view.


Was this helpful? Thank you for your feedback!
Sorry about that.
How can we improve it?