491
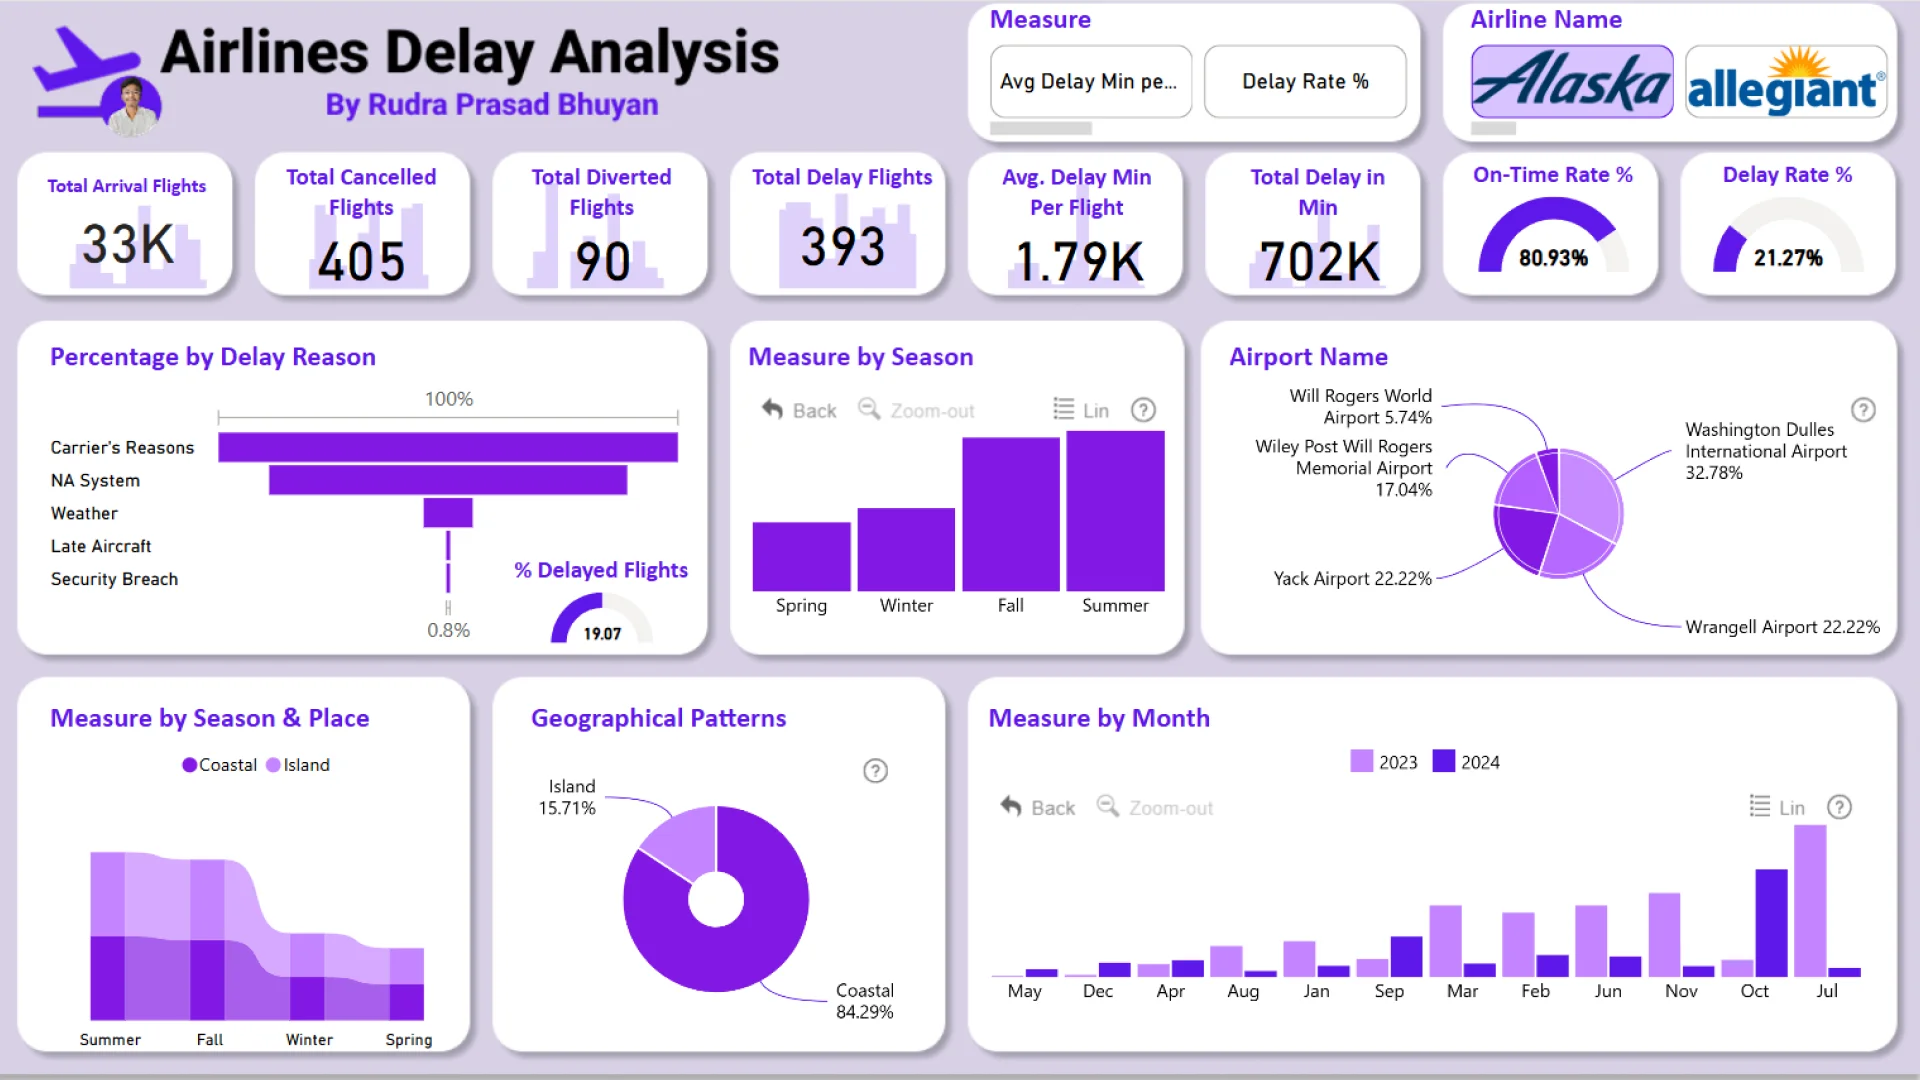
Airline Delay Mapping and Timeline Dashboard
Airline Delay Mapping and Timeline Dashboard
Report Author: Rudra Prasad Bhuyan
491
Share template with others
This Airline Delay Mapping and Timeline Dashboard helps users explore flight delay data through geographic views, timeline analysis, and interactive drill-downs.
Report submitted for the FP20 Analytics ZoomCharts Challenge, January 2025. The report was built using the Airline Delays Dataset and includes ZoomCharts custom Drill Down PRO visuals for Power BI.
ZoomCharts visuals used
4U Report Challenges
Participate in data challenges, build and submit reports to get free template downloads.
Join CommunityMobile view allows you to interact with the report. To Download the template please switch to desktop view.


Was this helpful? Thank you for your feedback!
Sorry about that.
How can we improve it?