<div class="challenge-content-section">
<h2 class="h3 mb-4 pb-1">About FP20 Analytics Data Challenges</h2>
<p>FP20 Analytics group gathers passionate and inspiring data enthusiasts. The challenges group helps new data analysts practice, share, and create a portfolio. Join in and sharpen your skills together with this open and friendly data community.</p>
<p>Join the community on <a href="https://www.linkedin.com/groups/12751070/" target="_blank" rel="noopener">LinkedIn</a></p>
<p>Read more about the challenges on the <a href="https://fp20analytics.com/challenges" target="_blank" rel="noopener">FP20 Analytics website</a>.</p>
<p>Participate in the challenge to enrich your skill in creating excellent reports that help business users explore data quickly and intuitively.</p>
</div>
<div class="challenge-content-section">
<h2 class="h3 mb-4 pb-1">Timeline</h2>
<p>The challenge will run from 4th October 2023 at 15:00pm UK time and end on 3rd November 2023 at 23:59pm UK time. Winners will be announced on 9th November 2023.</p>
</div>
<div class="challenge-content-section">
<h2 class="h3 mb-4 pb-1">How to participate?</h2>
<ol>
<li>Register for the Challenge here and receive a Drill Down Visuals Developer License for Power BI.</li>
<li>Download the dataset on <a href="https://fp20analytics.com/challenges" target="_blank" rel="noopener">FP20 Analytics web page</a></li>
<li>Create a Power BI report including at least 2 ZoomCharts Drill Down Visuals!</li>
<li>Submit your entry here to be verified. <br />
<div class="note">(If your submission doesn’t match the challenge criteria, you will be notified by email, so make sure you will have time for revision and resubmission if needed. Feel free to resubmit entry as many times as necessary before the deadline)</div>
</li>
<li>Upload your publish to web link on NovyPro.
<div class="note-block">
<p>Note: If you opt to post your report on NovyPro, for instructions on how to do this, refer to the provided video link. </p>
NovyPro: <a href="https://www.novypro.com/" target="_blank" rel="noopener">https://www.novypro.com/</a><br />Instruction Video: <a href="https://www.youtube.com/watch?v=jkcAYgFGWUY" target="_blank" rel="noopener">https://www.youtube.com/watch?v=jkcAYgFGWUY</a> </div>
</li>
<li>Post your submission on LinkedIn:
<ul>
<li>Upload the report as a PDF document on your LinkedIn feed.</li>
<li>Use the caption, "I am participating in FP20 Analytics Challenge 10”, along with screenshots from your report.</li>
<li>Include a brief summary about your report's key insights and publish to web or NovyPro link.</li>
<li>Use the hashtags #FP20Analytics, #FP20AnalyticsRetailSupplyChainandSales #builtwithzoomcharts, tag @Federico Pastor and @Zoomcharts.</li>
<li>Additionally, post your report in the FP20 Analytics LinkedIn Community Group.</li>
</ul>
</li>
<li>Follow <a href="https://www.linkedin.com/company/zoomcharts/" target="blank">ZoomCharts on LinkedIn</a></li>
</ol>
</div>
<h2 class="chapter-title">The Brief</h2>
<div class="challenge-content-section">
<h2 class="h3 mb-4 pb-1">Report Insights</h2>
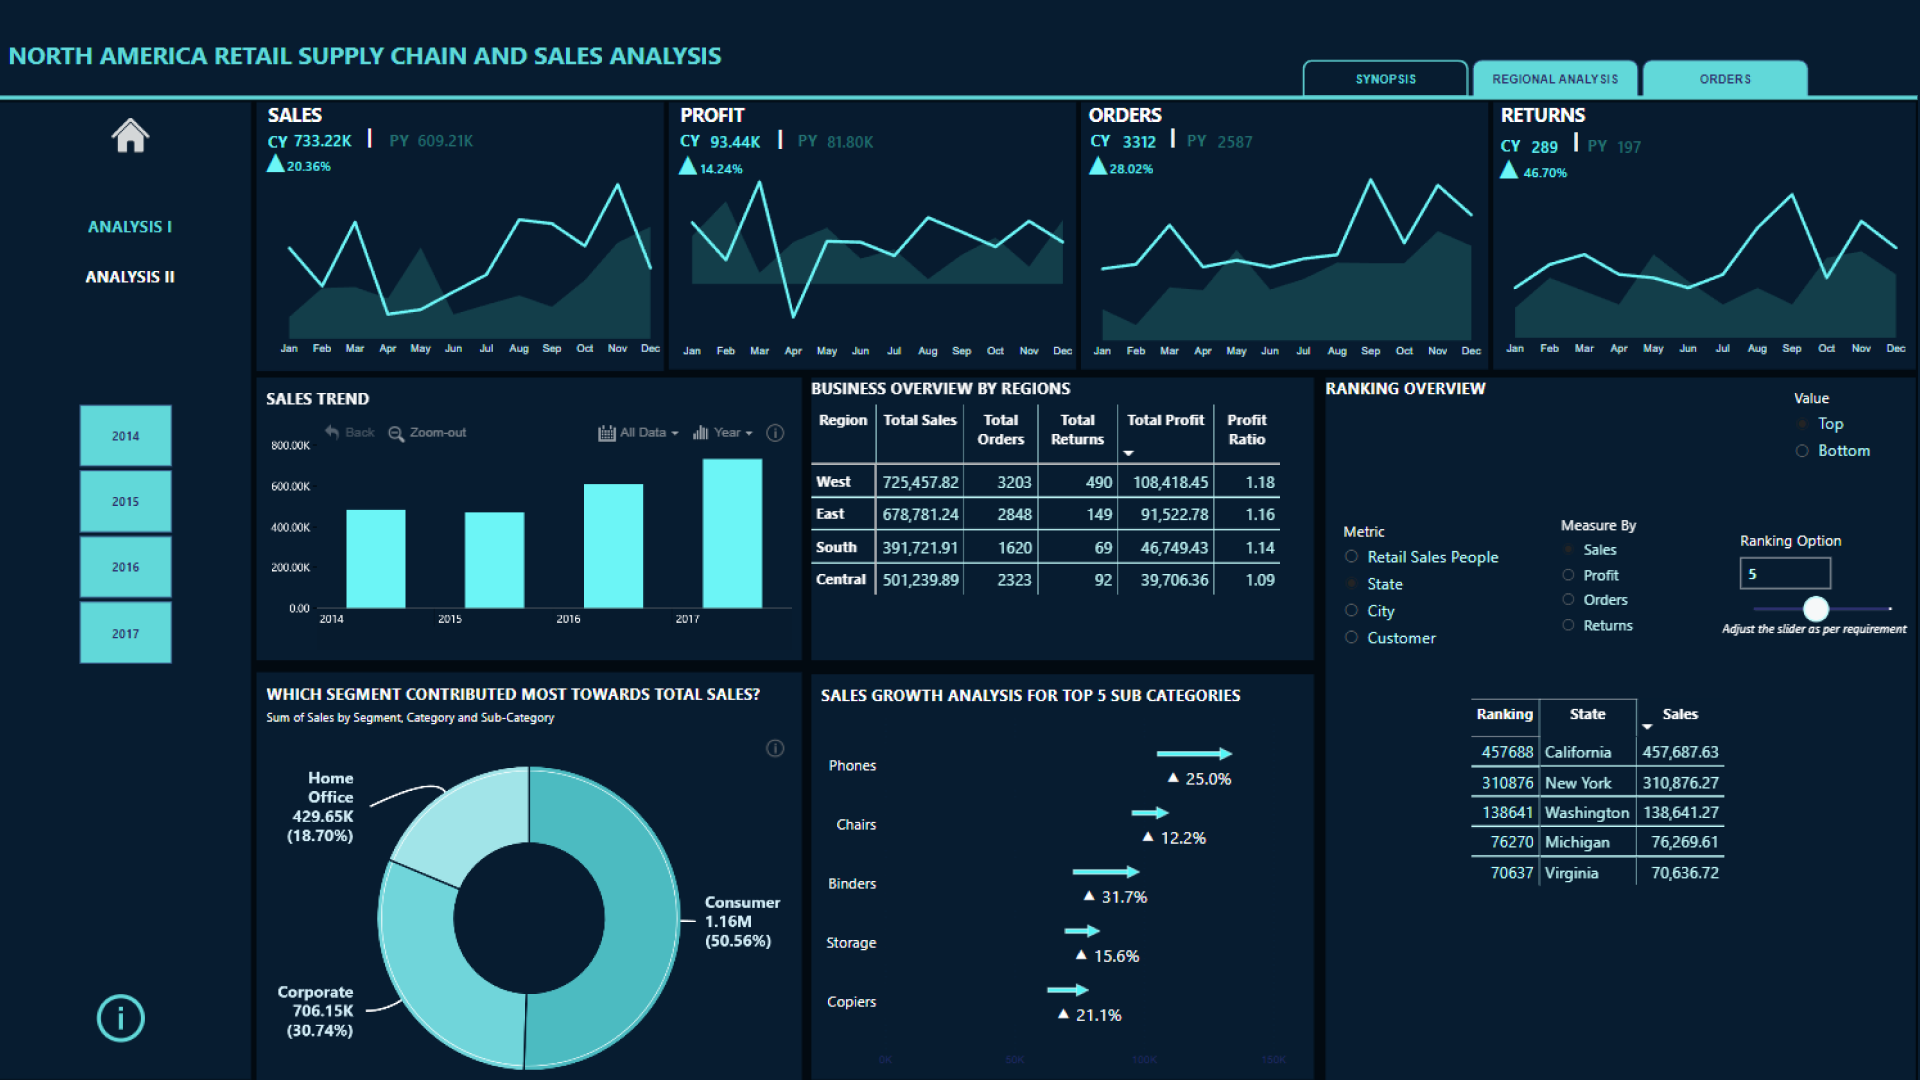
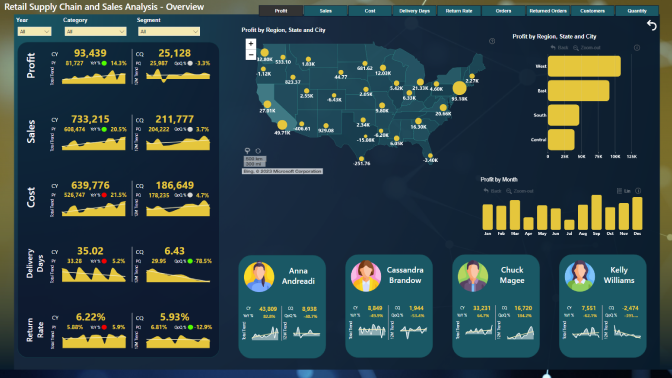
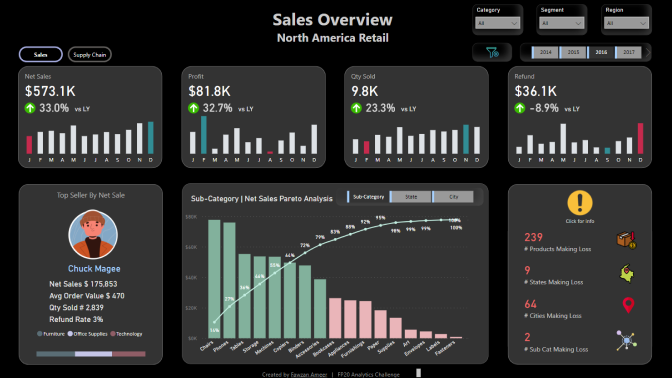
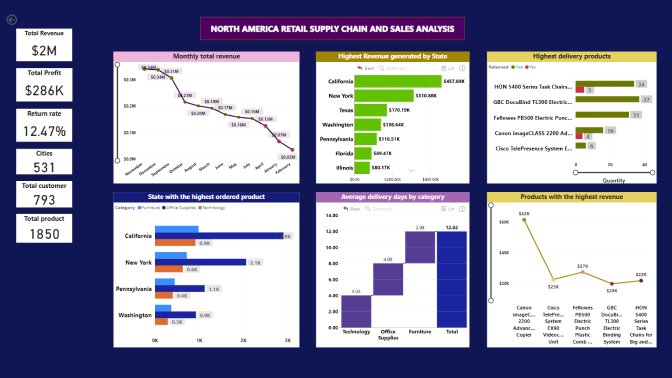
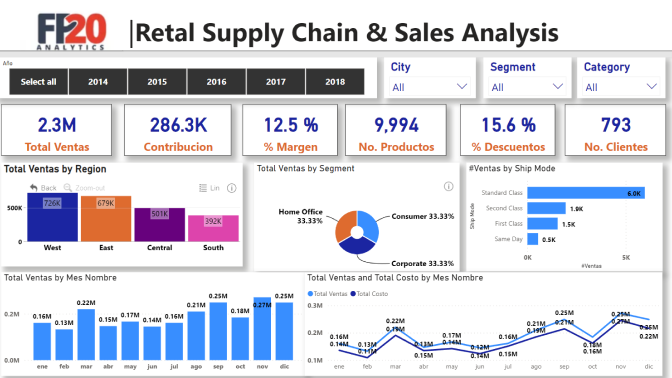
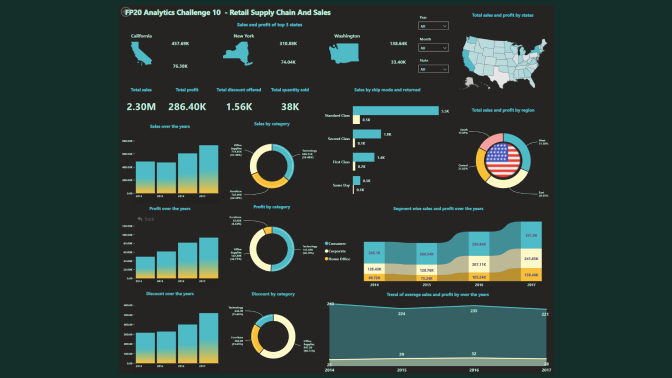
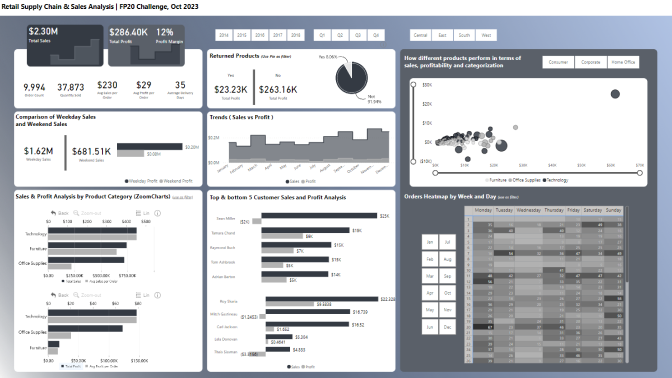
<p>As part of the FP20 Analytics Challenge 10, participants will gain access to a comprehensive dataset focusing on Retail Supply Chain and Sales for a specified company. </p>
<p>The challenge tasks you to dissect key performance indicators, including loss revenue transactions, extended delivery timelines, and return rates, among other metrics. Your insights will be instrumental in shaping a robust retail logistics strategy, geared towards achieving operational sustainability while meeting customer expectations for swift and cost-effective delivery. </p>
<p>Create a report allows end-users to find answers to the following questions: </p>
<ol>
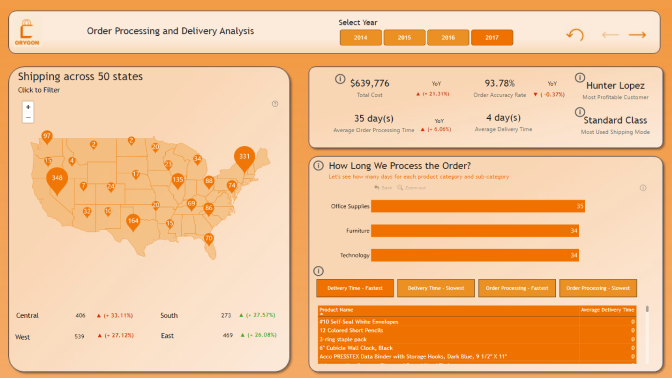
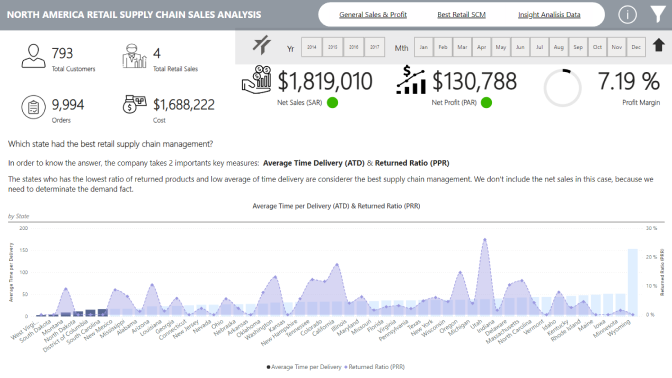
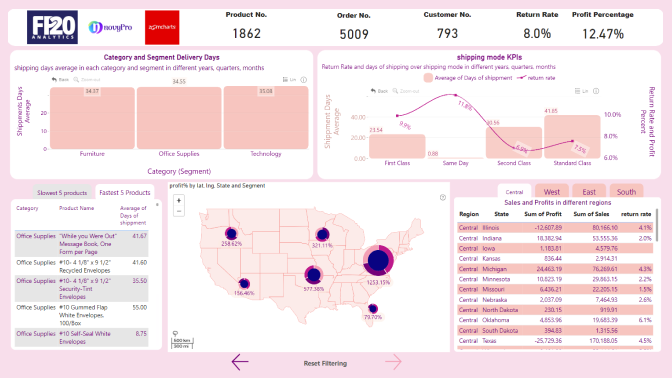
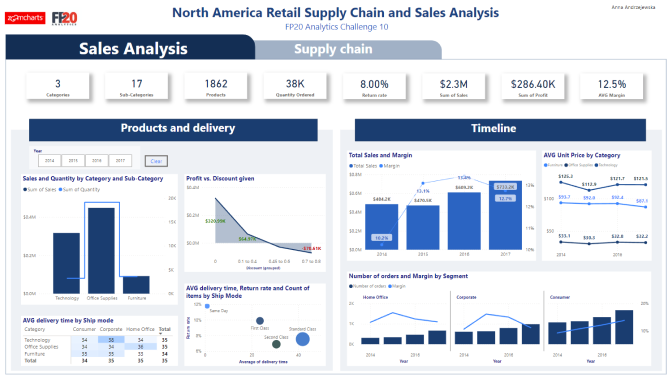
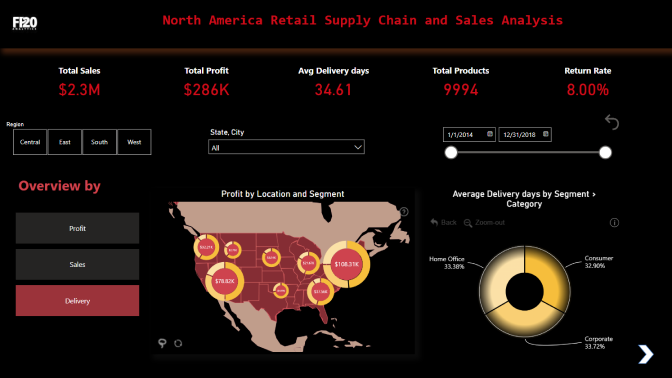
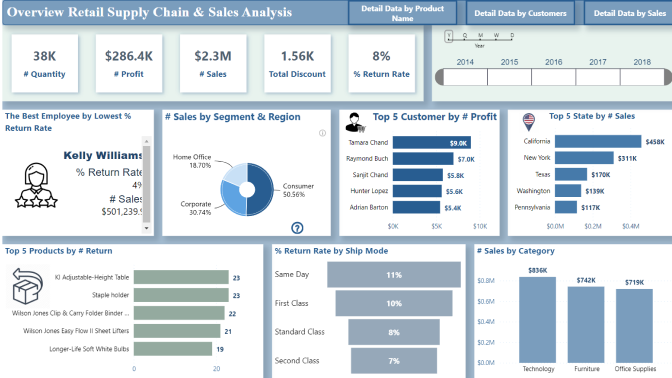
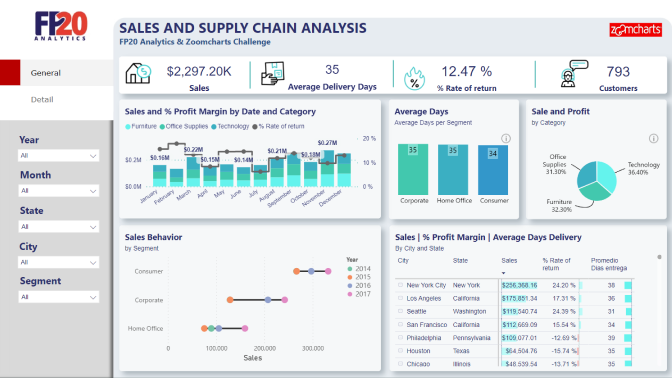
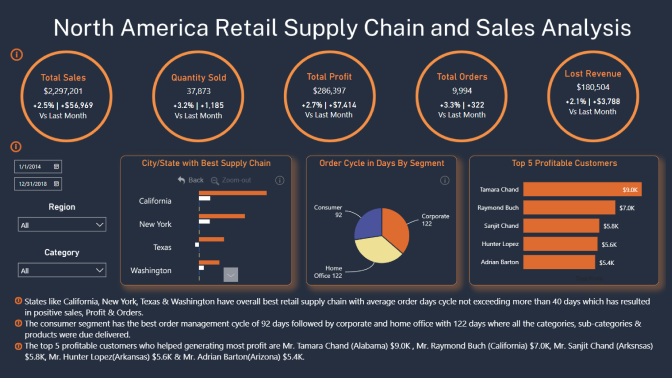
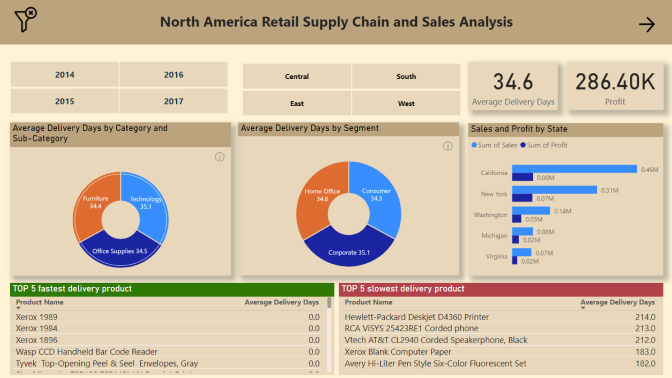
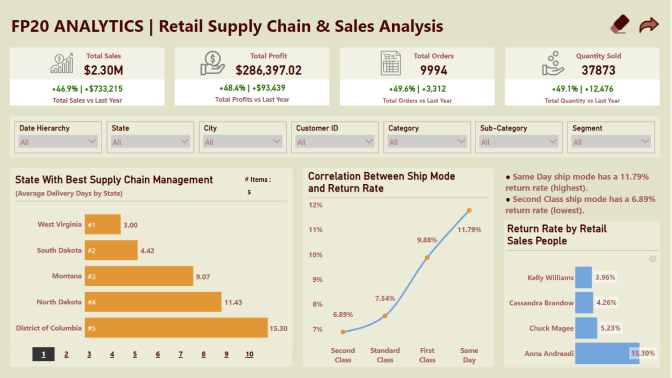
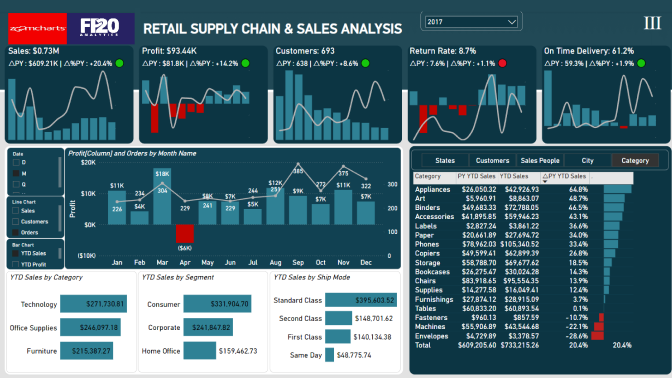
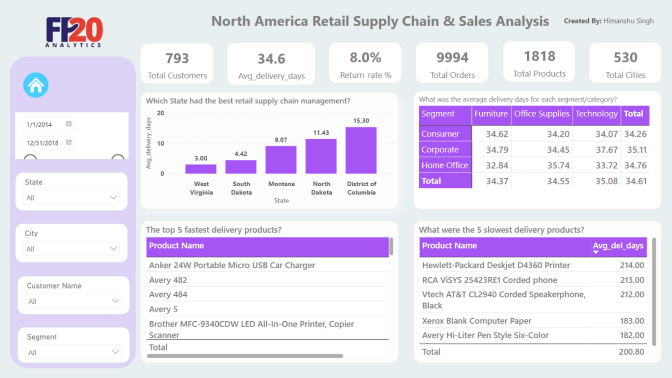
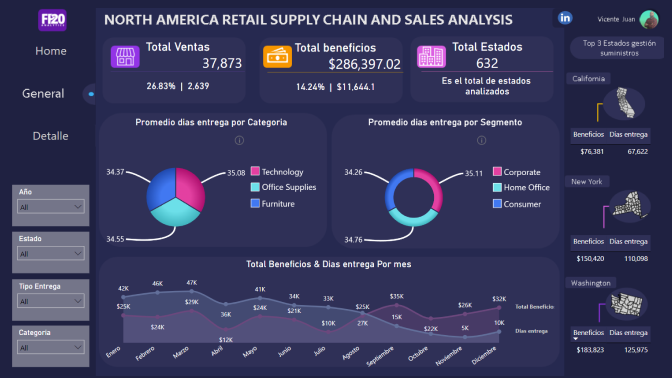
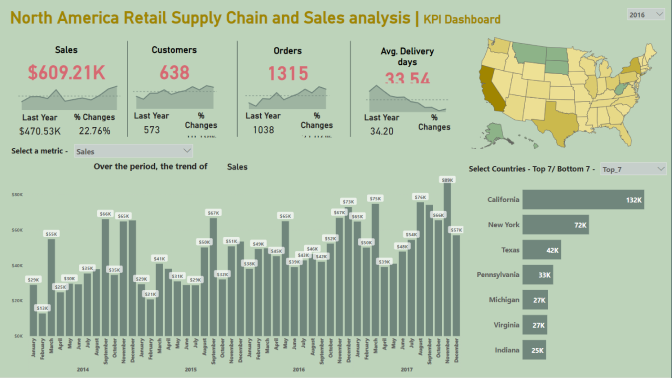
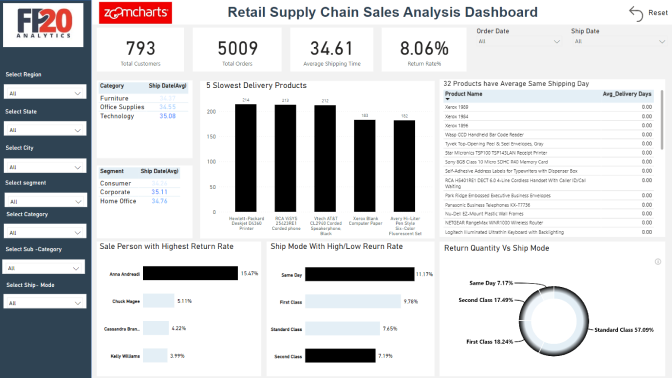
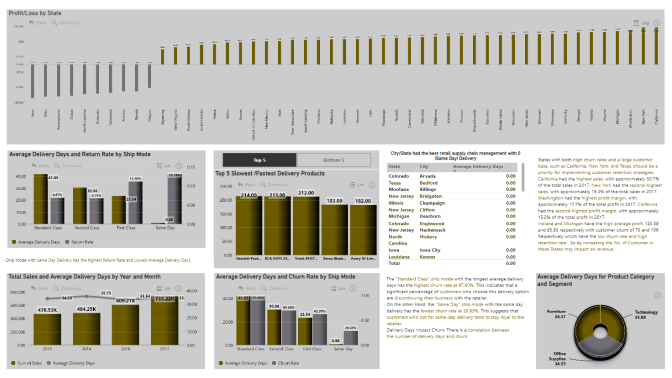
<li>Which City/State had the best retail supply chain management? </li>
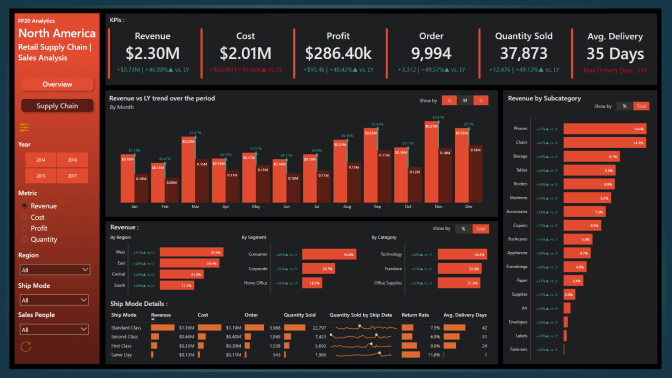
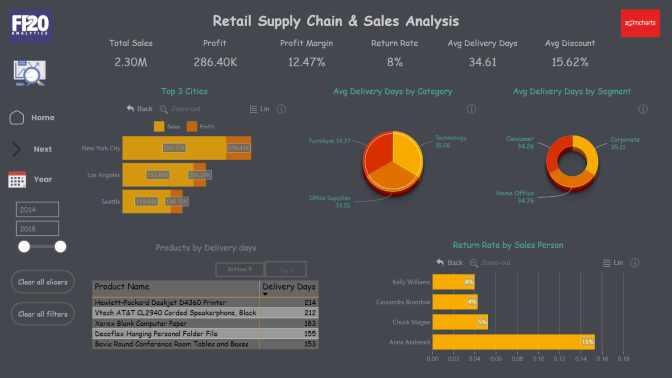
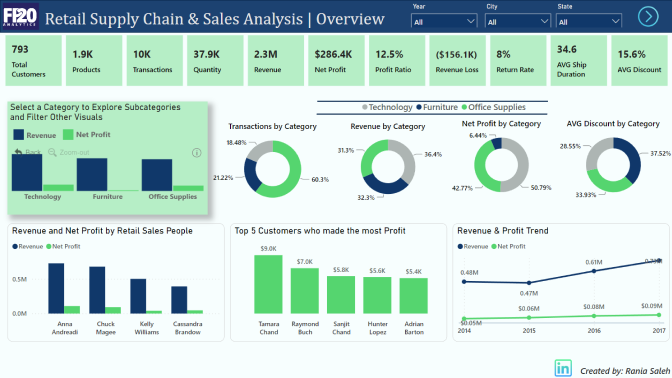
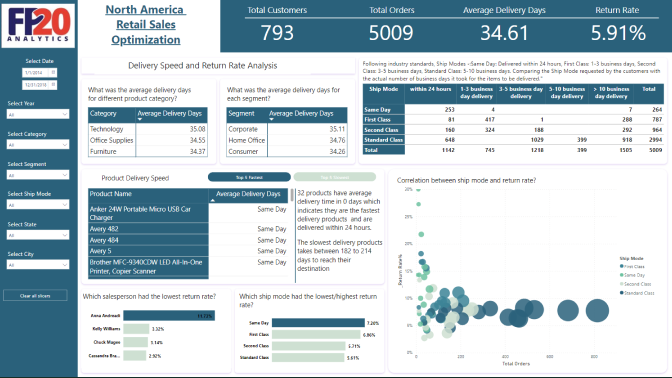
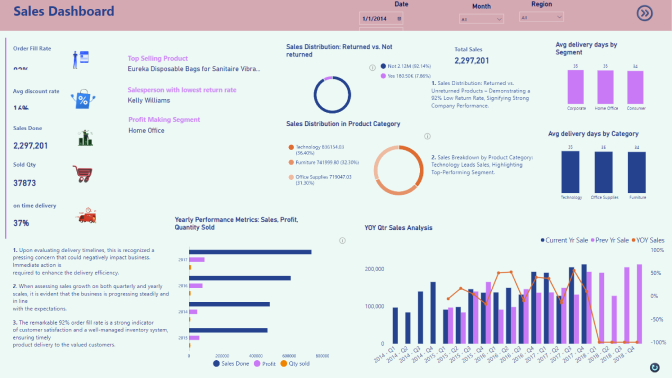
<li>What was the average delivery days for different product category? </li>
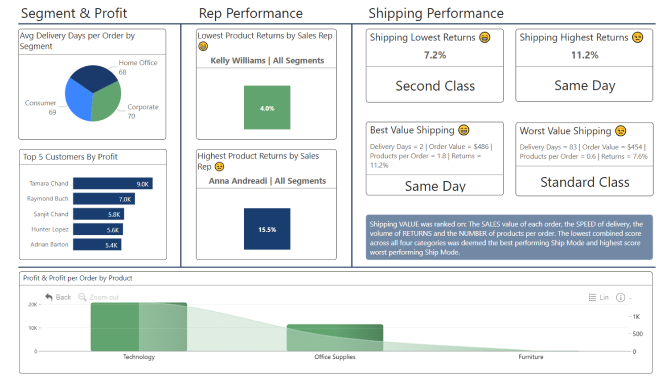
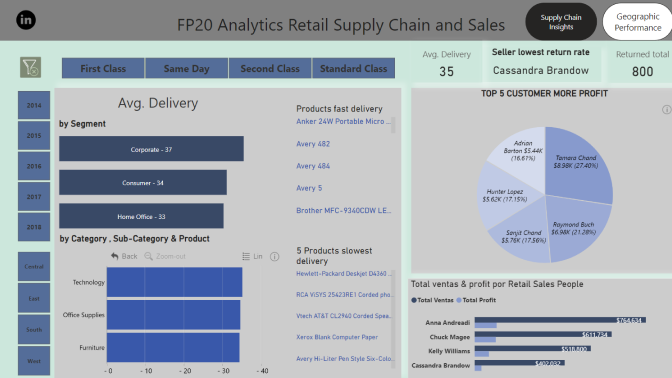
<li>What was the average delivery days for each segment? </li>
<li>What were the 5 fastest delivery products? </li>
<li>What were the 5 slowest delivery products? </li>
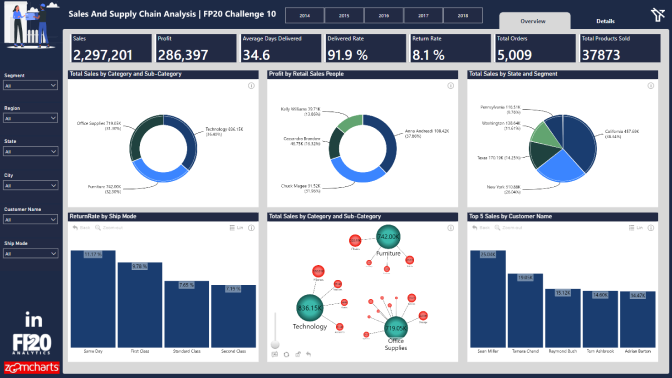
<li>Which salesperson had the lowest return rate? </li>
<li>Can we find the correlation between ship mode and return rate? </li>
<li>Which ship mode had the lowest/highest return rate? </li>
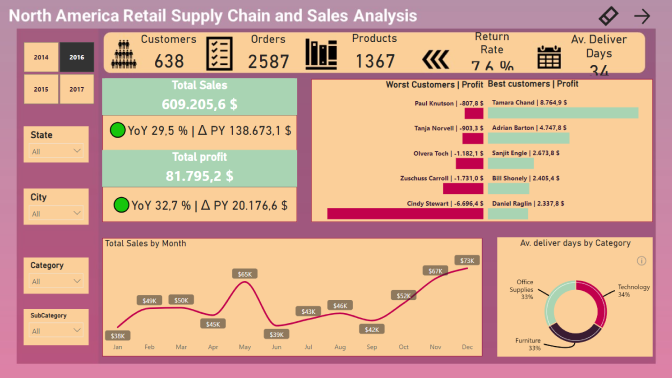
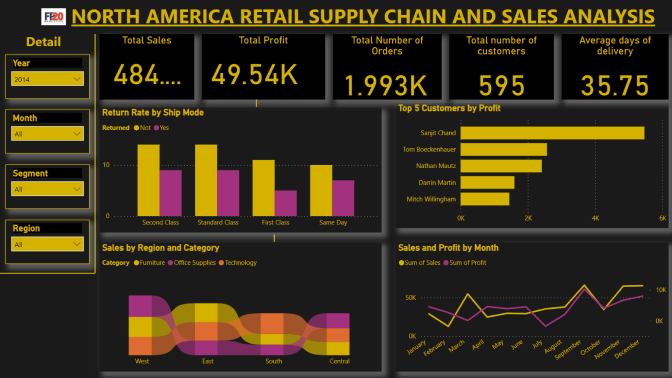
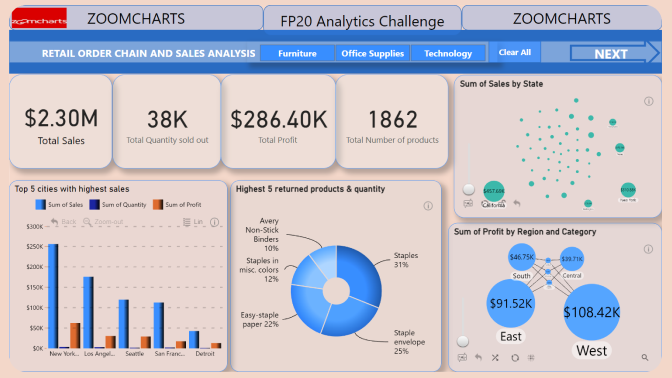
<li>Which top 5 customers made the most profit? </li>
<li>Feel free to provide more insights around Supply Chain, Geography, Product and Sales. </li>
</ol>
</div>
<div class="challenge-content-section">
<h2 class="h3 mb-4 pb-1">Reports Technical requirements:</h2>
<ul>
<li>Reports are restricted to a maximum of two pages. </li>
<li>Canvas size is 16:9 (Default Power BI Size) or Full HD size = w:1920 - h:1080. </li>
<li>Create a Power BI report including at least 2 ZoomCharts Drill Down Visuals </li>
<li>Reports will be presented for this challenge only in Power BI.</li>
</ul>
</div>
<div class="challenge-content-section">
<h2 class="h3 mb-4 pb-1">Reports Judging Criteria</h2>
<p>Business users use reports to make data-driven decisions. That’s why reports are called effective if they enable users to drill down and filter data quickly and intuitively to find answers to any question they might have and analyse data in all possible directions and dimensions. We will evaluate: </p>
<ol>
<li>How easy is it to understand the data? (max 10 points)
<ul>
<li>Is too much text used for explanation? </li>
<li>Are the indicative colors in charts instinctually understandable? </li>
<li>Does it tell a story? </li>
</ul>
</li>
<li>How easy-to-use is the report? (max 14 points)
<ul>
<li>Cross-chart filtering implementation across the report. Can other visuals provide relevant data as the user explores the report? </li>
<li>Response time </li>
<li>Drill Down: multi-layer data exploration. Can the user drill down and gain additional insights within the report? </li>
<li>Use of tutorial overlays and other elements to assist new users. Can a new user start using this report straight away with just the guidance provided within the report itself? </li>
</ul>
</li>
<li>How good is the report design and is it suitable for its purpose? (max 10 points)
<ul>
<li>Visual design: is the overall look consistent, no empty spaces, no overcrowding? </li>
<li>Interface design: are there unnecessary visualisations/buttons/complexity in use? </li>
<li>UX design: is the produced report usable? </li>
<li>Report design: is the main challenge answered? </li>
<li>Technical: are all the fonts used the same, are the sizes readable? </li>
</ul>
</li>
</ol>
<p>You are encouraged to use various techniques at your disposal, such as tooltips, drill-throughs, drill-downs, cross-chart filtering and page navigation features, to enhance your analysis. </p>
<p> </p>
<h2><strong>Get Inspired!</strong></h2>
<p>To offer valuable support to our challengers, we invite you to participate in the following events:</p>
<ul>
<li><a href="https://zoomcharts.com/en/microsoft-power-bi-custom-visuals/webinars/zoomcharts-presentation-for-fp20-analytics" target="_blank" rel="noopener">ZoomCharts Presentation</a>: Learn more about ZoomCharts and follow step-by-step instructions for signing up for the FP20 Analytics Challenge.</li>
<li><a href="https://zoomcharts.com/en/microsoft-power-bi-custom-visuals/webinars/mastering-power-bi-market-demands-and-insights" target="_blank" rel="noopener">Webinar: Mastering Power BI - Market Demands and Insights</a>: Join industry experts in an insightful webinar where they will explore the realm of Power BI reporting from various angles. Discover what makes a Power BI report truly effective, what organizations are seeking, and the strategies to elevate your Power BI skills.</li>
</ul>
<p style="padding-left: 40px;">Join us for North America Retail Supply Chain and Sales Analysis Workshops:</p>
<ul>
<li><a href="https://zoomcharts.com/en/microsoft-power-bi-custom-visuals/webinars/tackling-fp20-analytics-challenge-10-with-zoomcharts-part-1" target="_blank" rel="noopener">Tackling FP20 Analytics Challenge 10 with ZoomCharts (Part 1)</a></li>
<li><a href="https://zoomcharts.com/en/microsoft-power-bi-custom-visuals/webinars/tackling-fp20-analytics-challenge-10-with-zoomcharts-part-2" target="_blank" rel="noopener">Tackling FP20 Analytics Challenge 10 with ZoomCharts (Part 2)</a></li>
</ul>
<p> </p>
<p> </p>
</div>