Feel free to leave your vote:
1
Share template with others
Summary
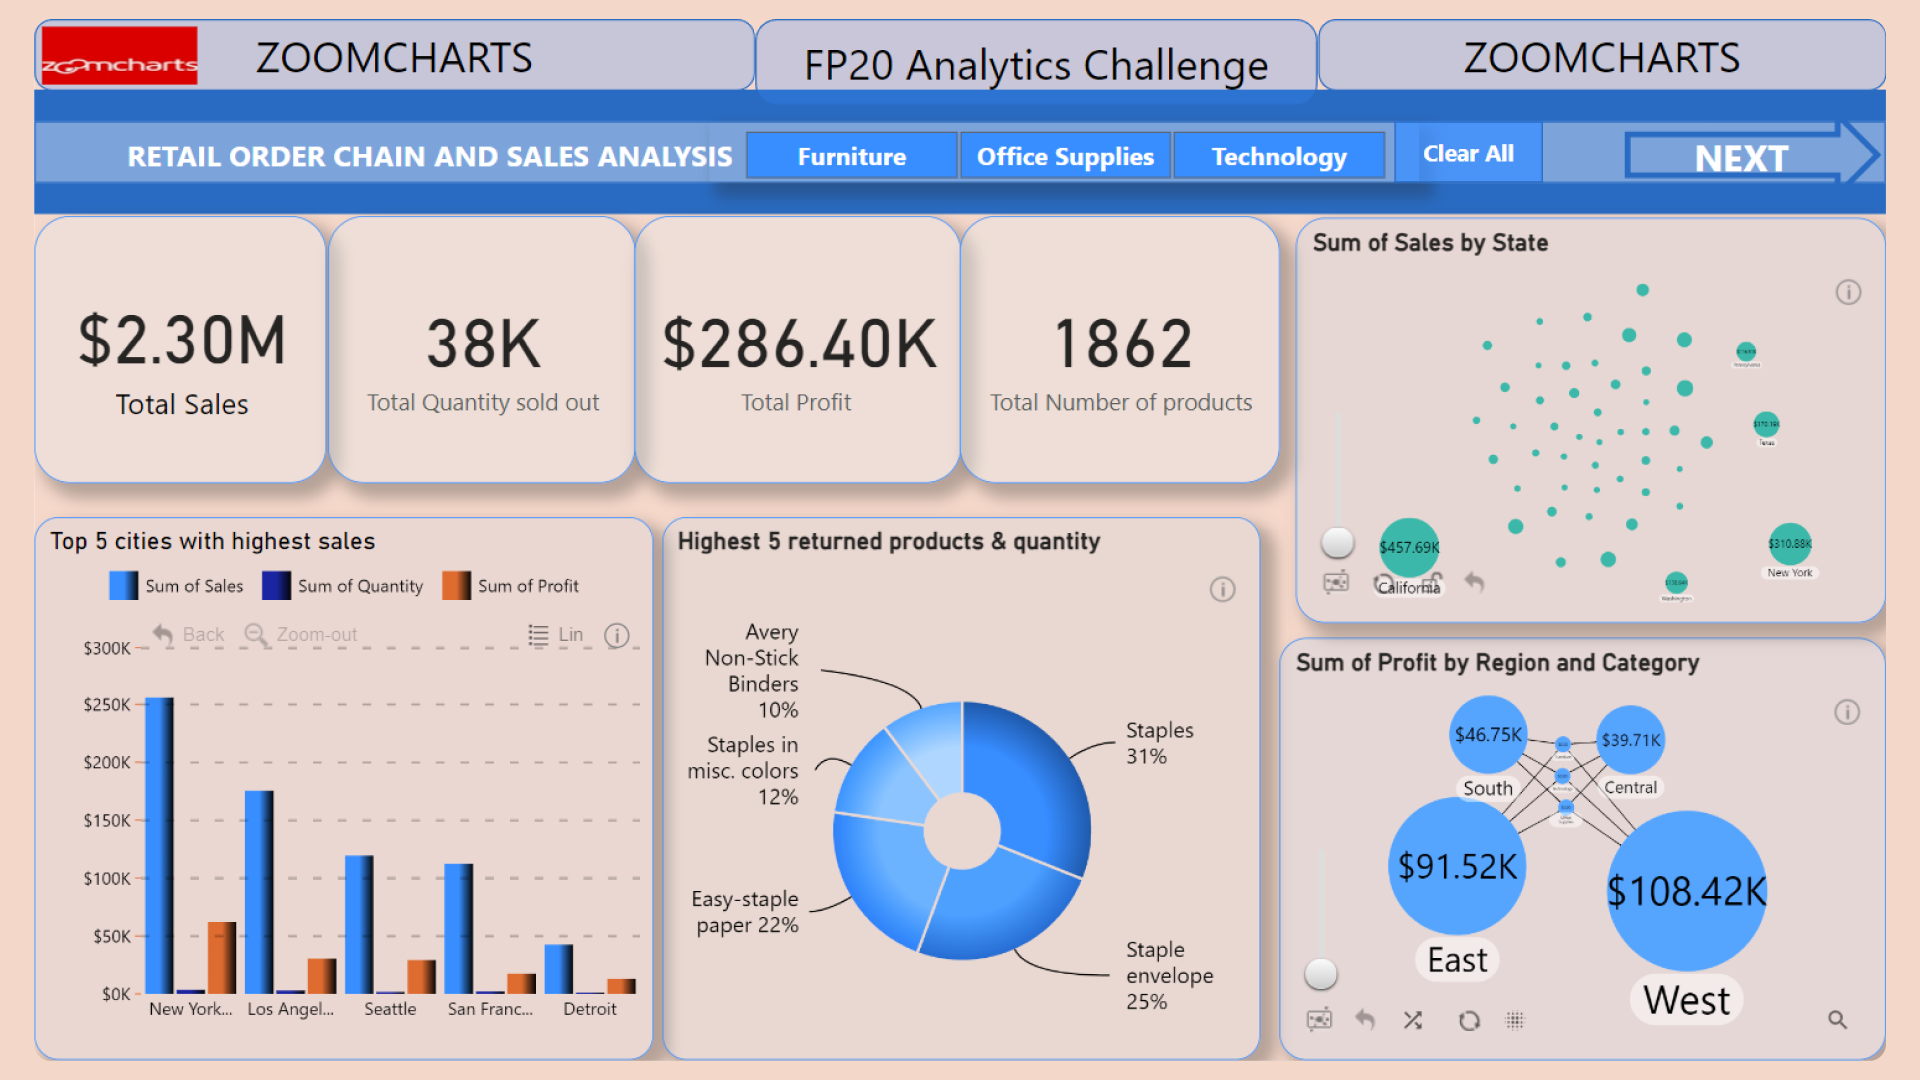
Report submitted for FP20 Analytics ZoomCharts Challenge, October 2023. The report was built with North America Retail Supply Chain and Sales Analysis dataset and includes ZoomCharts custom Drill Down PRO visuals for Power BI.
Author's description:
Dashboard contains analysis of the sales records across all regions, cities, products, product categories and sub-categories, to give insight to business users and help them make better business decisions.
Mobile view allows you to interact with the report. To Download the template please switch to desktop view.
