Feel free to leave your vote:
2
Share template with others
Summary
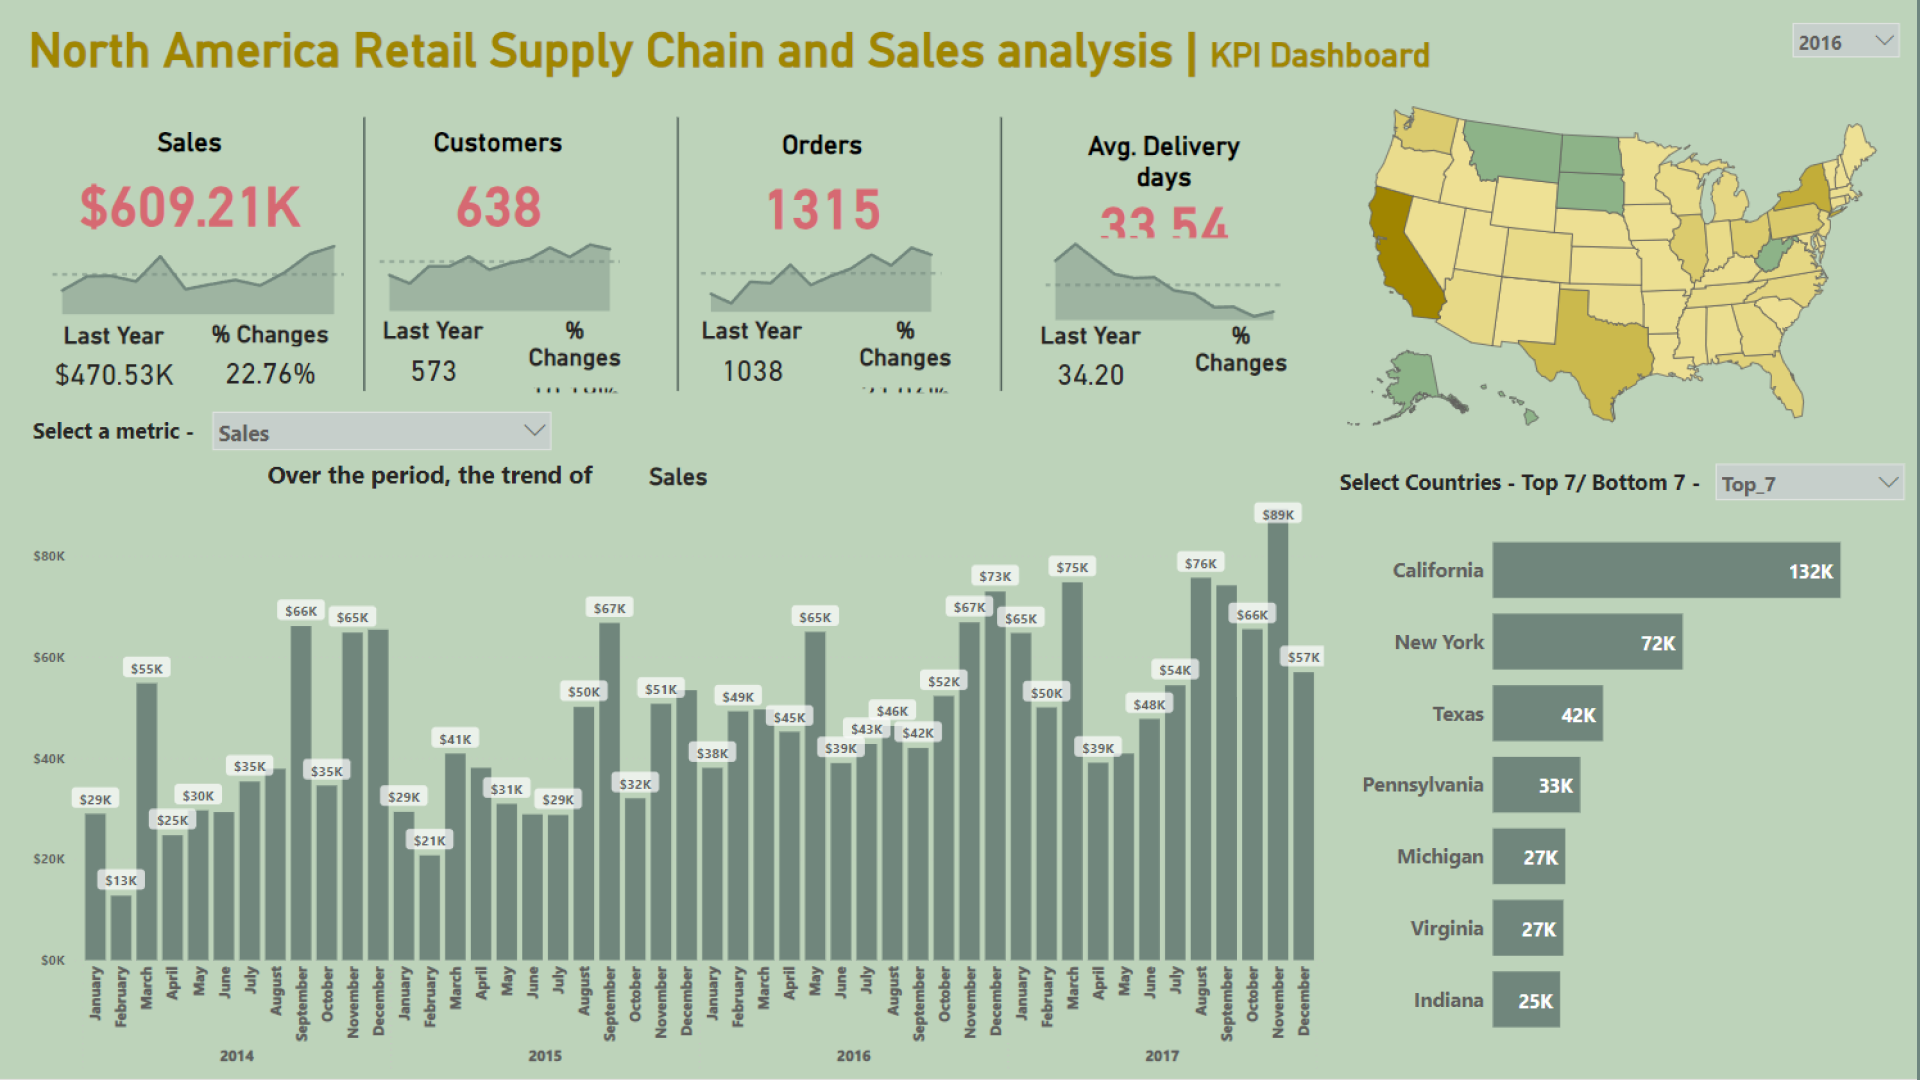
Report submitted for FP20 Analytics ZoomCharts Challenge, October 2023. The report was built with North America Retail Supply Chain and Sales Analysis dataset and includes ZoomCharts custom Drill Down PRO visuals for Power BI.
Author's description:
Through this Retail domain analysis, I was able to know the important KPIs that would affect the businesses. Retail dashboards are used to monitor inventory, margins, Supply costs, customers satisfaction scores & much more. 📖
Learnings made:
⏩ Firstly, through the ZoomCharts, I could learn its usage & implementation which helped me gain deeper insights easily.
⏩ Multiple Usage of the Card visual depicting a clear picture of the KPI.
⏩ Slicer across the Bar charts
🎯 Key Findings:
▶ California & New York were the top countries by Sales throughout 2014-17.
▶ Year – 2017 recorded the highest sales among all the years, while the sales were almost high in the second part of the year from September, also the delivery lead time is less which may lead to higher amount of orders.
▶ California & New York were the top countries by Sales throughout 2014-17.
▶ Anna Andreadi was the employee who made the highest amount of Sales.
▶ East & West regions of North America made the highest amount of sales in the technology category.
▶ California & New York were the top countries by Sales throughout 2014-17.
Mobile view allows you to interact with the report. To Download the template please switch to desktop view.