Feel free to leave your vote:
0
Share template with others
Summary
Report submitted for FP20 Analytics ZoomCharts Challenge, October 2023. The report was built with North America Retail Supply Chain and Sales Analysis dataset and includes ZoomCharts custom Drill Down PRO visuals for Power BI.
Author's description:
🔍 Project Highlights:
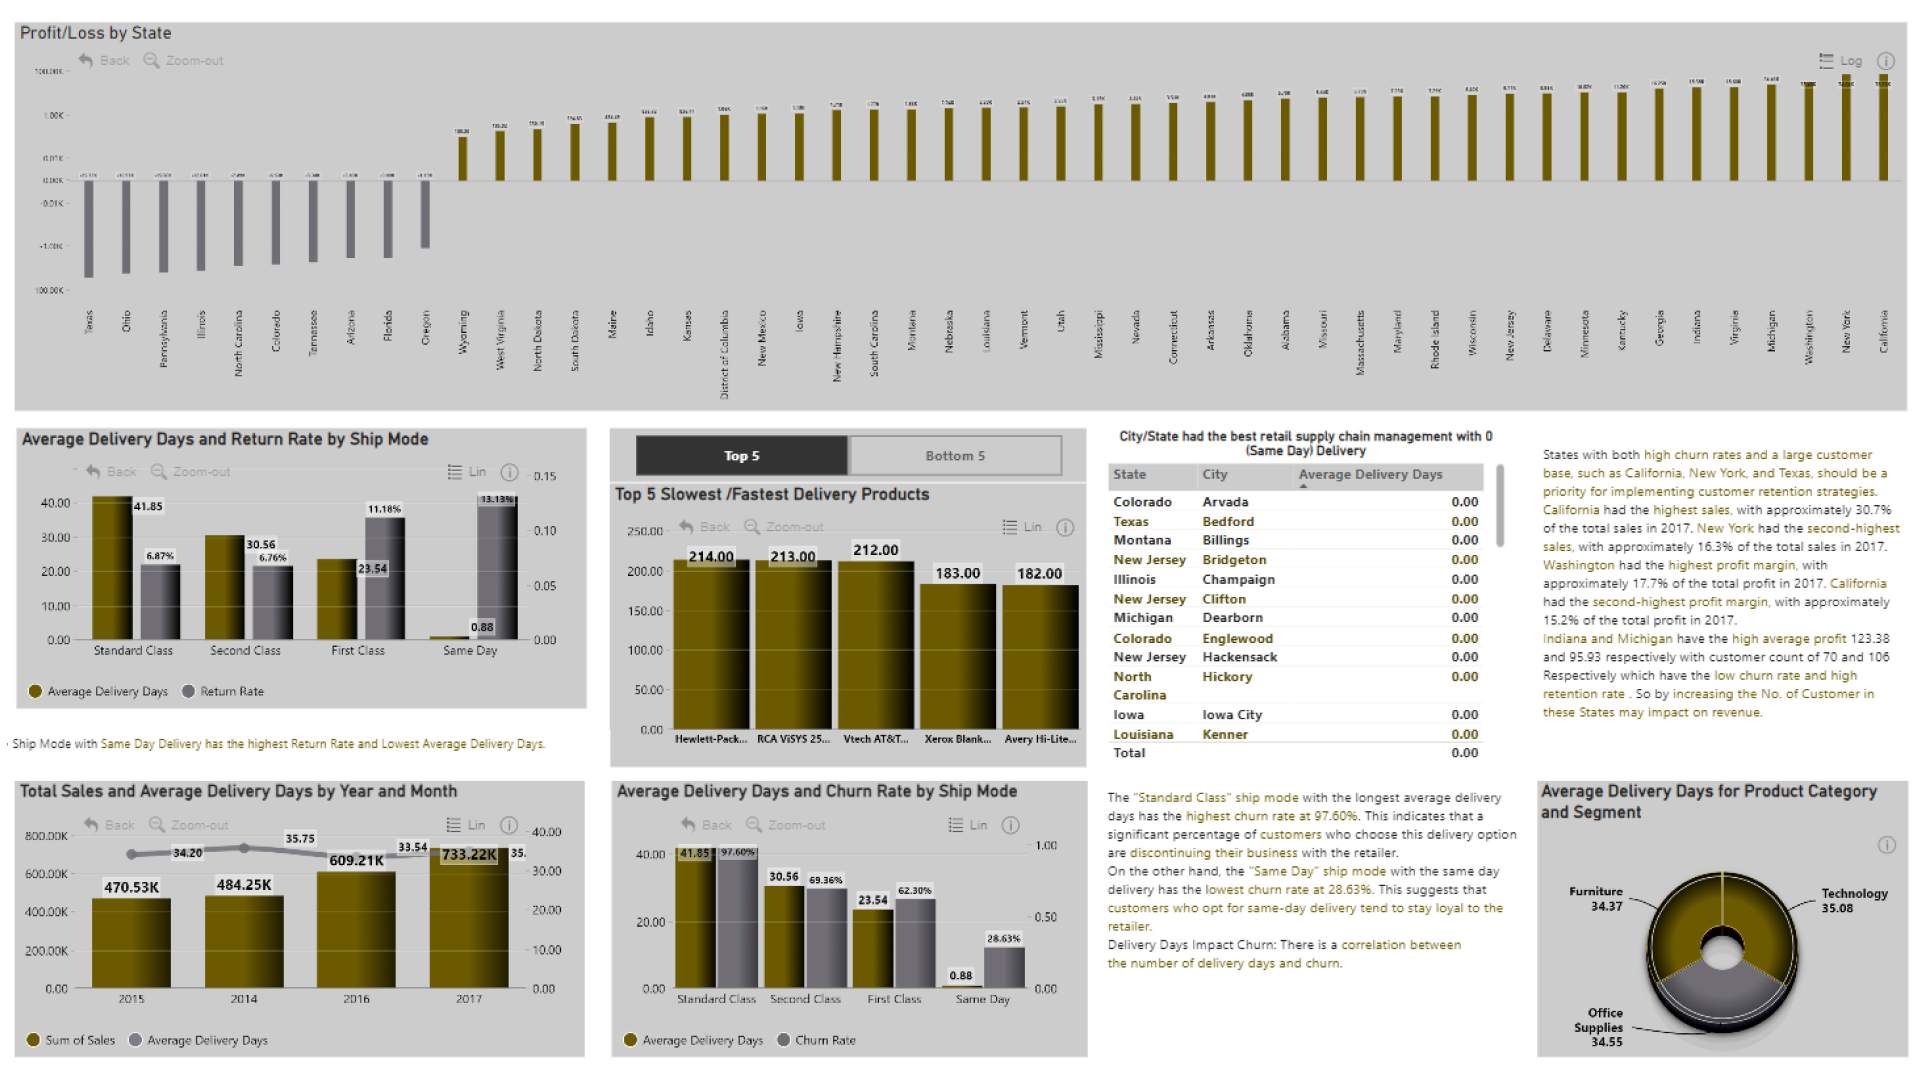
✅ Sales Insights: Sales was increasing in 2017. The Highest Sales Month/Year was Nov./2017 and Lowest Sales Month was Feb,/2014
💰 Profit Optimization: Gain precise control over profit margins, cost management, and financial well-being.
🚀 Churn Rate Assessment:
Attention Needed: The data highlights a need for attention to customer retention strategies, especially in the later years (2016 and 2017), where the churn rate is significantly higher, and the retention rate is lower.
🔒 Delivery Days Impact Churn: There is a correlation between the number of delivery days and churn.
🔒 Return Rate - Ship Mode with Same Day Delivery has the highest Return Rate and Lowest Average Delivery Days.
This project empowers us with the tools needed to boost retail growth, improve customer experiences, and make data-driven decisions that count. I am excited to share my insights, and I welcome collaboration and discussion with fellow data enthusiasts and retailers.
Mobile view allows you to interact with the report. To Download the template please switch to desktop view.