Feel free to leave your vote:
1
Share template with others
Summary
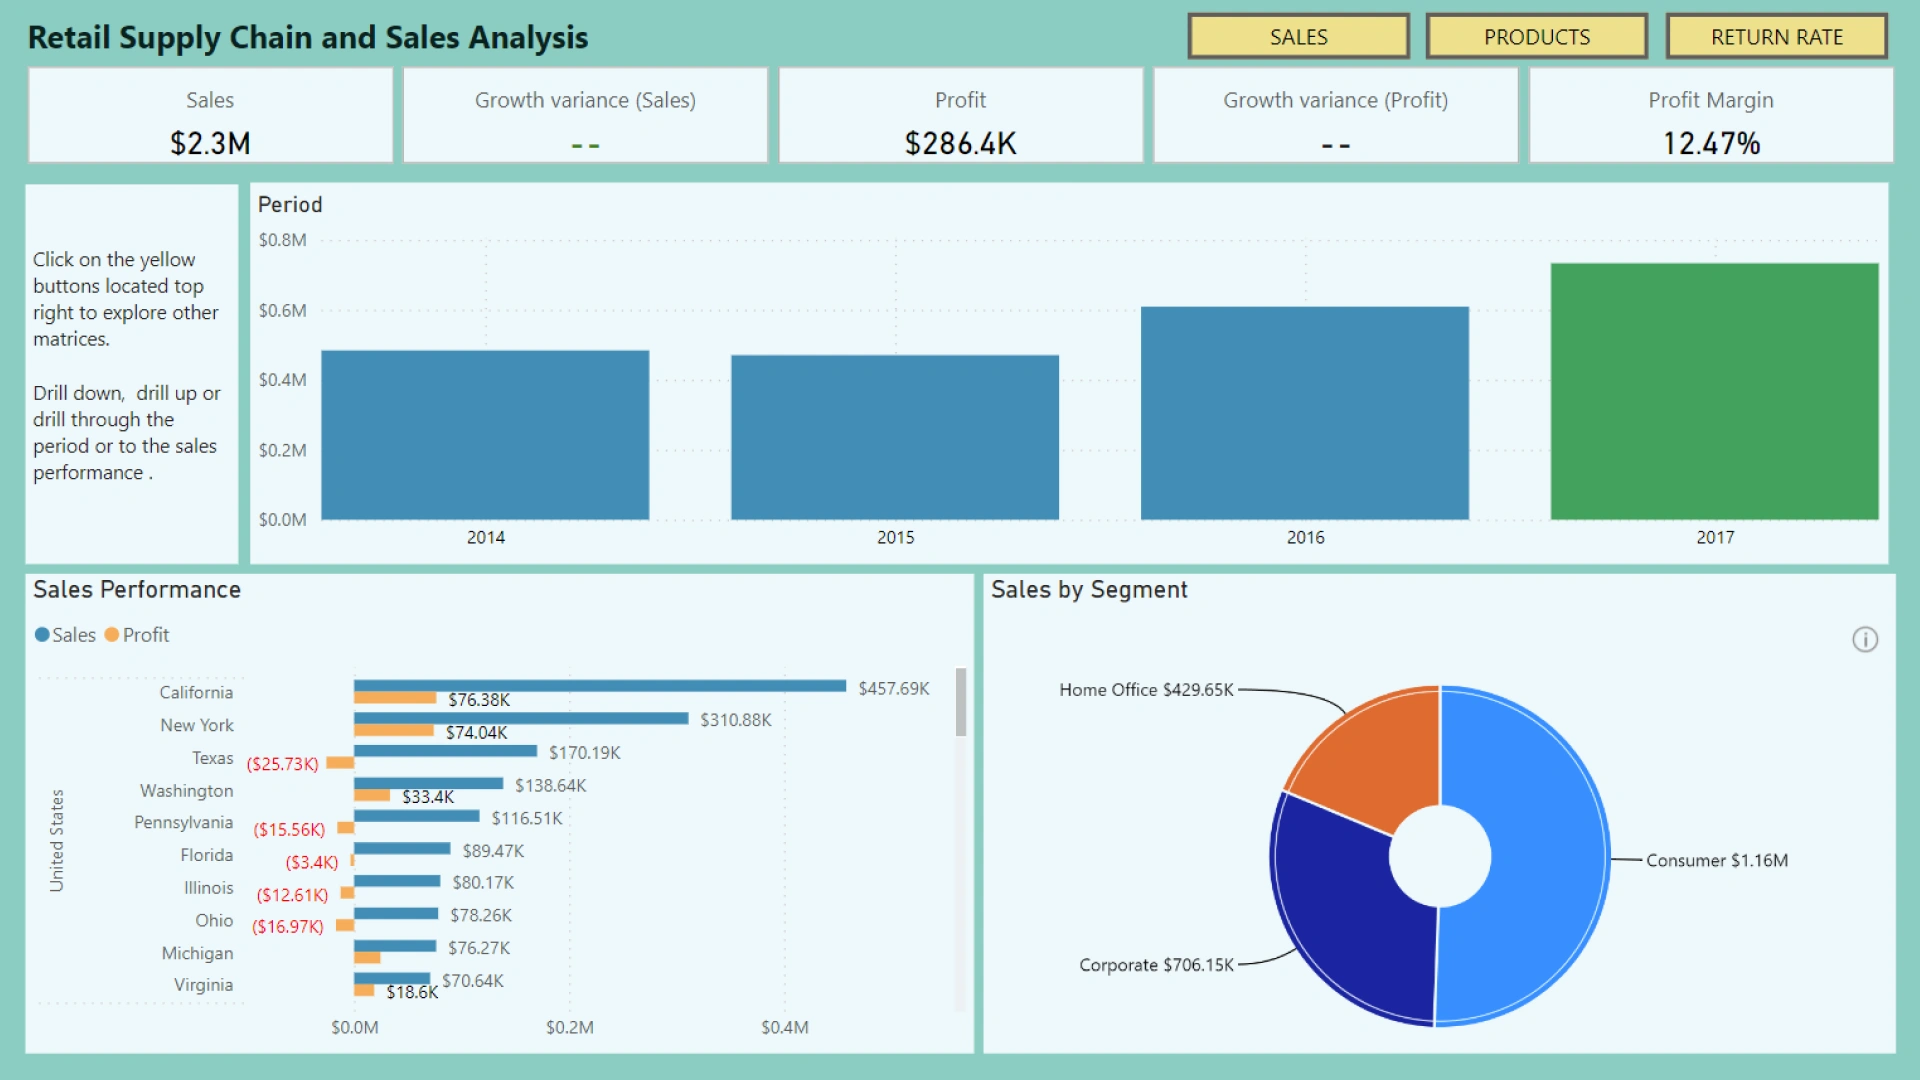
Report submitted for FP20 Analytics ZoomCharts Challenge, October 2023. The report was built with North America Retail Supply Chain and Sales Analysis dataset and includes ZoomCharts custom Drill Down PRO visuals for Power BI.
Author's description:
For this project, a company or business needs their Retail Supply Chain and Sales analyze in order to understand gains and losses. Some of the primary concerns are:
Which City/State had the best retail supply chain management?
What were the average delivery days for the different product categories?
Whas was the average delivery days for each segment? What were the 5 fastest delivery products?
What were the 5 slowest delivery products? Which salesperson had the lowest return rate?
Can we find the correlation between ship mode and return rate?
Which ship mode had the lowest/highest return rate? Which top 5 customers made the most profit?
On top of these, I have also look into the following:
What are the top selling products?
How do returns affect overall sales across different geography?
How do different discount rates apply to sales impact the overall profit and revenue?
Tools Used: SSIS SQL Power BI Dashboard
There are 2 dashboards and the first one is an overview of sales, products and return rate for which it answered the majority of the companies' concerns the rest you will find in the sales detail. You can toggle back and forth on those three by clicking the buttons located on the top right. You may drill down or up for the time period and geography to conduct your own evaluation. You may also drill through on the period should you further analyze, or you may choose a period and drill through each geography if you want to be more specific. The time period can drill down from year down to the day itself.
Mobile view allows you to interact with the report. To Download the template please switch to desktop view.