logo
For Power BI
  • Products
    • Drill Down Donut Pro Drill Down Donut PRO
    • Drill Down Pie Pro Drill Down Pie PRO
    • Drill TimeSeries Pro Drill Down TimeSeries PRO
    • Drill Combo Pro Drill Down Combo PRO
    • Drill Map Pro Drill Down Map PRO
    • Drill Scatter Pro Drill Down Scatter PRO
    • Drill Down Network Pro Drill Down Network PRO
    • Drill Down Waterfall Pro Drill Down Waterfall PRO
    • Drill Down Graph Pro Drill Down Graph PRO
    • Drill Down Timeline Pro Drill Down Timeline PRO
    • Drill Down Combo Bar PRO Drill Down Combo Bar PRO

    Video tutorials

    Watch Now

    More than 90 videos on how to enhance Power BI with ZoomCharts

    Learn more
    All visuals
  • Resources

      Resources

    • Documentation
    • Report Examples
    • Blog
    • Webinars
    • Video Tutorials
    • Visuals Gallery

    Support

    • ZoomCharts Assistance
    • Contact Sales
    • Contact Support
    • FAQ

    Challenges

    Challenges

    Improve your report creation skills by participating in free challenges for report creators.

    Learn more
    Start trial
  • Services
    • Power BI Report Development
    • Custom Visual Development
  • Challenges
  • Pricing
Request a quote Start Free Book a Demo Sign in
Get it now
Go back

Contents

Go back

Share

Logo

Welcome to the FP20 Analytics November 2024 Challenge!

Nov 12 - Dec 11, 2024 | EST

Join Challenge 21 and create a Power BI report to explore the dynamics of Candy Market Share

Timeline

Registration Open

Registration Open

12 November | 19:00

-

Submissions Open

Submissions Open

12 November | 19:00

-

Workshop | How to Analyze Candy market Share in Power BI 🟣 LIVE

Workshop | How to Analyze Candy market Share in Power BI 🟣 LIVE

26 November | 09:00

-

1:1 Mentoring Sessions

1:1 Mentoring Sessions

26 November | 09:00

12 November - 07 December

Entry Submission Deadline

Entry Submission Deadline

07 December | 19:00

12 November - 07 December

Webinar | TOP 5 Power BI Reports of Candy Market Share 🟣 LIVE

Webinar | TOP 5 Power BI Reports of Candy Market Share 🟣 LIVE

12 December | 11:00

12 November - 07 December

Winner Announced

Winner Announced

12 December | 11:00

12 November - 07 December

Dataset

Get the dataset

See past FP20 Analytics challenges

See past challenges

Share the challenge

Submitted Reports
About challenge
How to participate
The Brief
Judging criteria (Updated!)
Timeline
Dataset
Past challenges

Winner of the challenge

Report Card

Candy Market Analysis Dashboard

Author: Rakshit Bhadoria

18

View Report

All Submissions

Report Card

Candy Market Share

Author: Andreas Miftakhul Pratama

16

View Report
Report Card

Sweet Success - Unwrapping Candy Market Trends

Author: Jason Carl Martin Tupas

2

View Report
Report Card

Candy Market Analysis

Author: Zakaria Fadili

15

View Report
Report Card

CANDY MARKET SHARE ANALYSIS

Author: Agbata Dickson Ukolojo

1

View Report
Report Card

Candy Market Share Analysis by Fabian Vicencio Islas

Author: Fabian Vicencio Islas

6

View Report
Report Card

Candy Market Research Analysis

Author: Anjali K

0

View Report
Report Card

Quarterly Evaluation of Candy Market Share

Author: Okeh Dono Efasa

16

View Report
Report Card

Candy Sales Report

Author: Eniola Adekoya

3

View Report
Report Card

Candy Market Share

Author: Juan Diego Augusto

3

View Report
Report Card

Confectionery Market Analysis

Author: Chakradhar Mantena

16

View Report
Report Card

Candy Market Share Analysis

Author: Ajay Sonkatar

5

View Report
Report Card

Candy Market Share Analysis _ Ahmed Ali

Author: Ahmed Ali

7

View Report
Report Card

Candy Sales Analysis

Author: Muhammad Naveed Ziai

0

View Report
Report Card

Candy Market Share Analysis

Author: Abdullah El-Gohary

0

View Report
Report Card

Candy Market Share Analysis

Author: Anne Therese Balolong

0

View Report
Report Card

Candy Business Top Brands Analysis Report

Author: Blessing John

0

View Report
Report Card

Candy Market Dashboard

Author: Daniel van Dongen

0

View Report
Report Card

Discover Top Candy Brands and Packaging Trends

Author: Fagbuaro Blessing

0

View Report
Report Card

CANDY SHARE MARKET SHARE ANALYSIS

Author: Hema Prabhavathi

0

View Report
Report Card

FP20Candy Analysis_Igboejesi_Chidera

Author: Igboejesi Chidera

0

View Report
Report Card

Candy Market Share Analysis - Justin Lamb

Author: Justin Lamb

5

View Report
Report Card

Candy Market Share Analysis

Author: M. Haider Hassan

1

View Report
Report Card

Candy Market Dashboard

Author: Norman Reynaldo Sabillon Castro

7

View Report
Report Card

Candy Market Share Analysis

Author: Sushree Jena

0

View Report
Report Card

Candy Market Share Analysis

Author: Sweety Antoni David

4

View Report
Report Card

Sweet Strategies - Unwrapping Market Share Dynamics.

Author: Ugochukwu Nwasuruba

3

View Report
Report Card

Zulay Vivas de Arrieta

Author: Zulay Vivas

3

View Report
Report Card

FP20_Candy_Project

Author: Benjamin Kettey-Tagoe

3

View Report
Report Card

Candy Market Share Analysis

Author: Cherry Aye Mya Mya Tun

0

View Report
Report Card

Análisis del Mercado de Golosinas: Tendencias y Oportunidades

Author: Diego Armando Vasquez Chavez

3

View Report
Report Card

Candy Sales Analysis

Author: Emmanuel Idowu

0

View Report
Report Card

Candy Market Share Analysis Report

Author: Gamal Mahmoud

0

View Report
Report Card

Candy Market Share Analysis

Author: Gomathi Latha

0

View Report
Report Card

F20 Analytics Candy Market

Author: Hector Contreras

0

View Report
Report Card

Confectionery Market Insights: Manufacturer & Brand Analysis

Author: Jithil John

6

View Report
Report Card

Candy Sales Analysis

Author: Lalit Mohan Pant

2

View Report
Report Card

Candy Market Share Analysis

Author: LORENA HERNANDEZ MORALES

0

View Report
Report Card

Candy Market Share Analysis

Author: Mohamed Hamdi

0

View Report
Report Card

Power BI Dashboard on the Candy Market Share

Author: Naval Singh

0

View Report
Report Card

Candy Market Share Analysis

Author: Nizamar Cubas

1

View Report
Report Card

Candy Sales Report

Author: Olha Shaptala

1

View Report
Report Card

Candy Market Share Analysis

Author: Richard Mukechiwa

4

View Report
Report Card

Candy Market share Analysis

Author: Rija Sajjad

6

View Report
Report Card

Candy Market Analysis Dashboard

Author: Sakshi Goyal

1

View Report
Report Card

FP20 Analytics November 2024 CANDY MARKET Challenge

Author: Samson Obazee

2

View Report
Report Card

Candy Market Share Analysis Project Challenge

Author: Shelly Nagar

0

View Report
Report Card

Candy Market Share report by Stefan Kragulj

Author: Stefan Kragulj

0

View Report
Report Card

Candy Market Share Report

Author: Subhasis Das

0

View Report
Report Card

Candy Sales Report

Author: Suleman Abdulmalik

0

View Report
Report Card

Candy Market Share Analysis

Author: VISHAL R G

0

View Report

About FP20 Analytics ZoomCharts Challenge

Want to learn to build PRO reports? With personalized feedback and informative workshops, this is your opportunity to take your report-building skills to the next level, build your professional portfolio, and network with like-minded people.

The ZoomCharts challenge is hosted in partnership with FP20 Analytics – a group that unites passionate and inspiring data enthusiasts, and helps new data analysts improve their skills and build a competitive portfolio. Join in and sharpen your skills together with this open and friendly data community. Read more about the challenges on the FP20 Analytics website. Join the community on LinkedIn.

Participate in FP20 Analytics ZoomCharts Challenge to enrich your skill in creating PRO reports that help business users explore data quickly and intuitively. 

  1. Free License: All participants receive a free ZoomCharts Developer License that gives access to the full Drill Down PRO visuals library. License will remain active for 1 year after the challenge.
  2. Learn from Experienced Professionals: As part of the challenge, we host live workshops on report building and visualizing the challenge’s dataset in Power BI. Challenge participants can also book an individual consultation with an experienced Power BI mentor to ask questions and get personalized tips.
  3. Tailored Feedback: Every challenge submission will receive personalized feedback, giving participants the chance to hone their skills and improve their reports.

Prizes

The best report’s creator will receive a $300 Amazon gift card from ZoomCharts. The ZoomCharts winner will be announced in a special live webinar session on December 12th, where we will review the Top 5 entries from the challenge. 

Webinar recordings

Recording thumbnail

How to Analyze Candy market Share in Power BI 🟣 LIVE

LIVE Workshop on for the FP20 Analytics & ZoomCharts Challenge 21:

Candy Market Share Analysis in Power BI

Watch the recording
Recording thumbnail

TOP 5 Power BI Reports of Candy Market Share 🟣 LIVE

Best FP20 Analytics ZoomCharts Challenge 21 submissions + the winner announcement


Watch the recording

How to participate? 

1. Register for the challenge: 

  • Download the Challenge dataset either on this Challenge page or from FP20 Analytics website. 
  • Register for the FP20 Analytics ZoomCharts Challenge. 
  • Activate your free Drill Down Visuals Developer License for Power BI. Read license setup instructions.
  • Read the challenge brief (see "The Brief" section) for additional info about the dataset and to see what questions your report should answer.  

2. Build your report in Power BI: 

  • Set up an account in Power BI using the assigned license details (if you have participated in ZoomCharts Challenges in the past, you can use the same account you set up before).
  • Use the account to access the full library of custom ZoomCharts Drill Down visuals. 
  • Use the dataset to build a Power BI report including at least 2 ZoomCharts Drill Down Visuals in one report page. 
  • The recommended number of pages in the report is up to 3 pages, including drill-through pages. 

3. Improve your report and learn new skills: 

  • To learn more about applying ZoomCharts visuals in your reports, participate in the challenge workshop. 
  • If you have any questions or need advice, you can book a free individual consultation. 
  • Check out the submissions from past challenges for inspiration. 

4. Submit your challenge entry: 

  • Submit your report in .pbix format for validation. 
  • If your submission doesn’t match the challenge criteria, you will be notified by email indicating the reason. Don't worry if this happens! You can fix the issue and resubmit your report. 
  • Together with validation confirmation, you will receive a publish to web link that you can use to add the report to your portfolio or publicly share online. 
  • All validated entries will receive personalized feedback from the evaluation team. You can use this feedback to revise your report and resubmit it before the deadline. Feel free to resubmit your entry as many times as necessary before the deadline. 

5. Finalize your participation to compete for the ZoomCharts grand prize: 

  • (Optional) Upload your publish to web link on NovyPro.  If you opt to post your report on NovyPro, for instructions on how to do this, refer to the video link provided. NovyPro: https://www.novypro.com/  
    Instruction Video: https://www.youtube.com/watch?v=jkcAYgFGWUY
  • Post the final version of your submission in PDF format on your LinkedIn profile. 
  • Use the caption "I am participating in FP20 Analytics Challenge 21”. 
  • Include a summary of your report's key insights and add the ZoomCharts publish to web link or NovyPro link. 
  • Use the hashtags #FP20Analytics, #FP20MarketShareAnalysis, #builtwithzoomcharts, tag @Federico Pastor and @ZoomCharts. 
  • Additionally, post your report in the FP20 Analytics LinkedIn Community group. 
  • Follow ZoomCharts on LinkedIn 

6. Attend challenge closing webinar to hear the results: 

  • The submissions are evaluated by ZoomCharts team (see "Judging criteria" for more info). The submissions of Top 5 ZoomCharts Challenge finalists are analyzed live during the challenge closing webinar to share the best practices and learning opportunities with the community. 
  • The author of the best report is awarded with a $300 Amazon gift card.

About the dataset

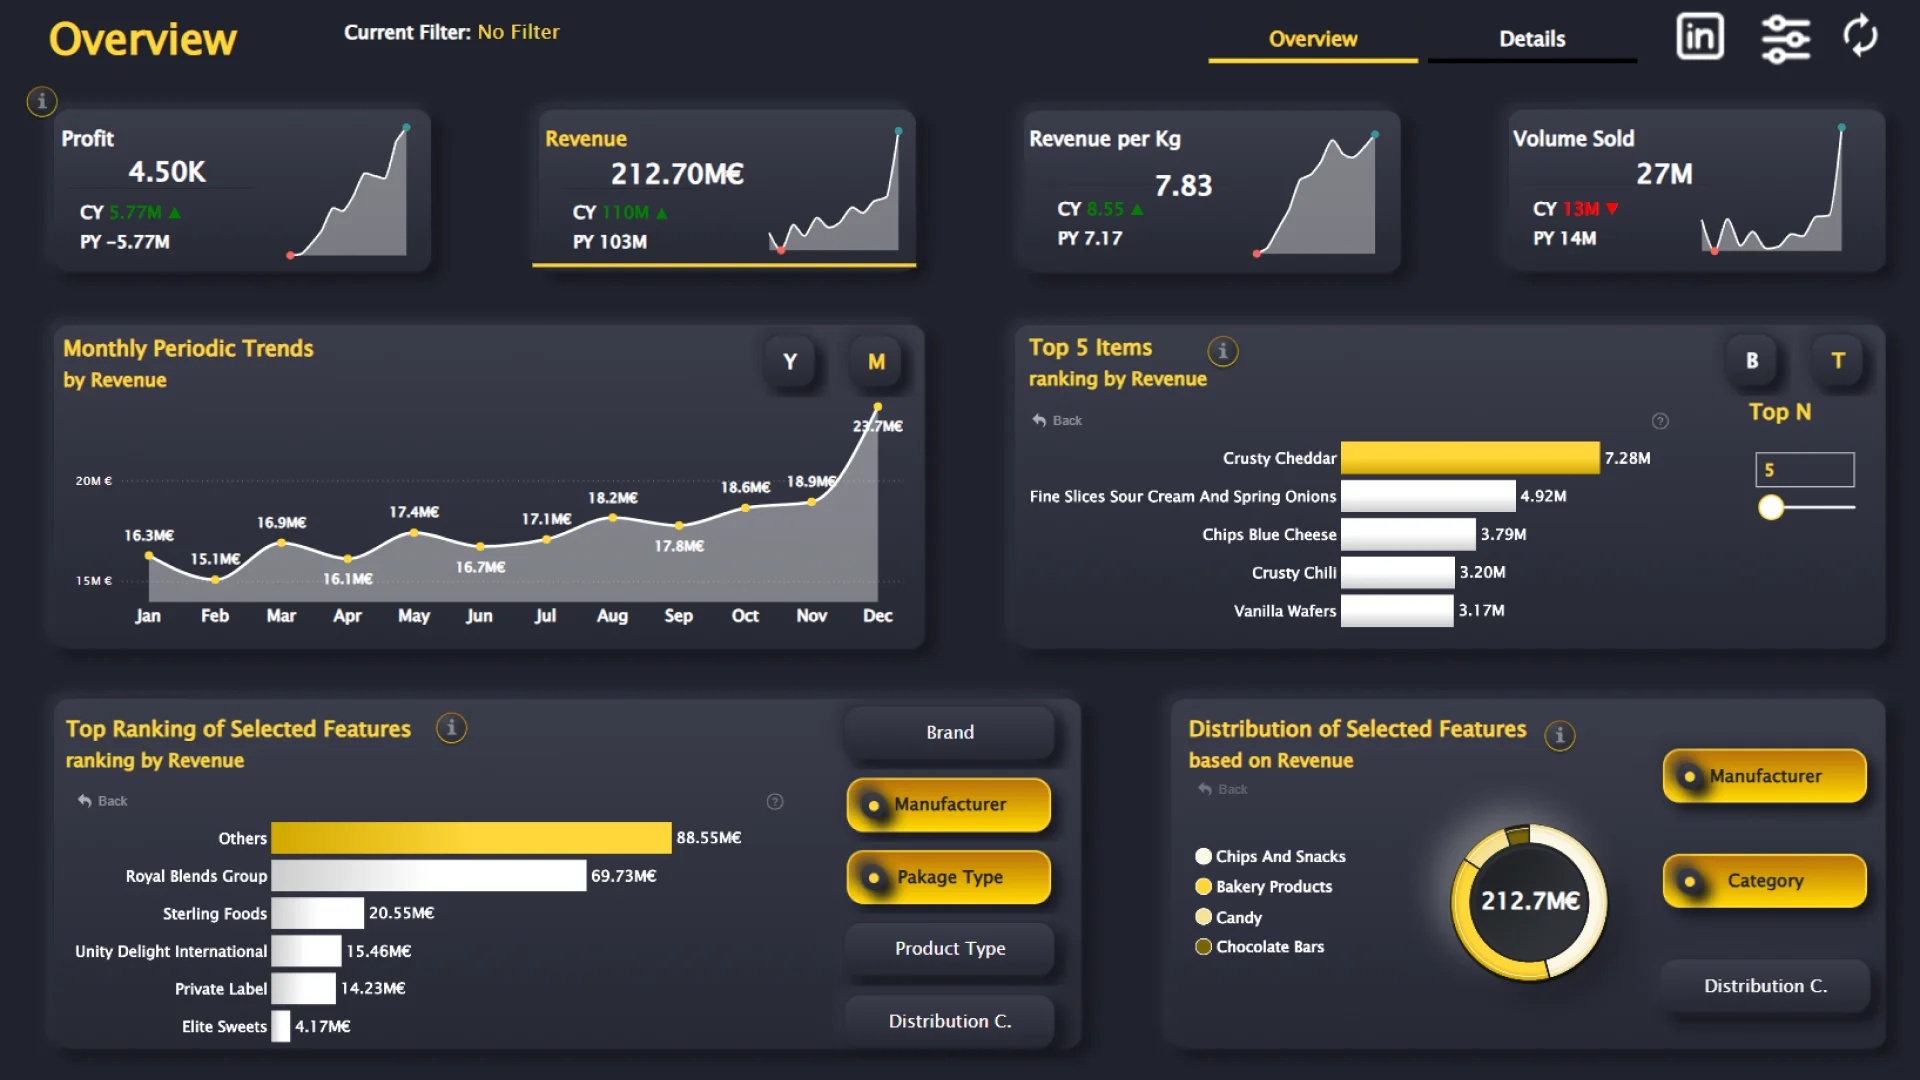
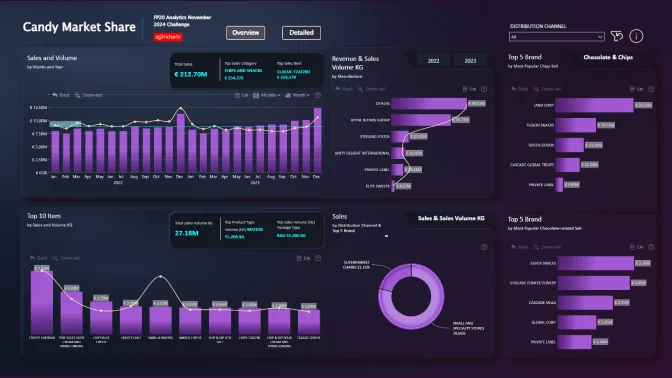
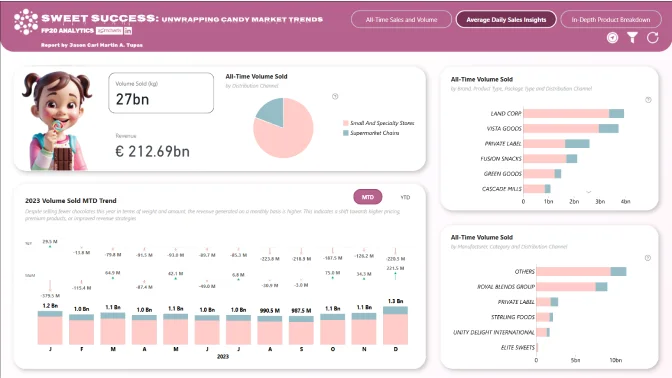
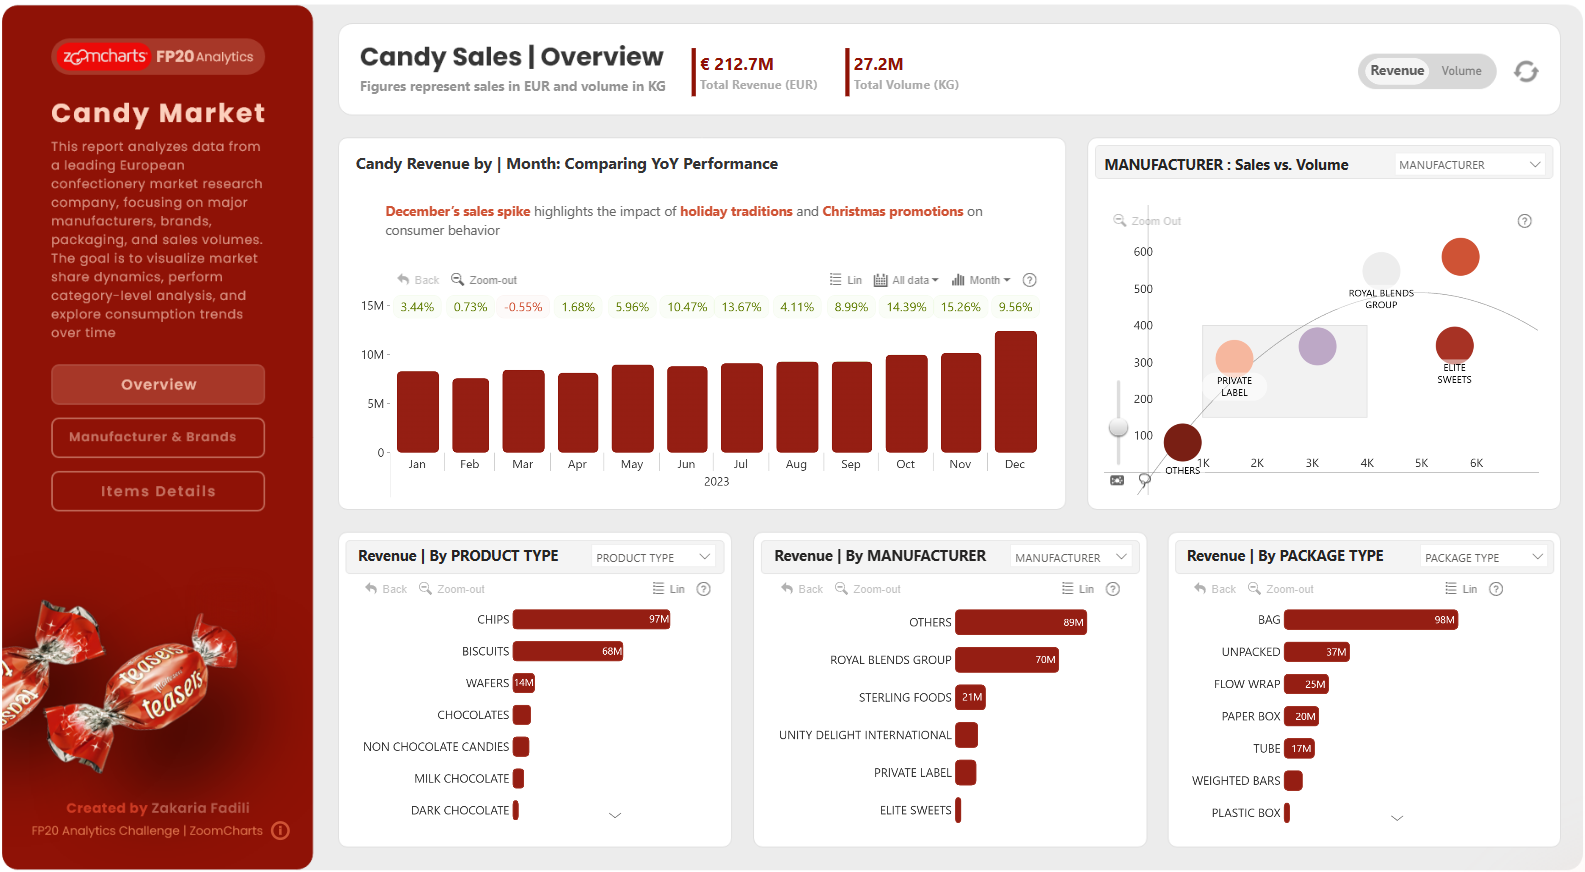
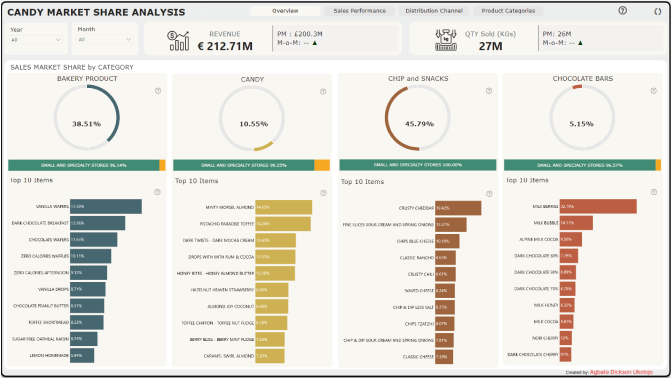
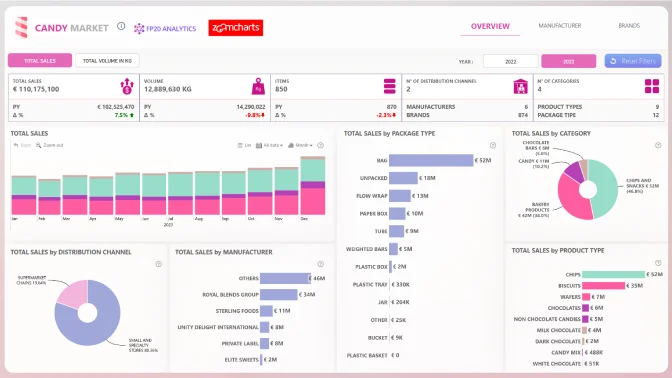
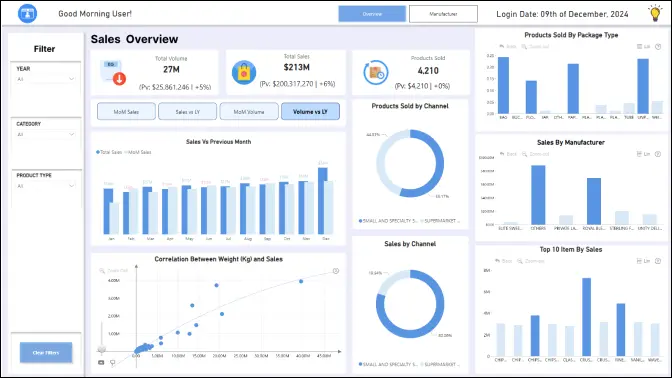
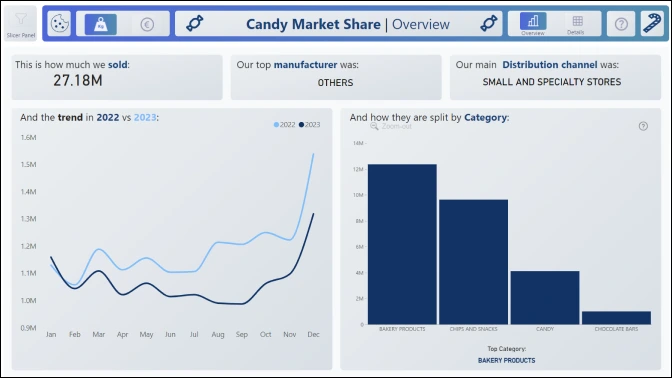
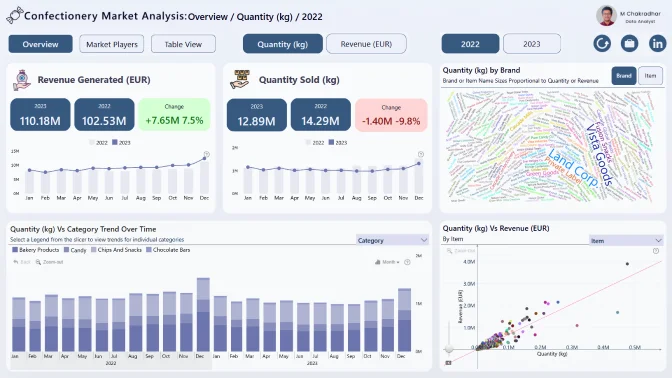
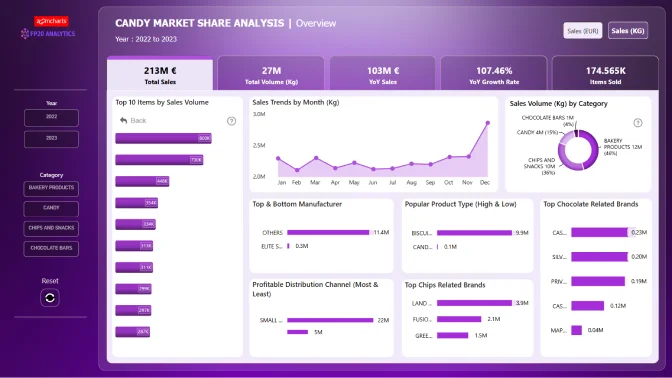
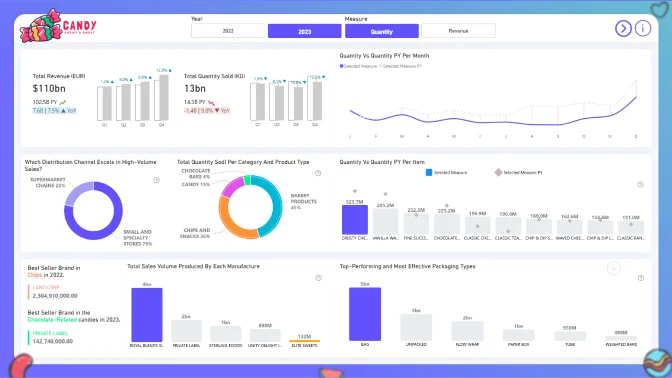
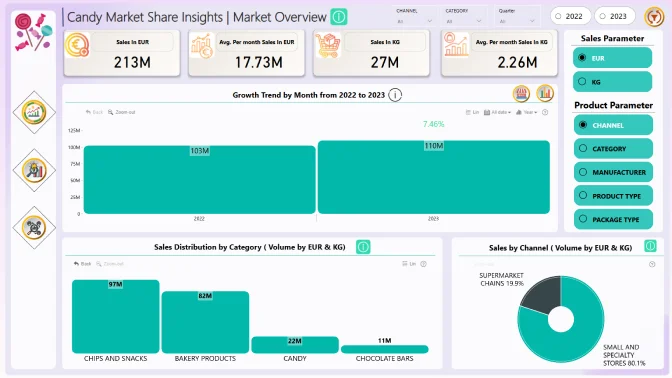
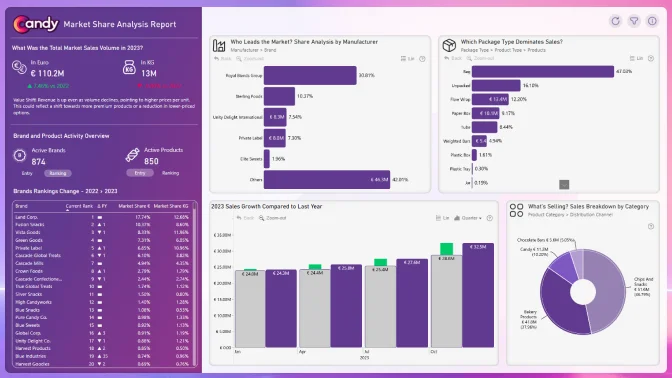
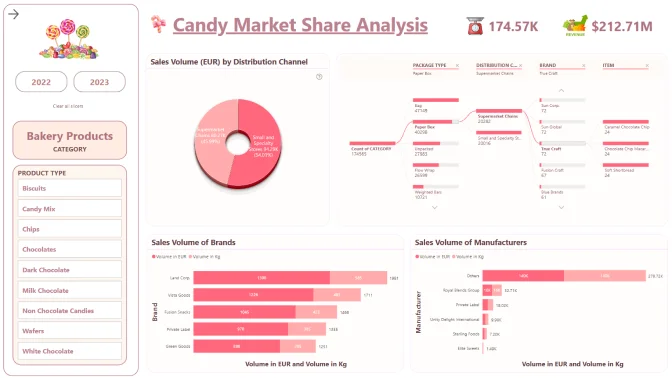
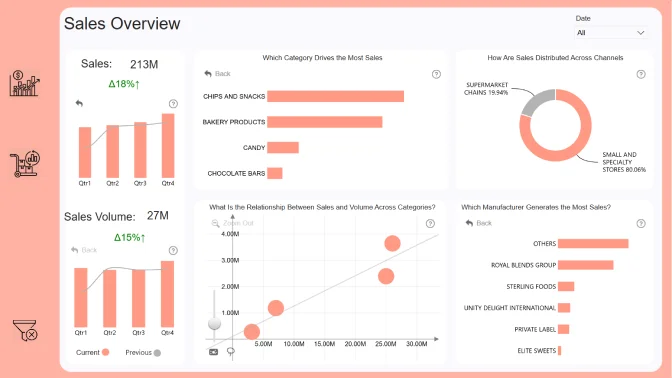
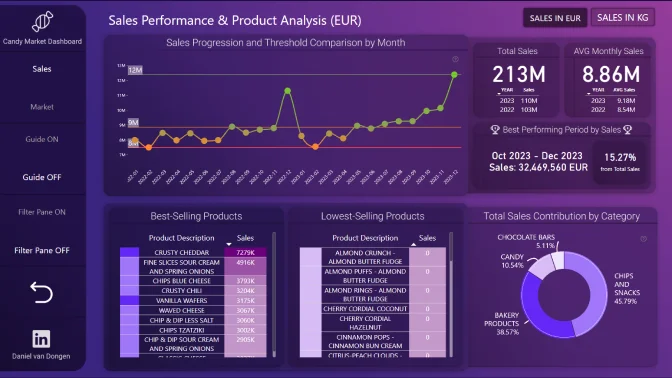
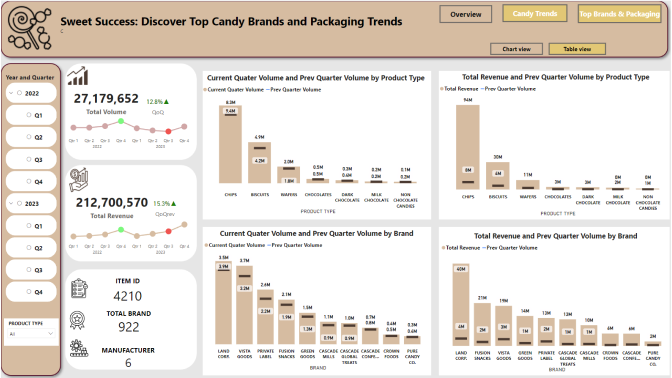
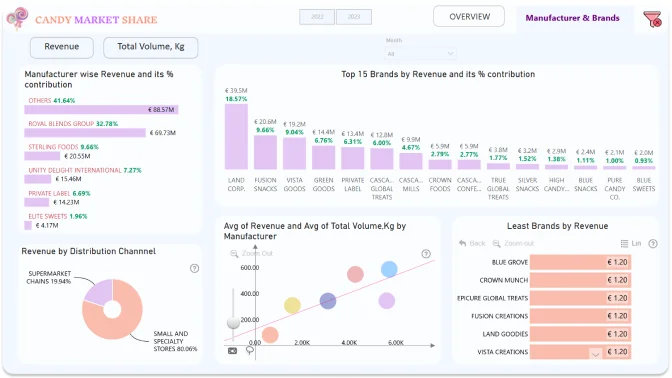
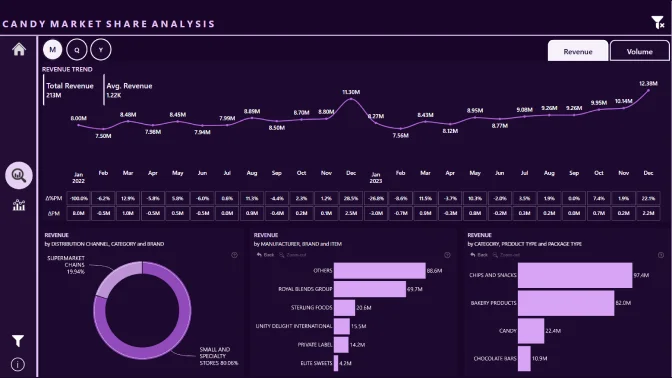
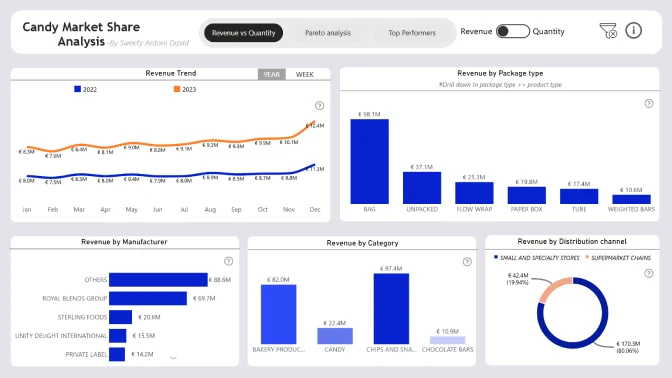
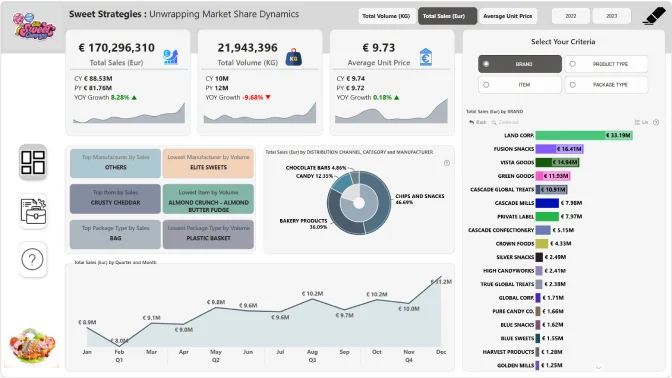
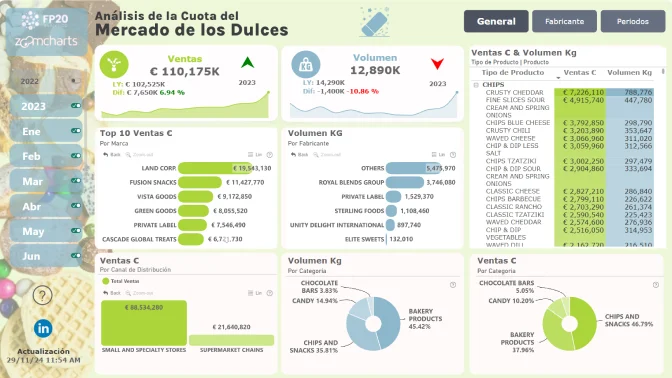
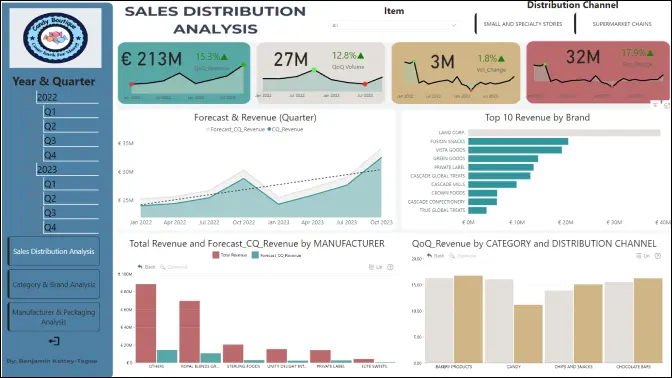
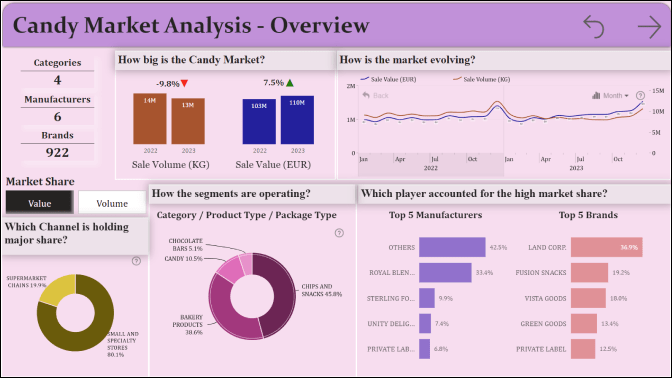
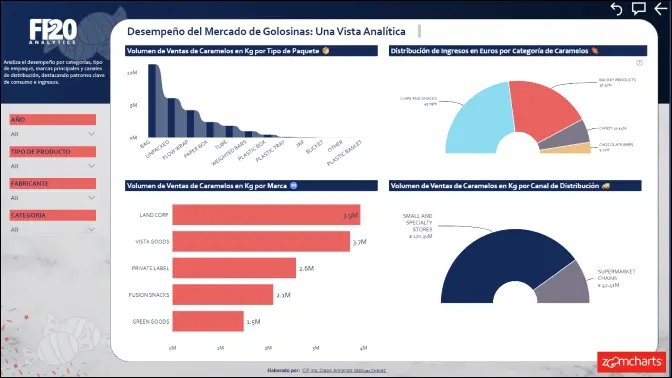
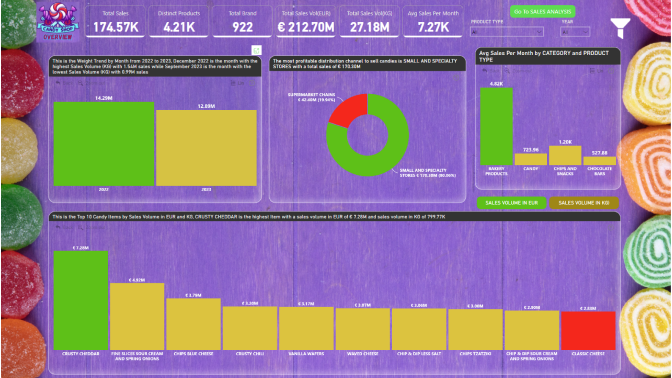
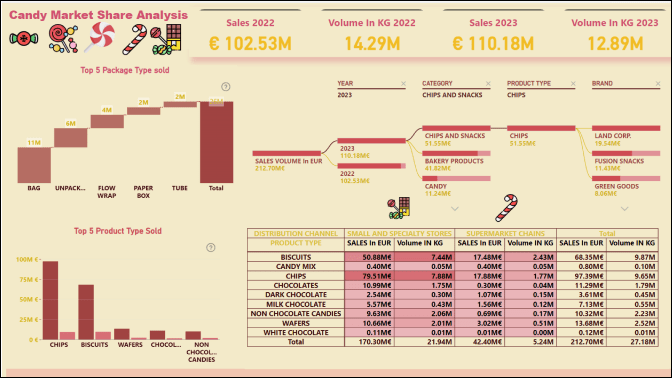
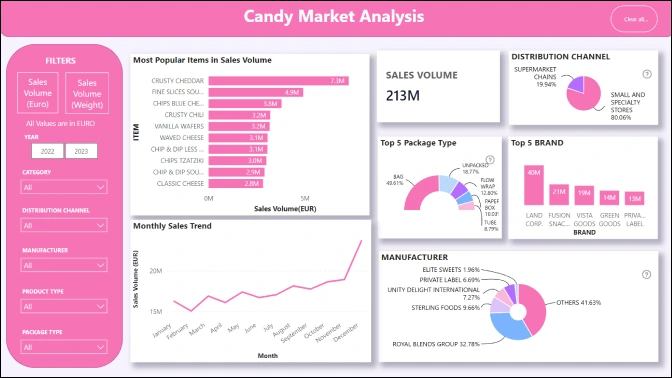
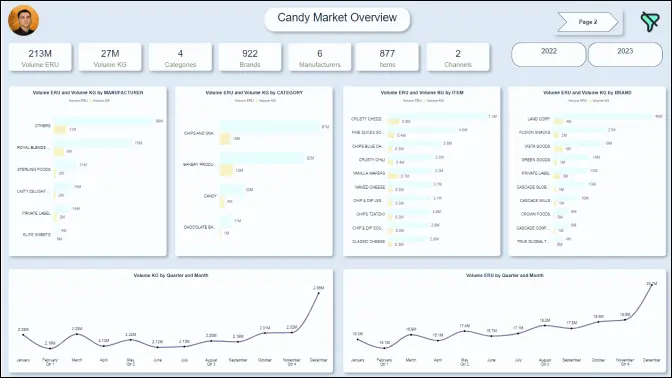
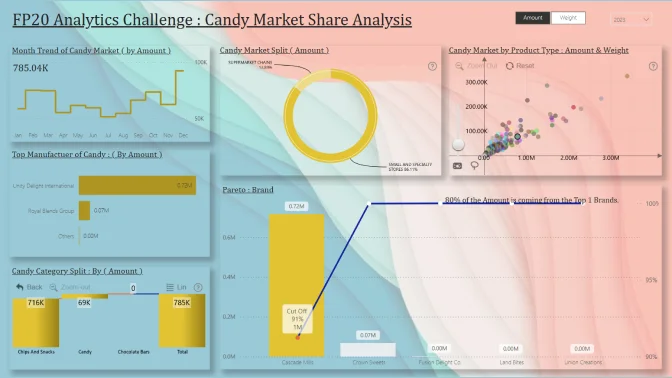
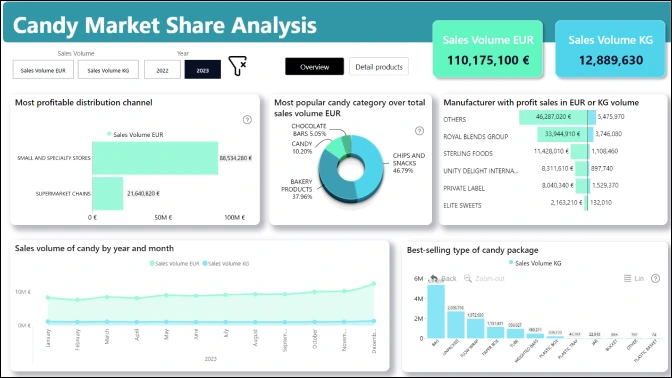
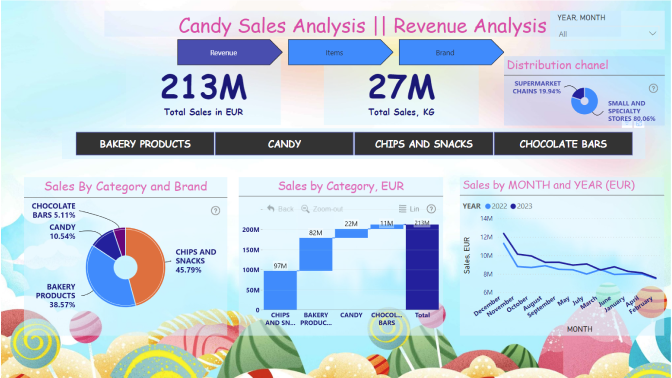
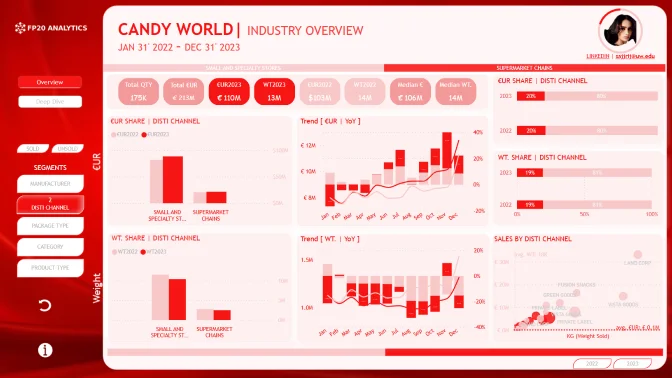
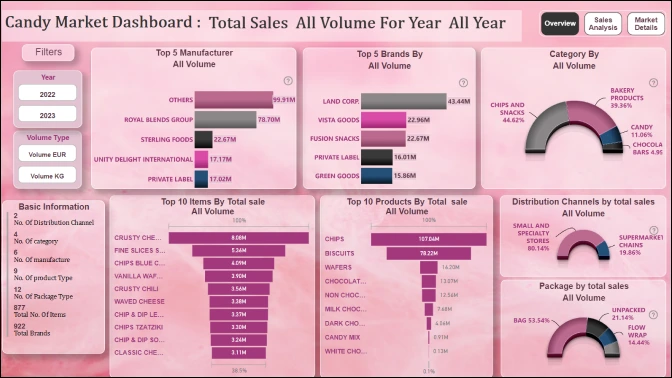
This Power BI report competition centers on analyzing data from a leading European market research company specializing in the confectionery industry. The dataset includes detailed information on major manufacturers, their brands, packaging, and sales volumes in a specific regional market. Contestants are tasked with visualizing market share dynamics among key players, conducting category-level analysis, and exploring consumption volumes over time.

The report should visualize this information and provide actionable insights to support strategic decision-making for the Company Researchers.

What should your report include?

Create a report that allows end users to easily find answers to the following questions:

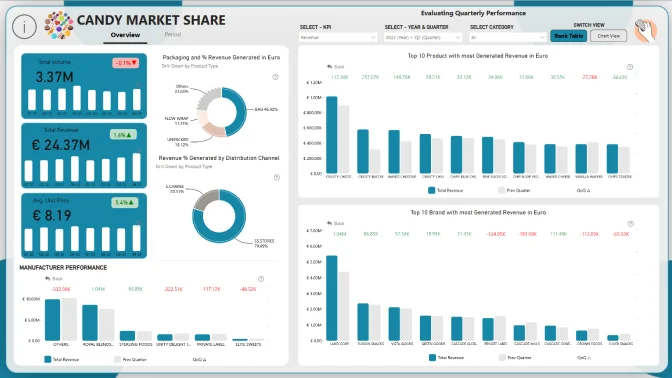
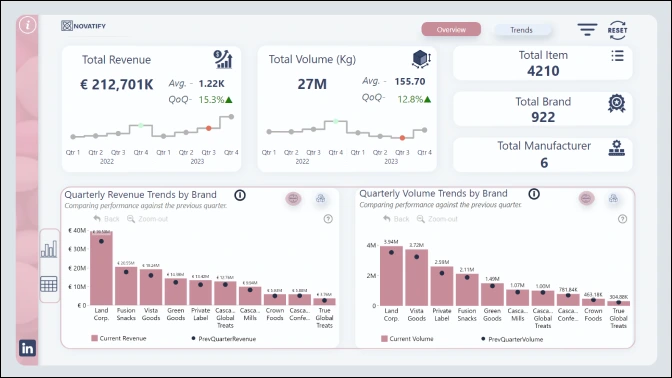
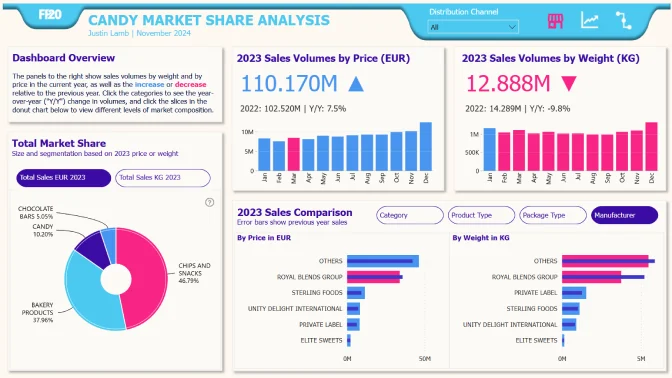
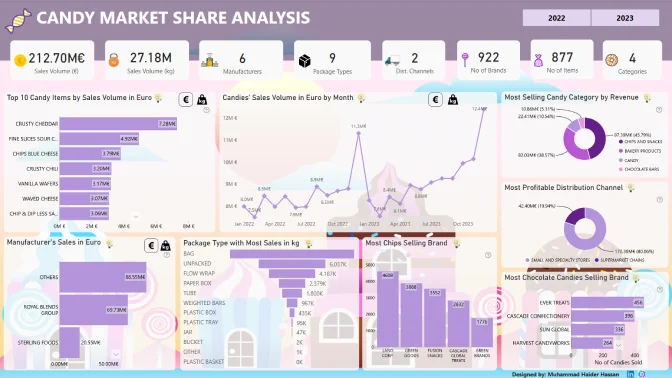
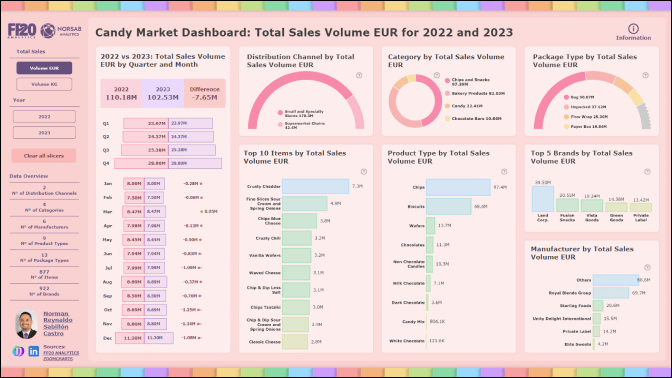
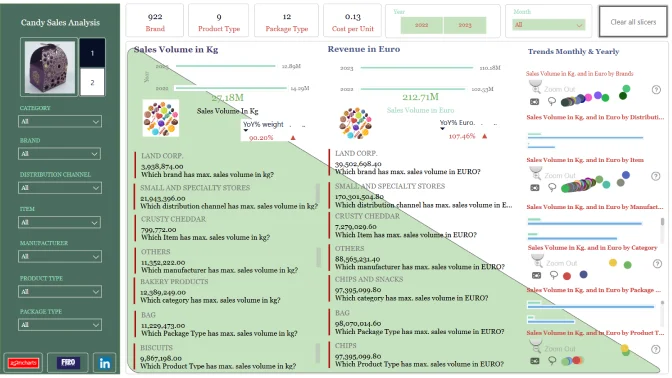
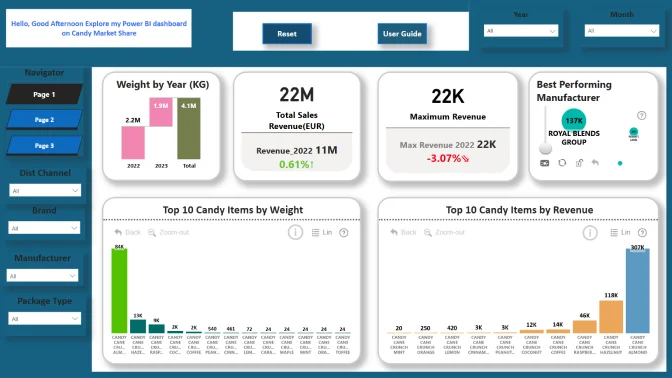
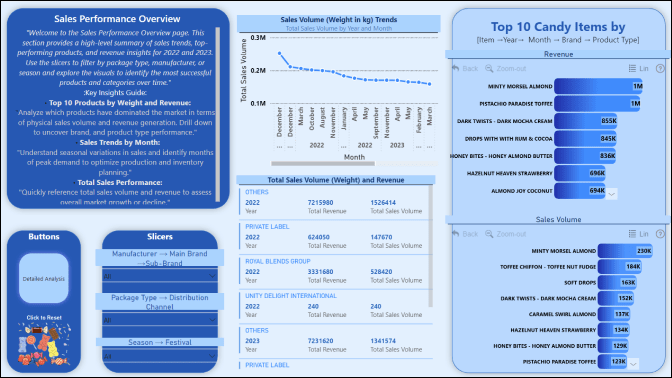
1. What are the top 10 candy items by sales volume in terms of weight in 2022 and 2023?

2. What are the top 10 candy items by sales volume regarding money value in 2022 and 2023?

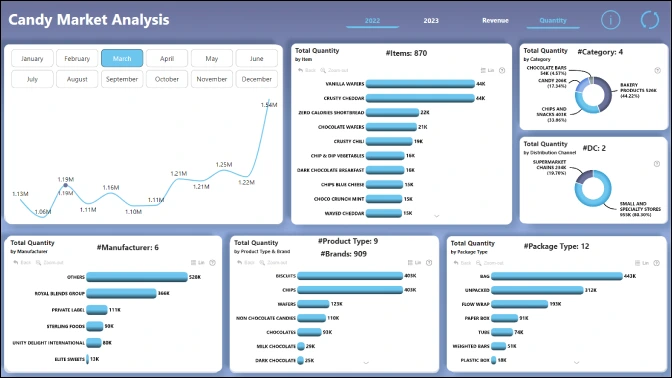
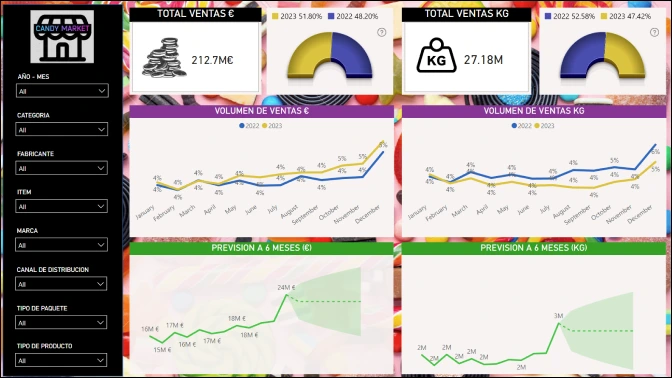
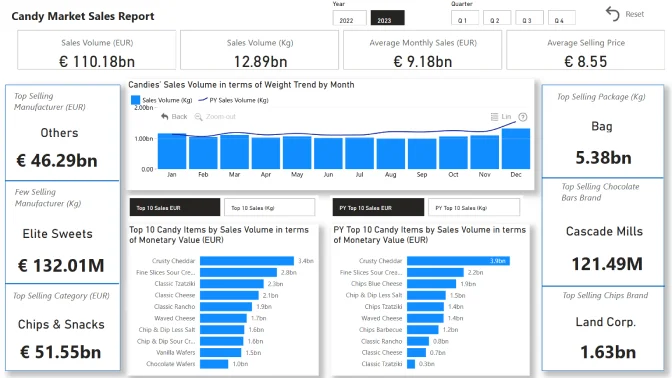
3. What is the candies’ sales volume in terms of weight trend by month from 2022 to 2023?

4. What manufacturer had the most sales volume in the euro dollar in 2022?

5. What manufacturer had the fewest sales volume in weight in 2023?

6. Which package type of candy is the most popular to sell by weight?

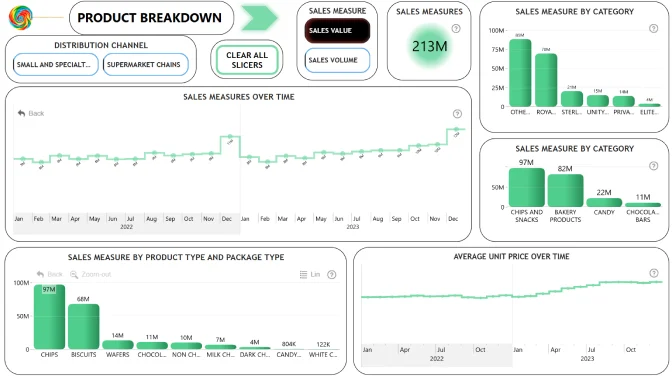
7. Which candy category is the most popular to sell by revenue?

8. Which candy brand sold the most chips in 2022?

9. Which candy brand sold the most chocolate-related candies in 2023?

10. What is the most profitable distribution channel to sell candies?

Technical requirements

  • Build your report using only Power BI 
  • The recommended number of pages in the report is up to 3 pages, including drill-through pages.
  • Canvas size is 16:9 (Default Power BI size) or Full HD size = w:1920 - h:1080 
  • The report should contain at least 2 ZoomCharts Drill Down visuals within a single page. See a practical guide for using Drill Down visuals here

Judging criteria

Business users use reports to make data-driven decisions. That’s why reports are called effective if they enable users to drill down and filter data quickly and intuitively to find answers to any question they might have and analyse data in all possible directions and dimensions.

Each report is evaluated based on three main criteria: intuitiveness, insightfulness, and interactivity. These factors ensure that the reports are not only accurate and functional, but also meet the target audience's needs and are ready to be presented to the end-users. 

  1. Intuitive: How clear and easy it is to understand the report at a glance? (max 15 points)
    • Is the report visually appealing?
    • Choice of charts and visual elements
    • Does the report tell a story?
    • Is it not overwhelming to the user?
    • Choice of tooltips, titles, and legends

  2. Interactive: How engaging and seamless is the report exploration and interaction with data? (max 15 points)
    • Clear navigation that allows user to explore the report
    • Use of slicers and other interactive elements
    • Smooth cross-chart integration
    • Is report optimized for touch devices?
    • Are tutorials and guiding elements helpful to the user?

  3. Insightful: How accurate, complete, and meaningful is the data in driving decisions? (max 15 points)
    • Depth of analysis
    • Data cleaning and preparation
    • Does data show up accurately in the report?
    • Is report optimized for quicker loading time?
    • Does the report provide deeper exploration of data (drill-down)?


Timeline

Registration Open

Registration Open

12 November | 19:00

-

Submissions Open

Submissions Open

12 November | 19:00

-

Workshop | How to Analyze Candy market Share in Power BI 🟣 LIVE

Workshop | How to Analyze Candy market Share in Power BI 🟣 LIVE

26 November | 09:00

-

1:1 Mentoring Sessions

1:1 Mentoring Sessions

26 November | 09:00

12 November - 07 December

Entry Submission Deadline

Entry Submission Deadline

07 December | 19:00

12 November - 07 December

Webinar | TOP 5 Power BI Reports of Candy Market Share 🟣 LIVE

Webinar | TOP 5 Power BI Reports of Candy Market Share 🟣 LIVE

12 December | 11:00

12 November - 07 December

Winner Announced

Winner Announced

12 December | 11:00

12 November - 07 December

Dataset

Get the dataset

See past FP20 Analytics November 2024 challenges

See past challenges

Your Drill Down Visuals Developers License

Use the email and password provided below to log in Power BI Desktop and access an account with a license to use all ZoomCharts Drill Down Visuals.

Upon logging in, you will need to change your password and enable two-factor authentication. If you encounter any problems, feel free to reach out to us via chat.

*This Developer License can be used to create a report for this ZoomCharts Mini Challenge or for your personal training purposes. Commercial use of this license is prohibited.

Upload failed
Attach file
File requirements: 16MB

Any questions? Feel free to use chat!

Are you sure you want to delete the report?

Activate your Drill Down visuals Developer License!

You can use these credential to access ZoomCharts visuals and create your report for this ZoomCharts Mini Challenge, or for your personal training purposes.


logo
[email protected]
+44 204 577 3993
logo

Products

Drill Down Network PRO Drill Down Waterfall PRO Drill Down Graph PRO Drill Down Combo PRO Drill Down Combo Bar PRO Drill Down Donut PRO Drill Down Pie PRO Drill Down TimeSeries PRO Drill Down Timeline PRO Drill Down Map PRO Drill Down Scatter PRO All Visuals

Resources

Report Examples Webinars Blog ZoomCharts Academy Visuals Gallery Documentation Custom Visual Development Subscribe to News

Solutions

Custom Visual Development

Company

Pricing About Us Partners Leave feedback Join PowerGroup EU Funding

Help

ZoomCharts Assistance Contact Sales Contact Support FAQ

Drill Down Network PRO Drill Down Waterfall PRO Drill Down Graph PRO Drill Down Combo PRO Drill Down Combo Bar PRO Drill Down Donut PRO Drill Down Pie PRO Drill Down TimeSeries PRO Drill Down Timeline PRO Drill Down Map PRO Drill Down Scatter PRO All Visuals

Report Examples Webinars Blog ZoomCharts Academy Visuals Gallery Documentation Custom Visual Development Subscribe to News

Custom Visual Development

Pricing About Us Partners Leave feedback Join PowerGroup EU Funding

ZoomCharts Assistance Contact Sales Contact Support FAQ
+44 204 577 3993
[email protected]

Ready to get in touch?

Contact our experts with any question about Power BI and ZoomCharts for Free!

Contact us

© 2025, Data Visualization Software Lab

U.S. Patents No. 11,645,343; 11,921,804

Cookies Policy
Manage cookies
Privacy Policy
Global
EULA
Patent
warning

Error message

success

Success info: Done!

ZoomCharts AI Assistant

We noticed you're using an old OS version.

For the best experience, we recommend upgrading to ensure that all website features display correctly.

Cookie settings

We use necessary cookies for site functionality, as well as statistic, marketing, and preference cookies to enhance your experience. For more information and to manage your preferences, please visit our Cookie policy