Feel free to leave your vote:
3
Share template with others
Summary
Report submitted for the FP20 Analytics ZoomCharts Challenge, November 2024. The report was built using the Candy Market Share dataset and includes ZoomCharts custom Drill Down PRO visuals for Power BI.
Author's description:
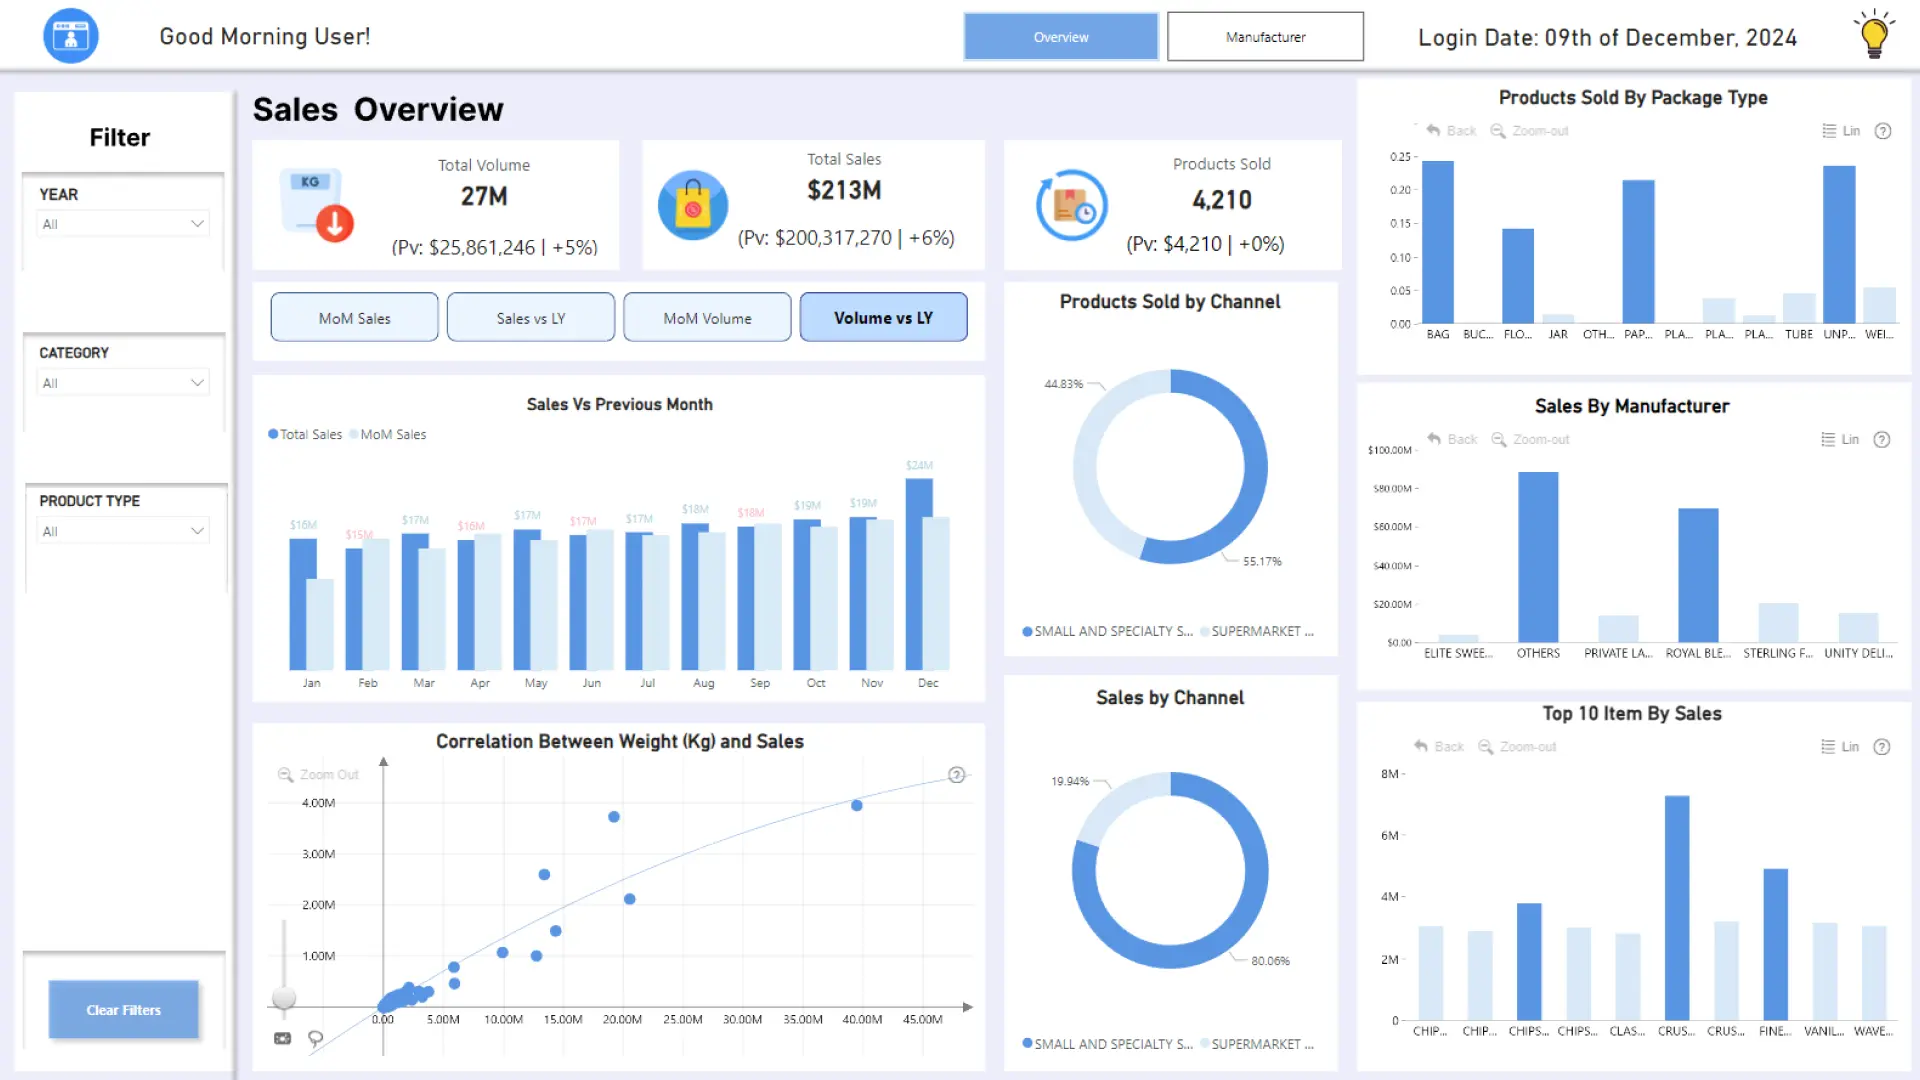
A Candy Sales Performance dashboard that provides actionable insights into key metrics such as total sales, volume, and product performance. The first page of the dashboard offers an interactive overview of key sales metrics, trends, and breakdowns, including total volume, total sales, and product performance by channel, manufacturer, and package type. The second page, titled 'Manufacturer Performance,' delivers a detailed analysis of sales and volume performance by manufacturer, product type, and channel, along with trends, market share, and top-performing items. Here's how it empowers decision-making:
✅ Tracks MoM trends for sales, volume, and product growth.
✅ Highlights top-performing brands, channels, and product types.
✅ Visualizes market share and identifies correlations, such as weight vs. sales.
✅ Interactive filters for detailed exploration by category, manufacturer, and more.
Mobile view allows you to interact with the report. To Download the template please switch to desktop view.
