Feel free to leave your vote:
4
Share template with others
Summary
Report submitted for the FP20 Analytics ZoomCharts Challenge, November 2024. The report was built using the Candy Market Share dataset and includes ZoomCharts custom Drill Down PRO visuals for Power BI.
Author's description:
This Power BI report provides a comprehensive analysis of the candy market, focusing on key performance metrics such as revenue, quantity sold, and overall market share. It is designed to help stakeholders understand market dynamics, identify top-performing products, and make data-driven decisions.
Pages in the Report:
-
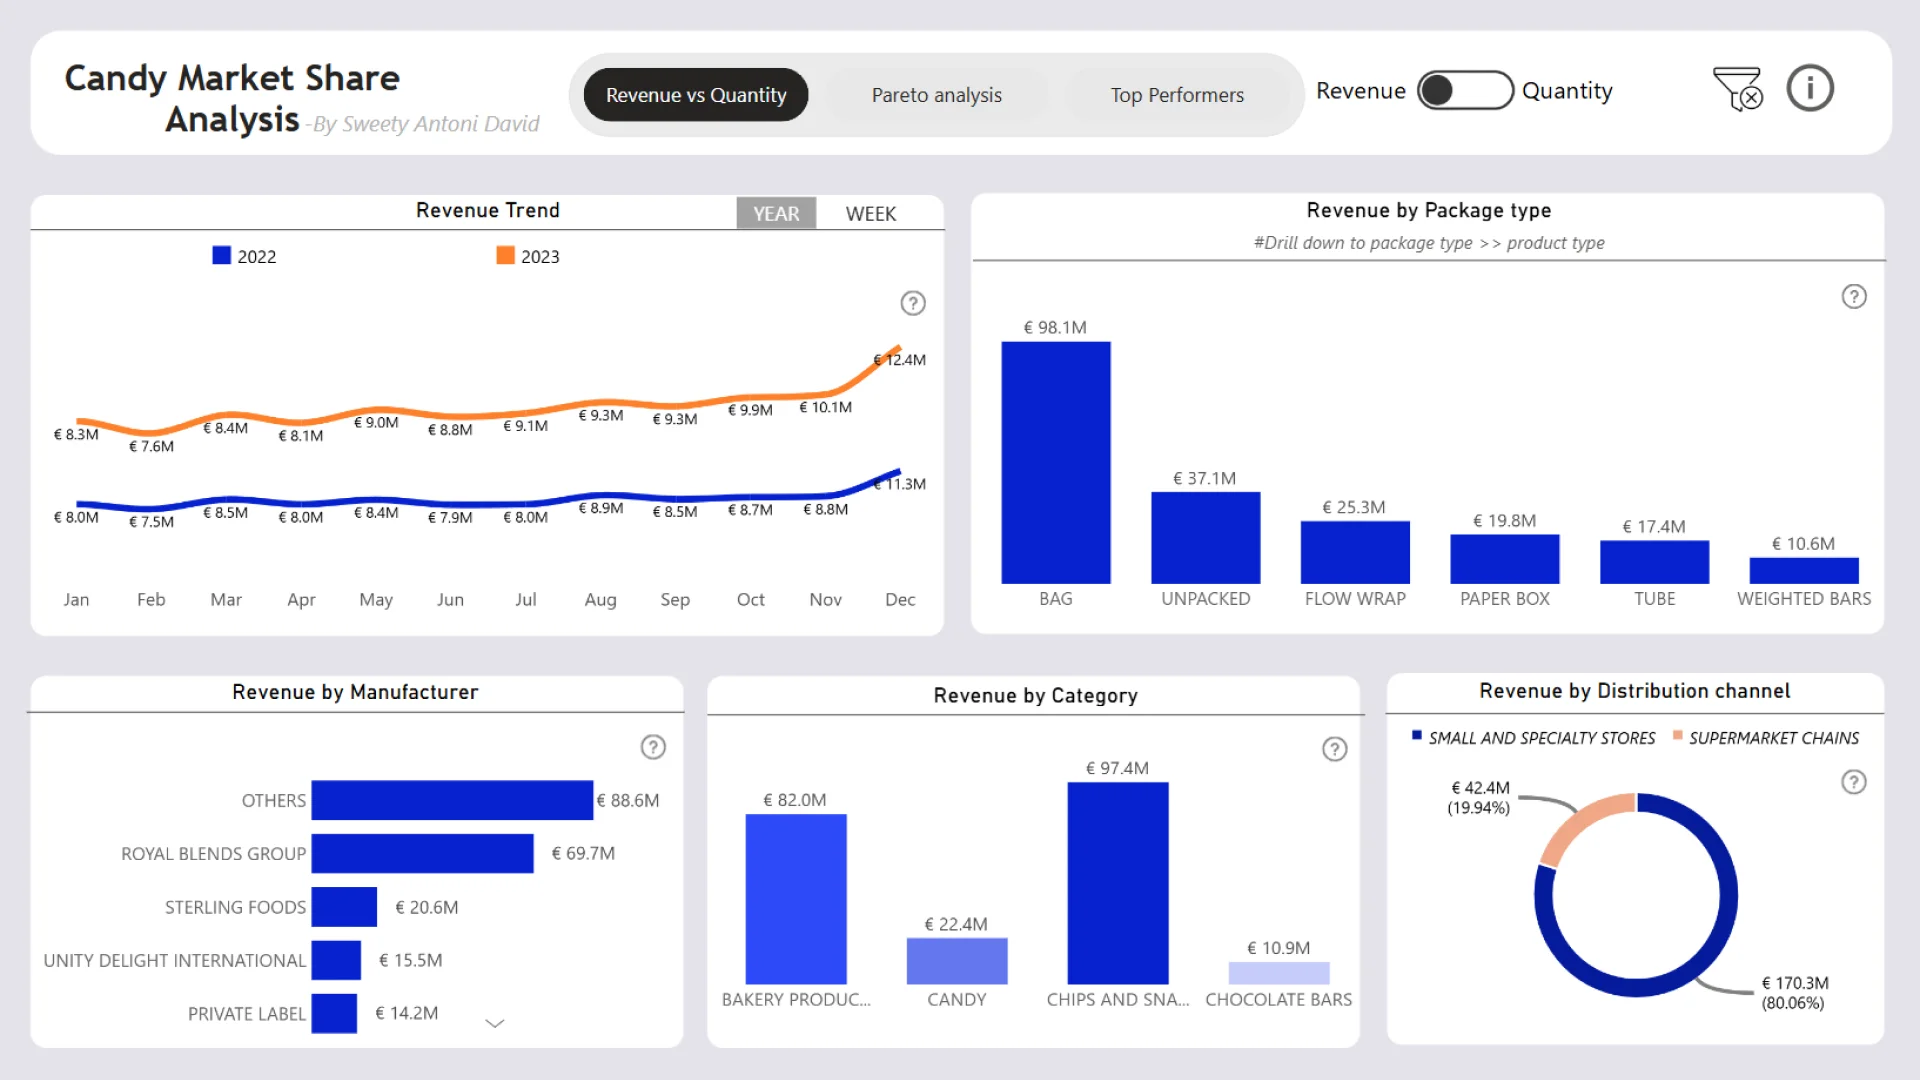
Revenue vs Quantity:
This page visualizes the relationship between revenue and quantity sold across various candy products. Interactive charts highlight trends, enabling users to analyze the correlation between sales volume and revenue performance. -
Pareto Analysis:
The Pareto Analysis page presents an 80/20 rule visualization, identifying the top 20% of products contributing to 80% of the market share. This analysis helps businesses prioritize high-impact products and optimize their focus on the most profitable market segments. -
Top Performers:
The Top Performers page highlights the leading candy products in terms of sales and revenue, providing insights into the most successful offerings in the market.
Mobile view allows you to interact with the report. To Download the template please switch to desktop view.
