Feel free to leave your vote:
18
Share template with others
Summary
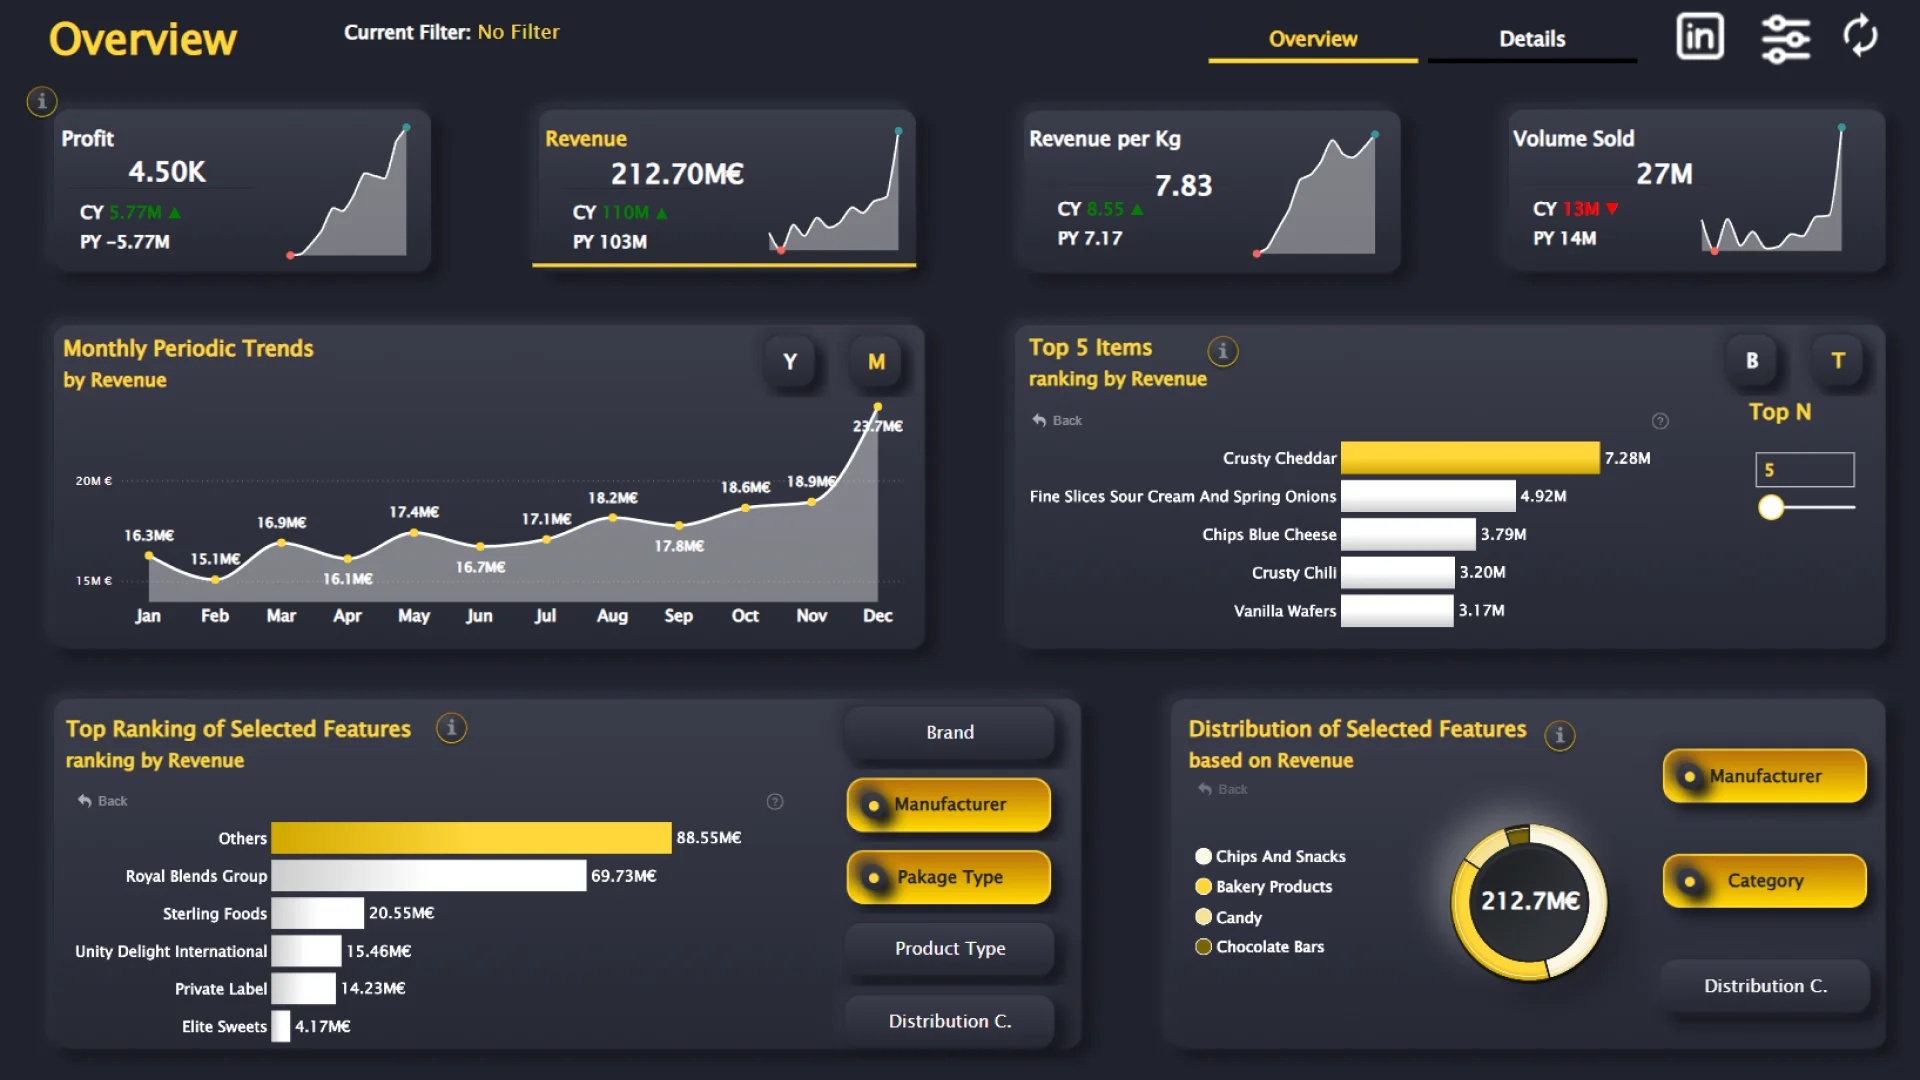
Report submitted for the FP20 Analytics ZoomCharts Challenge, November 2024. The report was built using the Candy Market Share dataset and includes ZoomCharts custom Drill Down PRO visuals for Power BI.
Author's description:
This Power BI dashboard provides insights into candy market trends, analyzing chocolate content, fruity flavors, caramel presence, price, and overall popularity. It enables stakeholders to identify top-performing candies, optimize pricing strategies, and understand flavor preferences for informed decision-making in the confectionery market.
Mobile view allows you to interact with the report. To Download the template please switch to desktop view.
