Feel free to leave your vote:
7
Share template with others
Summary
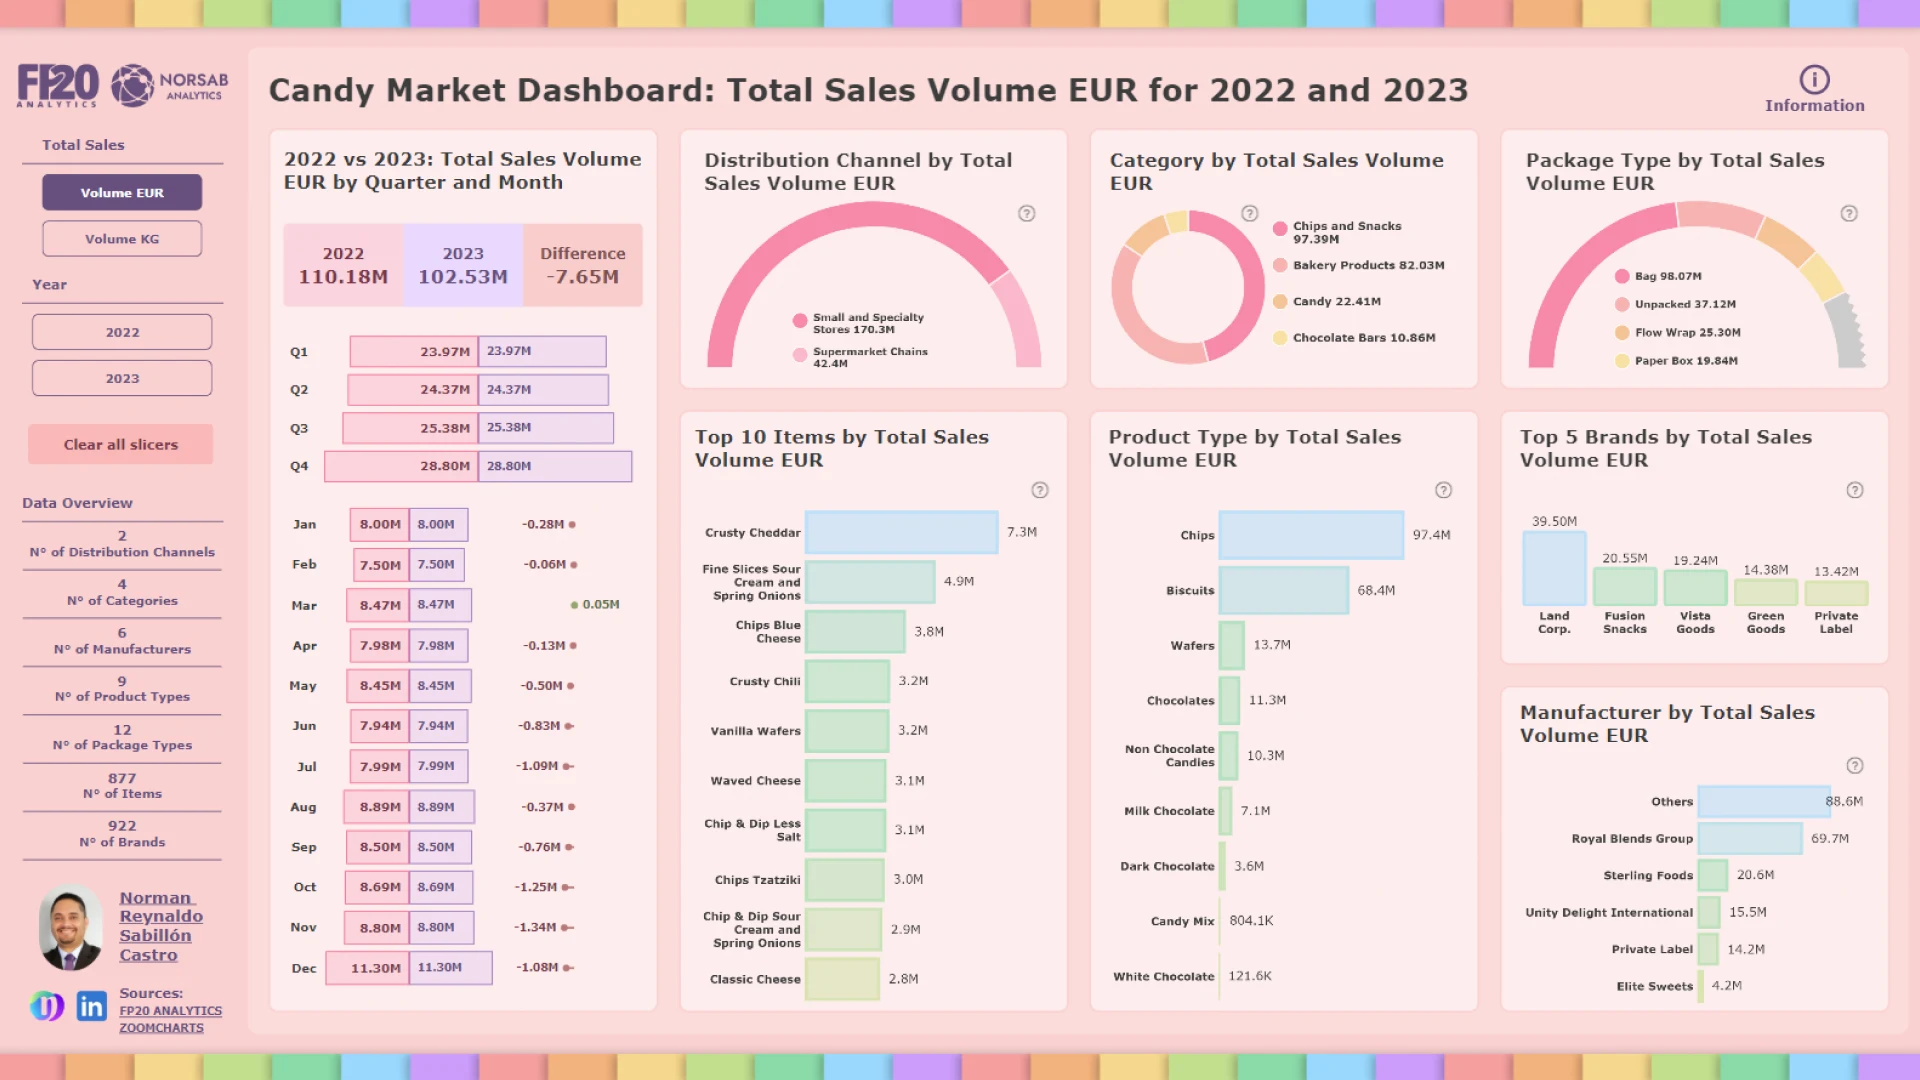
Report submitted for the FP20 Analytics ZoomCharts Challenge, November 2024. The report was built using the Candy Market Share dataset and includes ZoomCharts custom Drill Down PRO visuals for Power BI.
Author's description:
’ve created the Candy Market Dashboard, a fun and interactive solution for analyzing the confectionery industry. It includes comparisons between 2022 and 2023 for key metrics, showing differences with dynamic visuals such as pyramids, bar charts, and error bars. You can explore the top 10 items, top 5 brands, and breakdowns by product type, manufacturer, and package type, with options to navigate through grouped visuals. There are gauges and a donut chart to visualize proportions, along with flexible filters to switch between EUR or KG volumes, specific years, or combined views. Lastly, the Data Overview section provides a summary of the dataset and the market landscape.
Mobile view allows you to interact with the report. To Download the template please switch to desktop view.
