logo
For Power BI Report Templates
  • Products

    Drill Down Visuals for Power BI

    Discover the most customizable custom visuals for Power BI.

    Pricing & licensing
    • Drill Down Donut Pro
      Drill Down Donut Category Composition
    • Drill Down Pie Pro
      Drill Down Pie Proportional Breakdown
    • Drill Down Combo Pro
      Drill Down Combo Multi-Metric Trends
    • Drill Down Combo Bar Pro
      Drill Down Combo Bar Cross-Metric Trends
    • Drill Down Line Pro
      Drill Down Line Trend Analysis
    • Drill Down Bubble Pro
      Drill Down Bubble Value Relationships
    • Drill Down Scatter Pro
      Drill Down Scatter Correlation Analysis
    • Drill Down Network Pro
      Drill Down Network Entity Connections
    • Drill Down Graph Pro
      Drill Down Graph Relationship Mapping
    • Drill Down Map Pro
      Drill Down Map Geographic Insights
    • Drill Down Waterfall Pro
      Drill Down Waterfall Change Breakdown
    • Drill Down Timeline Pro
      Drill Down Timeline Time-Based Metrics
    • Drill Down TimeSeries Pro
      Drill Down TimeSeries Temporal Patterns
    • Drill Down Line Pro
      Drill Down Line Trend Analysis

    Visuals in Planning

    Discover visuals we’re exploring, share your feedback, and help us decide what to build next.

    Browse concepts
  • Template Reports
    • Browse Report Templates
      Browse Report Templates Explore 2000+
      Power BI reports
    • Pricing Report Templates
      unlimited access

    Explore Report Templates

    Industry

    • Logistics
    • Education
    • Healthcare
    • Transportation
    • Banking
    • Ecommerce
    • Crime analytics
    • Retail
    • Manufacturing

    Business Domain

    • Sales
    • Marketing
    • Accounting & Finance
    • Human Resources
    • Research
    • Project Management
    • CRM
    • Support
    • Customer experience
  • Resources

      Learn

    • Video Tutorials Step-by-step Power BI guides
    • Webinars Live and recorded expert sessions
    • Visuals Gallery Explore all custom Power BI visuals
    • Blog Power BI tips, updates, and guides
    • Documentation Setup, features, and API reference

    Support

    • ZoomCharts Assistance Help from our product experts
    • Contact Sales Questions about pricing or licensing
    • Contact Support Technical help and troubleshooting
    • FAQ Quick answers to common questions
  • Services
    • Power BI Report Development
      Power BI Report Development End-to-end custom
      Power BI reports.
    • Custom Visual Development
      Custom Visual Development Custom visuals for
      your business needs.
  • Challenges
  • Pricing
Request a quote Get Developer License Sign in
Request a quote Book a Demo Get Developer License Sign in
Get it now
Go back

Contents

Reset your password

We'll email you instructions on how to reset your password

Go back

Share

Logo

Challenge 37: Procurement Analytics in Power BI

Apr 17 - May 22, 2026 | EDT

Analyze procurement data in this Power BI challenge using purchase order data from 2022–2024. Explore spend trends, supplier performance, and build interactive dashboards for smarter decisions.

Timeline

Registration Open

Registration Open

17 April | 07:00

-

Submissions Open

Submissions Open

17 April | 07:00

-

Workshop | Power BI Workshop: How to Visualize Procurement Data

Workshop | Power BI Workshop: How to Visualize Procurement Data

23 April | 08:00

-

1:1 Mentoring Sessions

1:1 Mentoring Sessions

23 April | 08:00

17 April - 18 May

Entry Submission Deadline

Entry Submission Deadline

18 May | 19:59

17 April - 18 May

Webinar | Explore the Top 5 Power BI Reports for Procurement Analysis

Webinar | Explore the Top 5 Power BI Reports for Procurement Analysis

22 May | 06:00

17 April - 18 May

Winner Announced

Winner Announced

22 May | 07:00

17 April - 18 May

Dataset

Get the dataset

See past FP20 Analytics challenges

See past challenges

Share the challenge

Submitted Reports
About challenge
How to participate
The Brief
Judging criteria
Timeline
Dataset
Past challenges

Winner of the challenge

Report Card

Power BI Procurement Spend Dashboard

Author: Nina Ikpe

37

View Report

All Submissions

Report Card

Procurement Performance Analytics Report

Author: Jude Onuh

32

View Report
Report Card

Procurement Performance Analytics Report

Author: Agbata Dickson Ukolojo

28

View Report
Report Card

Power BI Procurement Analytics Dashboard

Author: BabaJide Felix

17

View Report
Report Card

Procurement Risk Analytics Dashboard

Author: Anna Andrzejewska

3

View Report
Report Card

Procurement Spend Optimization Dashboard

Author: Steven Stanford

1

View Report
Report Card

Procurement Budget vs Actual Dashboard

Author: Akashdeep Dam

2

View Report
Report Card

Maverick Spend Analysis Dashboard

Author: Lakshi Weerakkodige

0

View Report
Report Card

Procurement Risk Analytics Dashboard

Author: Karan Kumar

0

View Report
Report Card

Procurement KPI Dashboard

Author: Gyanankur Baruah

0

View Report
Report Card

Power BI Procurement Analytics Dashboard

Author: Crystal Andrea Dsouza

3

View Report
Report Card

Supplier Spend Analysis Dashboard

Author: Ntow Prince Yaw

0

View Report
Report Card

Procurement Spend Analytics Report

Author: Nnamdi Nwankwo

1

View Report
Report Card

Procurement Savings Dashboard

Author: Vincensius Prase

0

View Report
Report Card

Supplier Risk and Spend Dashboard

Author: Tobiloba Sakote

1

View Report
Report Card

Power BI Procurement Performance Report

Author: Fathiat (Abimbola) Odutayo

0

View Report
Report Card

Supplier Risk and Spend Dashboard

Author: Oluwatomisin Gift Oluwatoyin

0

View Report
Report Card

Procurement Insights Dashboard

Author: Ugochukwu Nwasuruba

0

View Report
Report Card

Procurement Spend Analysis Dashboard

Author: Yasmeen Amjad

0

View Report
Report Card

Supplier Risk and Spend Dashboard

Author: Shahnaj Islam

0

View Report
Report Card

Supplier Performance Dashboard in Power BI

Author: Gbenga Emmanuel Popoola

0

View Report
Report Card

Power BI Procurement KPI Report

Author: Vic Yao

1

View Report
Report Card

Supplier Spend Analysis Dashboard

Author: Brian Ochigbo Sule

1

View Report
Report Card

Power BI Supplier Performance Report

Author: Mohammad Amir

0

View Report
Report Card

Procurement Spend Optimization Dashboard

Author: Endre Balazs

0

View Report
Report Card

Power BI Procurement Performance Report

Author: Ceejhay Panganiban

1

View Report
Report Card

Procurement Budget vs Actual Dashboard

Author: Akindele Omolayo

1

View Report
Report Card

Supplier Risk and Spend Dashboard

Author: Suleman Abdulmalik

1

View Report
Report Card

Procurement Risk Analytics Dashboard

Author: Hasan Ayaz

1

View Report
Report Card

Procurement Compliance Dashboard

Author: Yuvaraj M

0

View Report
Report Card

Procurement Spend Analytics Report

Author: Iheanyi Emenike

2

View Report
Report Card

Power BI Supplier Performance Report

Author: Naveen Rawat

3

View Report
Report Card

Power BI Supplier Performance Report

Author: Anjali Dashora

0

View Report
Report Card

Procurement Savings Dashboard

Author: Anuoluwapo Odunayo Aliu

1

View Report
Report Card

Procurement Budget Analysis Dashboard

Author: Akhilesh Raut

0

View Report
Report Card

Supplier Spend Analysis Dashboard

Author: Joshua Achire

0

View Report
Report Card

Procurement Insights Dashboard

Author: Rigoberto Garcia

0

View Report
Report Card

Procurement Insights Dashboard

Author: Ebenezer Ogundaisi

0

View Report
Report Card

Power BI Procurement Spend Dashboard

Author: Mercy (Kehinde) Babatunde

1

View Report
Report Card

Procurement KPI Dashboard

Author: Saw Nwe

0

View Report
Report Card

Supplier Performance Dashboard in Power BI

Author: Manav Gulati

1

View Report
Report Card

Procurement Spend Analysis Dashboard

Author: Mohamed Elbushra

1

View Report
Report Card

Power BI Procurement KPI Report

Author: Marina H

0

View Report
Report Card

Power BI Procurement KPI Report

Author: Abhijit Basak

2

View Report
Report Card

Power BI Procurement KPI Report

Author: Israel Oladapo

1

View Report
Report Card

Maverick Spend Analysis Dashboard

Author: Alani Joshua

0

View Report
Report Card

Procurement Spend Optimization Dashboard

Author: Abdullah El-Gohary

0

View Report
Report Card

Power BI Procurement Performance Report

Author: Vladimir Hernandez

0

View Report
Report Card

Procurement Budget vs Actual Dashboard

Author: Emmanuel Idowu

0

View Report
Report Card

Power BI Procurement Analytics Dashboard

Author: Iyabo Sindiku

2

View Report
Report Card

Power BI Procurement Analytics Dashboard

Author: Anjali K

0

View Report
Report Card

Power BI Procurement KPI Report

Author: Syed Daniyal Ahmed

0

View Report
Report Card

Procurement Spend Optimization Dashboard

Author: Samim Imtiaz

0

View Report
Report Card

Procurement Budget vs Actual Dashboard

Author: Ankan Bandyopadhyay

0

View Report

🏆 Main ZoomCharts Prize: $300 Amazon Gift Card 

🏆 FP20 Analytics Community prizes from Skillwave, The Data Vis Force, and Enterprise DNA

About the FP20 Analytics ZoomCharts Data Challenge

Dive into the dataset, build a Power BI report, practice your data visualization skills, and compete for prizes.

Want to build professional Power BI reports and grow your portfolio?

This challenge helps you level up with expert feedback, hands-on workshops, webinars with MVPs, and visibility in our public results showcase. It’s a great way to learn, gain recognition, and connect with a supportive data community.

The challenge is hosted in partnership with FP20 Analytics - a LinkedIn community that brings together 22k+ passionate data professionals and helps new analysts improve their craft. It’s a welcoming space where you can practice, learn, and share your work with others. Learn more about the FP20 Analytics challenge on their website.


Benefits of joining the challenge

➤ Live Workshops & 1:1 Mentoring

Learn directly from experienced Power BI professionals. Enjoy practical workshops on report-building techniques and book a one-on-one mentoring session to receive tailored advice on your submission.

➤ Personalized Feedback

Every participant receives detailed, constructive feedback on their report. It’s a valuable opportunity to improve your skills with real insights from seasoned analysts.

➤ Free ZoomCharts Custom Visuals License

All participants receive a ZoomCharts Developer License, giving you full access to the Drill Down PRO visuals library.

➤ Free Report Downloads

Each challenge participant with a validated report will receive 5 free downloads from the Power BI Report Gallery.


Prizes 🏆

  • The best report using ZoomCharts visuals will receive a $300 Amazon Gift Card.
  • Being selected in the Top 5 will grant you +10 free downloads from the Power BI Report Gallery.
  • All participants of the FP20 Analytics challenge also compete for amazing prizes from Skillwave, The Data Vis Force, and Enterprise DNA

The winners will be announced during a special live webinar. See all webinars. Join the live winner announcement and top submissions review.


Webinar recordings

Recording thumbnail

Power BI Workshop: How to Visualize Procurement Data

In this hands-on session, we’ll go through the procurement dataset and build a Power BI report step by step, focusing on spend, suppliers, and delivery performance.

Watch the recording
Recording thumbnail

Explore the Top 5 Power BI Reports for Procurement Analysis

We’ll walk through the top 5 submissions from the challenge and talk through what works, what could be improved, and different ways people approached the same dataset.

Watch the recording

How to Participate in the FP20 Analytics & ZoomCharts Challenge


1. Register for the Challenge

  • Register using the form above on this page.

  • Download the dataset using the "Get the Dataset" button on this page.

  • Read the challenge brief in the "The Brief" section to understand the data and requirements.

  • Activate your free Drill Down Visuals Developer License for Power BI. (watch the setup video or follow the step-by-step instructions).


2. Build Your Report in Power BI

  • Add your ZoomCharts Developers license to Power BI Desktop.

  • Add ZoomCharts visuals from the Power BI visuals library or Microsoft Marketplace.

  • Build your report using the challenge dataset.

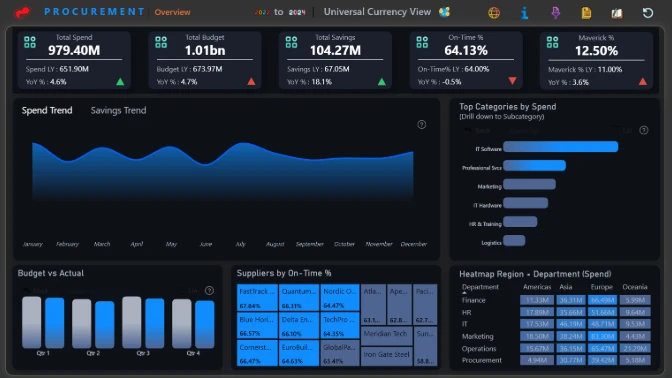
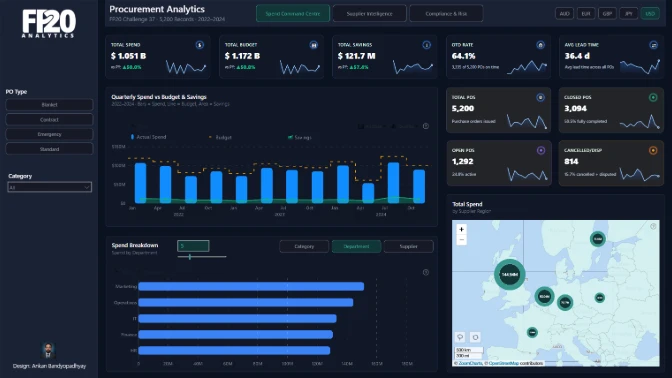
  • Recommended report format:

    • Up to 3 pages (including any drill-through pages)

    • Canvas size: 16:9 (default) or 1920 × 1080 (Full HD)

    • Your report must include at least two ZoomCharts Drill Down Visuals on the same page.

3. Improve Your Report and Learn New Skills

  • Join the challenge workshop to learn how to use the dataset

  • If you need help, book a free 1-on-1 consultation with the ZoomCharts team to discuss your report

  • Look at previous challenge submissions for ideas and inspiration in the report gallery.


4. Submit Your Challenge Entry

  • Log in to your account on this page and upload your report in .pbix format for validation.

  • If your report does not meet all requirements:
    You will receive an email explaining what needs to be fixed.
    You can update your report and submit it again.

Validation timeline:

  • Your report will be reviewed within 1–2 business days.

  • Once validated, you will receive a Publish to Web link that you can use in your portfolio or share online.

  • You will also receive personalized feedback within 1–2 business days to help you improve your report.

Note:
You may resubmit your entry as many times as needed before the challenge deadline.


5. Finalize Your Participation to Compete for the ZoomCharts Grand Prize

To be eligible for all prizes, complete these steps:

  1. Post the final version of your report (PDF) on your LinkedIn profile.

  2. Use this caption:
    "I am participating in FP20 Analytics ZoomCharts Challenge 37"

  3. Include a short summary of your report and the Publish to Web link (if you have one).

  4. Use the hashtags #FP20Analytics and #builtwithzoomcharts and tag @Federico Pastor and @ZoomCharts.

  5. Obligatory! Share your report also in the FP20 Analytics LinkedIn Community group.

  6. Follow ZoomCharts on LinkedIn.

  7. Rate ZoomCharts visuals at Microsoft Marketplace.

6. Attend the Live Closing Webinar

  • The ZoomCharts team reviews and analyzes the Top 5 challenge submissions during the live webinar.

  • You will learn best practices, visualization tips, and new Power BI skills.

  • The winner of the best report receives a $300 Amazon gift card from ZoomCharts.

Technical requirements

  • Build your report using Power BI
  • The recommended number of pages in the report is up to 3 pages, including drill-through pages.
  • Canvas size is 16:9 (Default Power BI size) or Full HD size = w:1920 - h:1080 
  • The report should contain at least 2 ZoomCharts Drill Down visuals within at least one page. See a practical guide for using Drill Down PRO visuals.

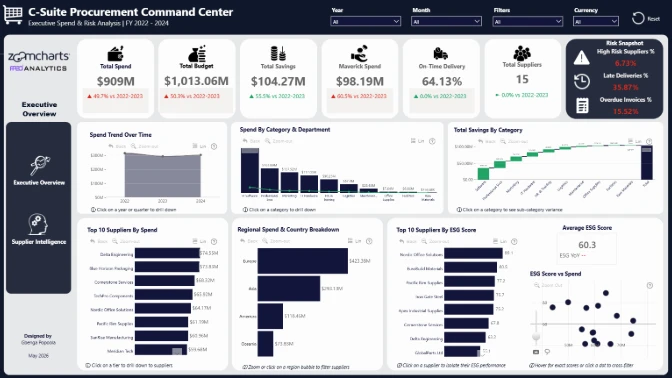
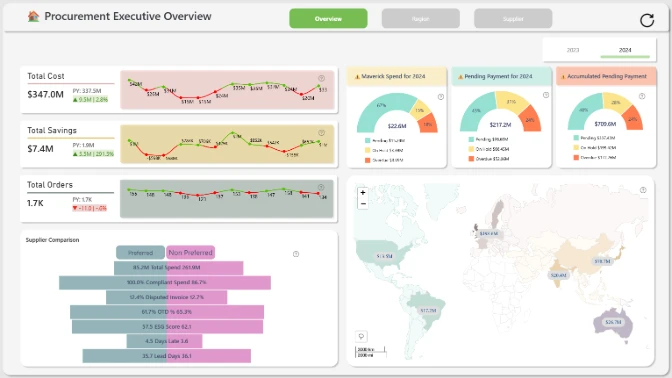
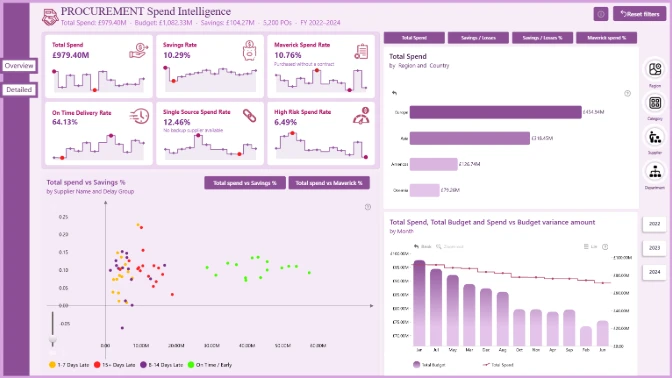
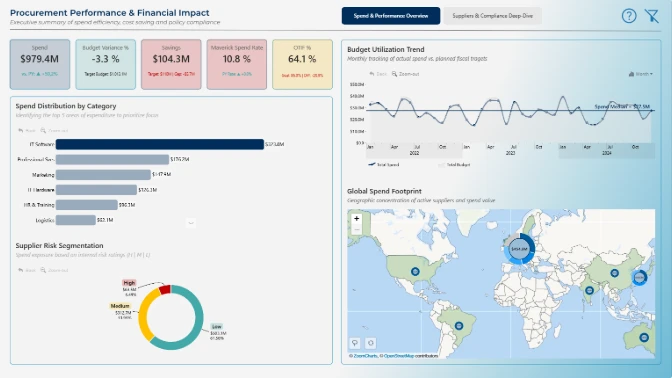
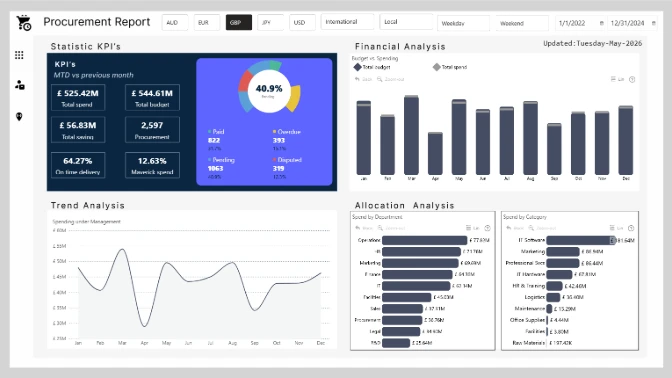
Procurement Data Analytics Challenge

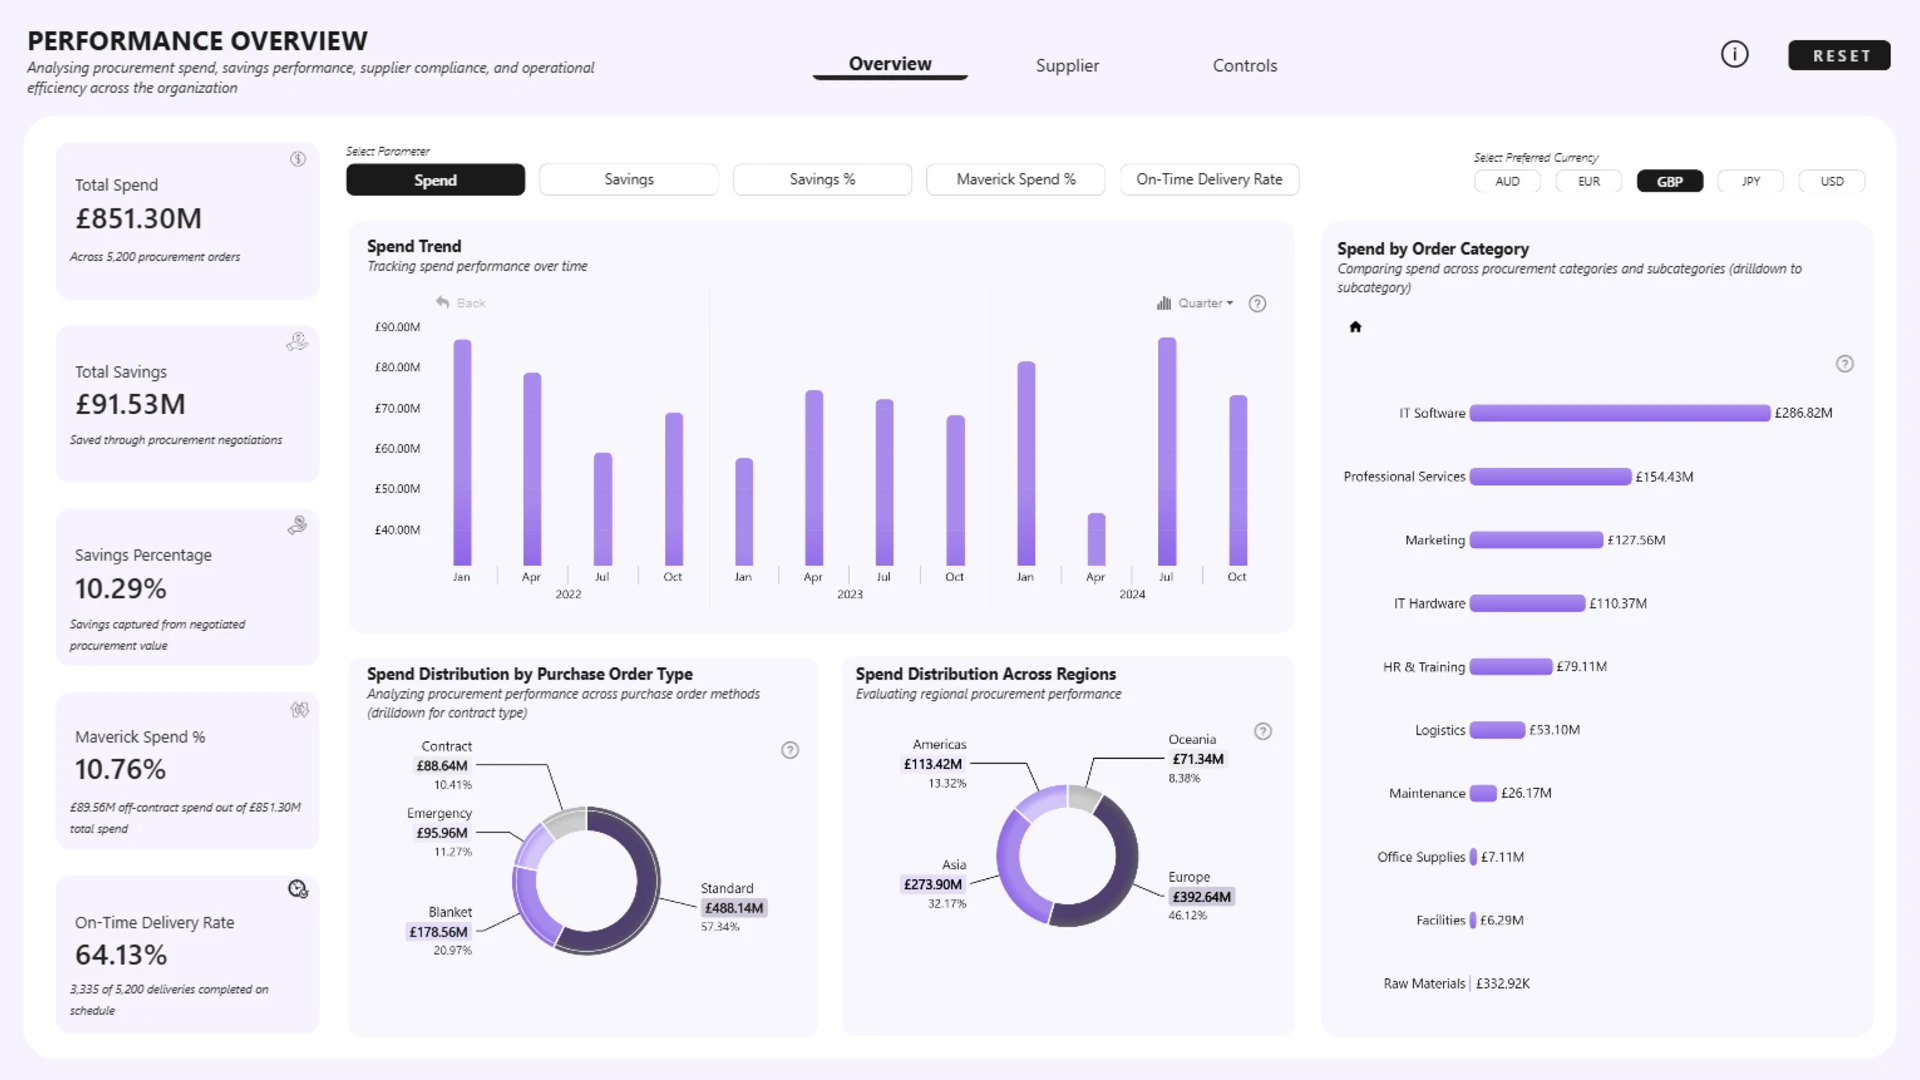
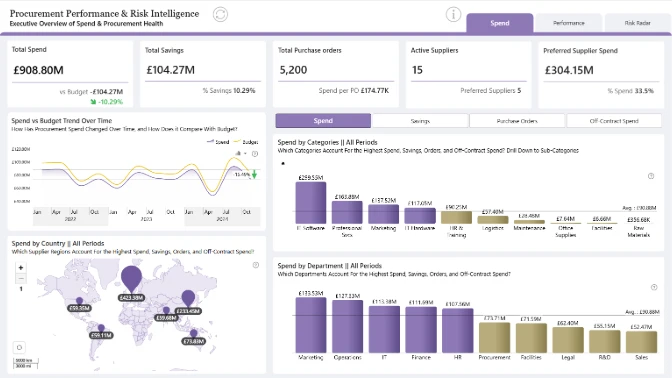
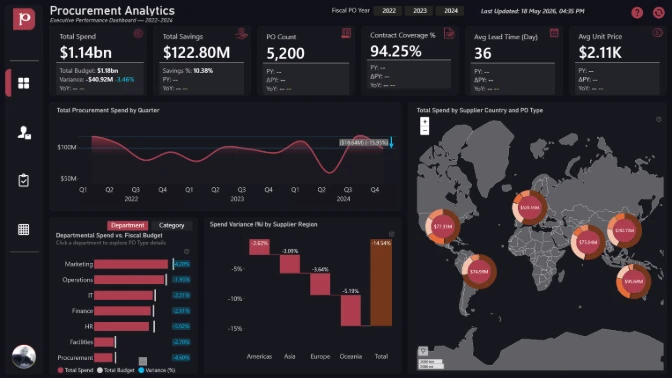
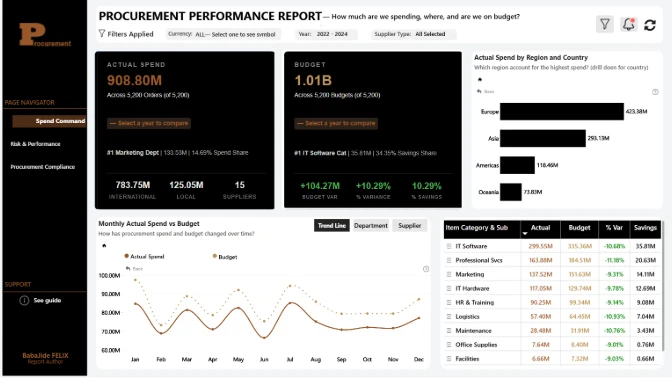
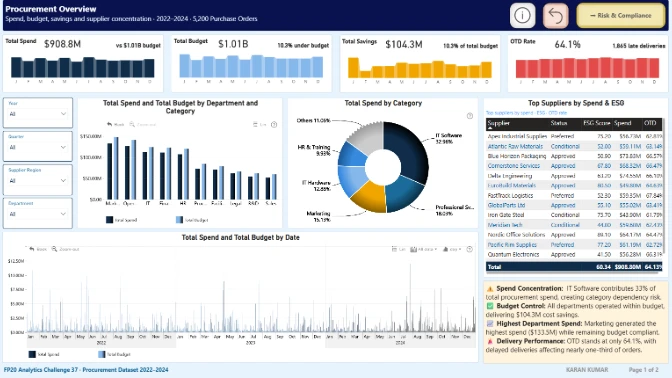
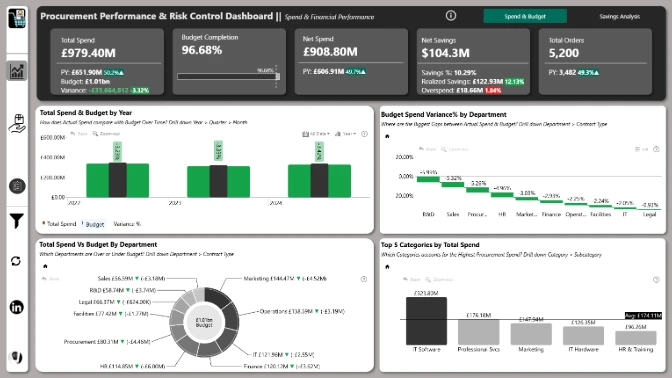
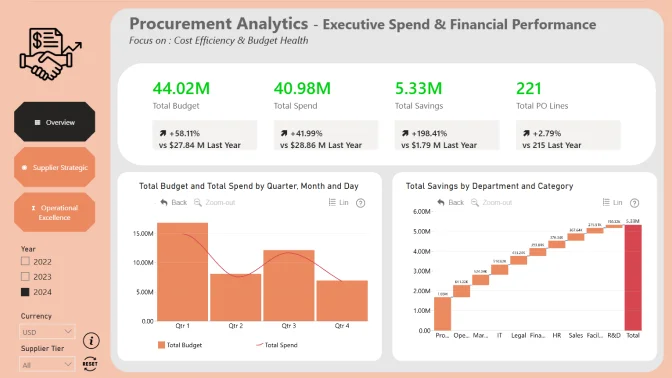
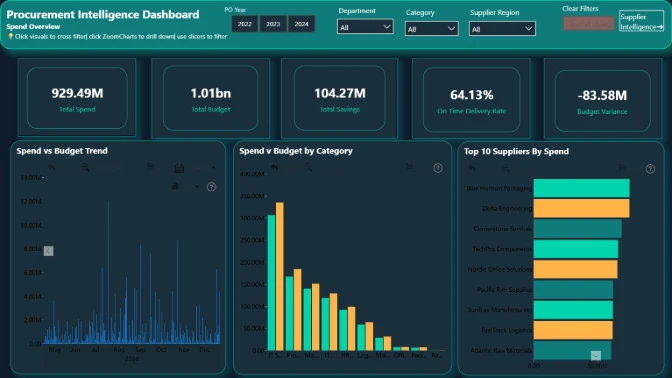
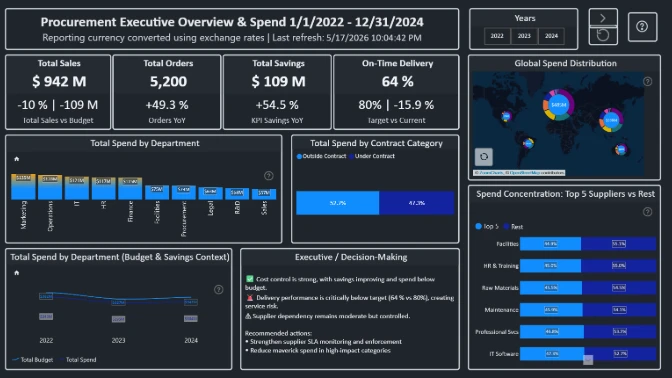
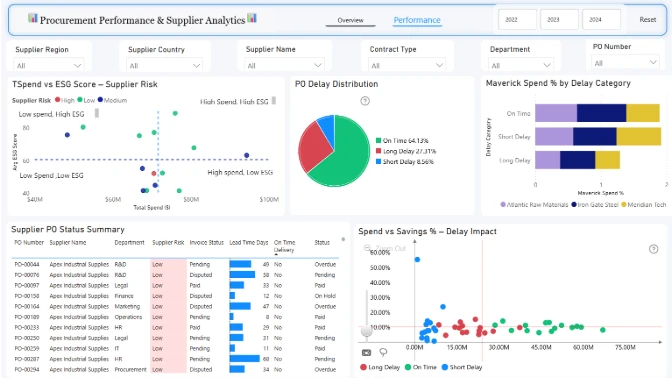
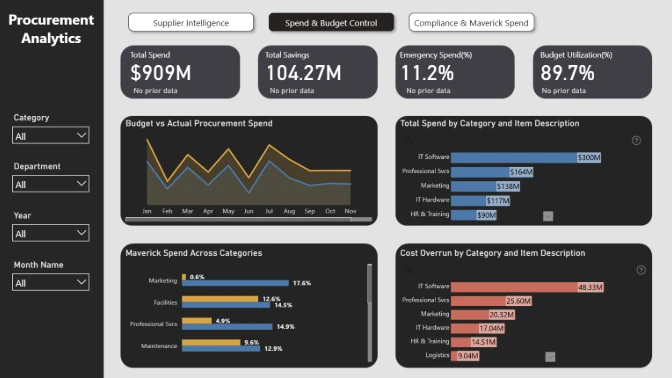
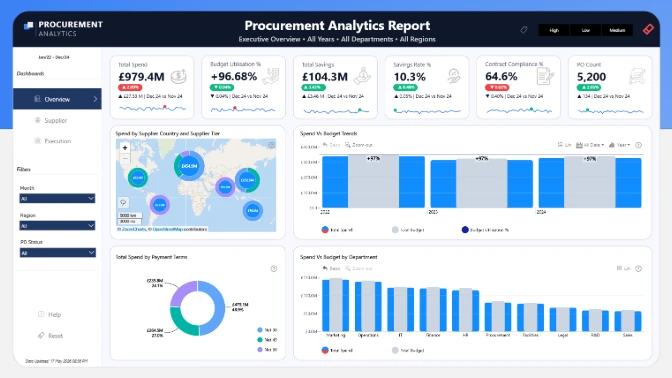
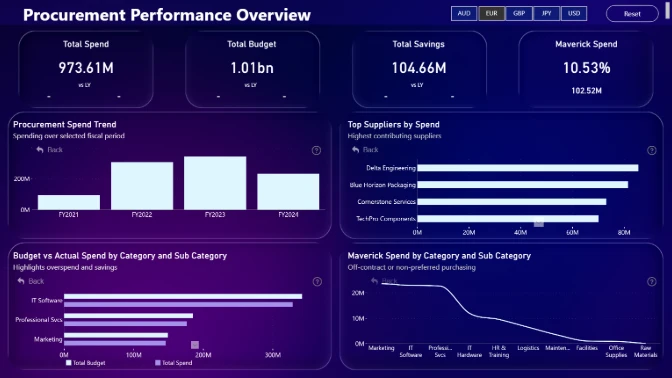
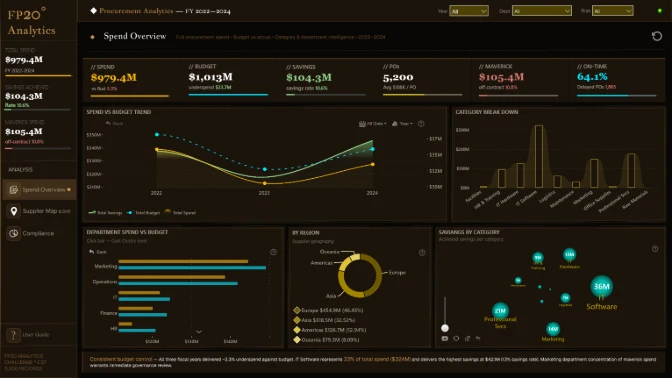
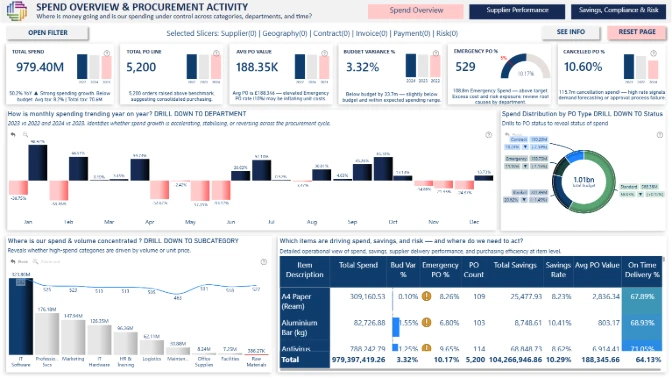
In this challenge, participants will work with a procurement dataset covering purchase order activity from 2022 to 2024. The dataset includes 5,200 procurement records and brings together information across purchasing transactions, suppliers, contracts, delivery performance, invoices, payments, budgets, and savings.

Procurement teams keep organizations running by purchasing the goods and services needed for daily operations. In reality, rising costs, supplier risk, delivery delays, and off-contract spending can create budget pressure and inefficiencies. This analysis helps leaders understand spending patterns, monitor supplier performance, track savings, and identify compliance issues. With better visibility into procurement data, organizations can reduce risk, improve efficiency, and make more informed business decisions.


Key Questions to Explore

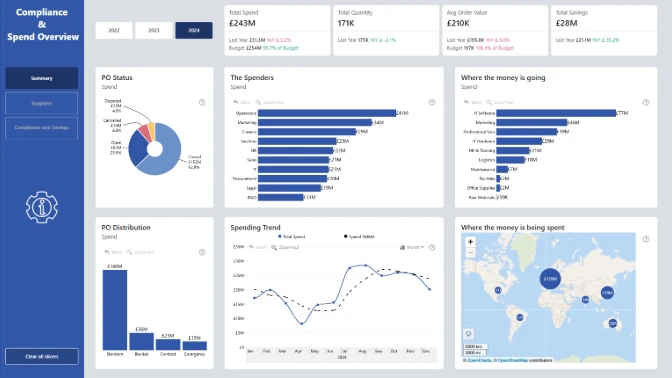
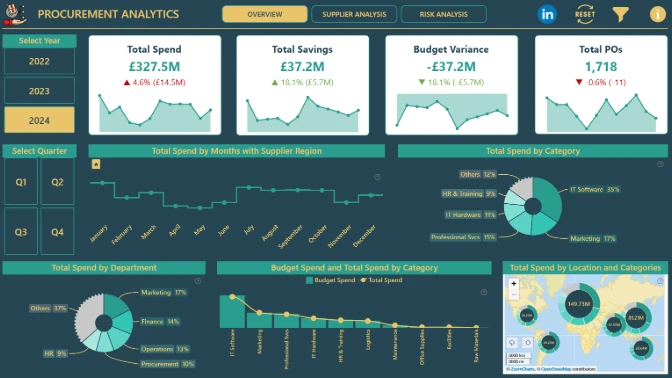
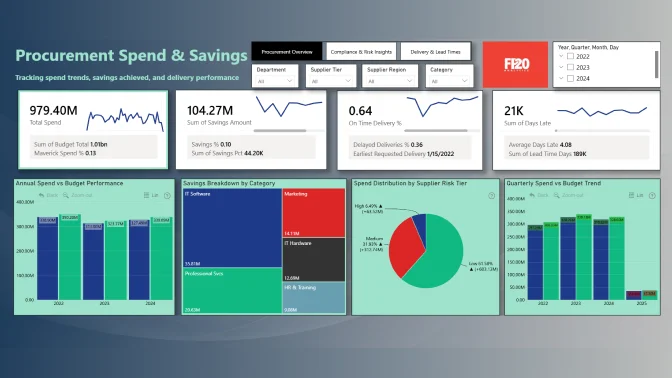
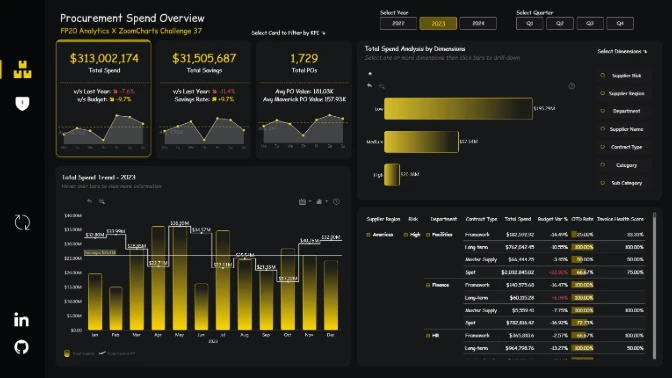
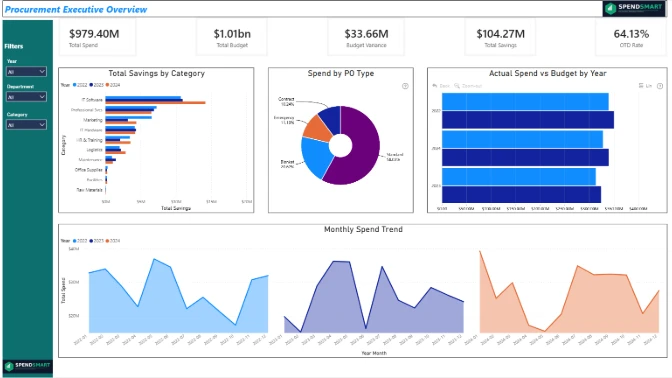
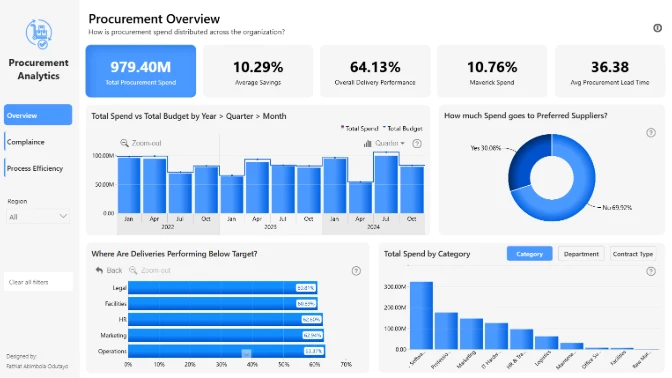
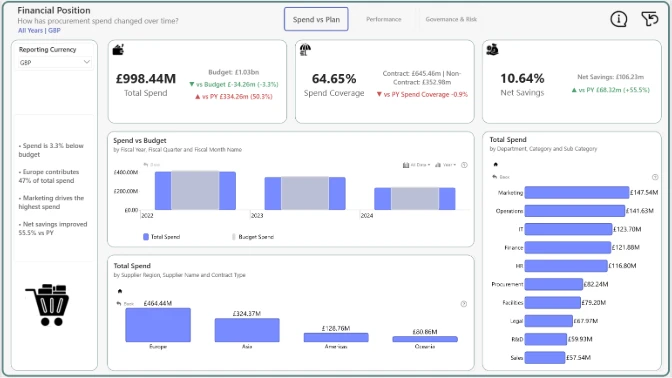
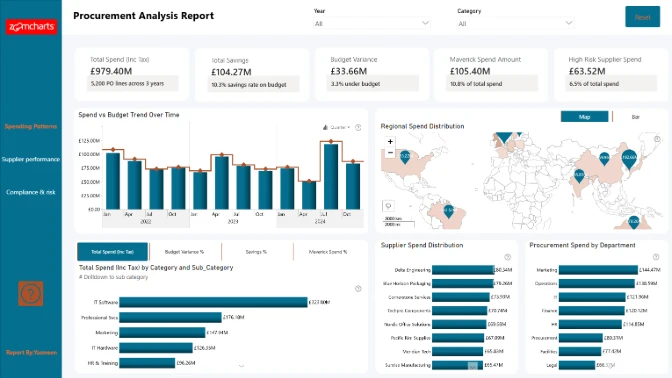
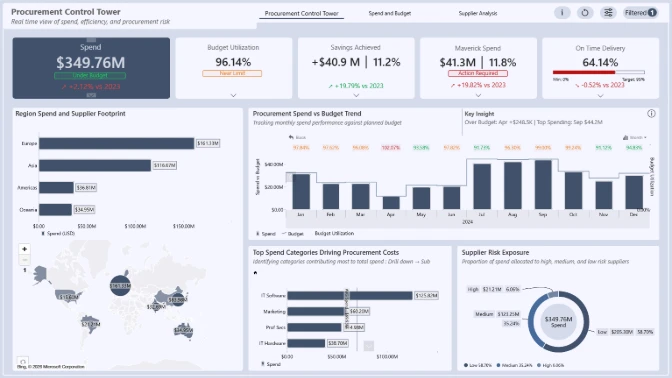
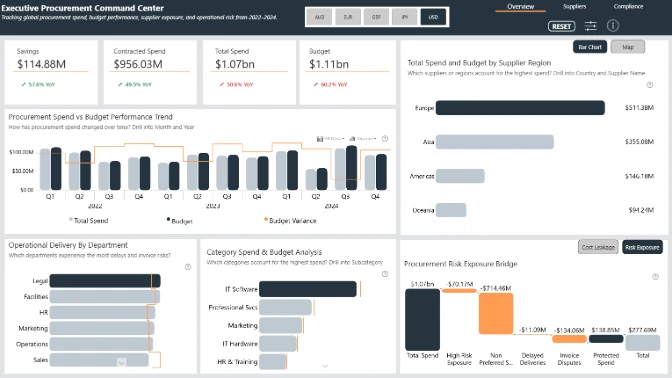
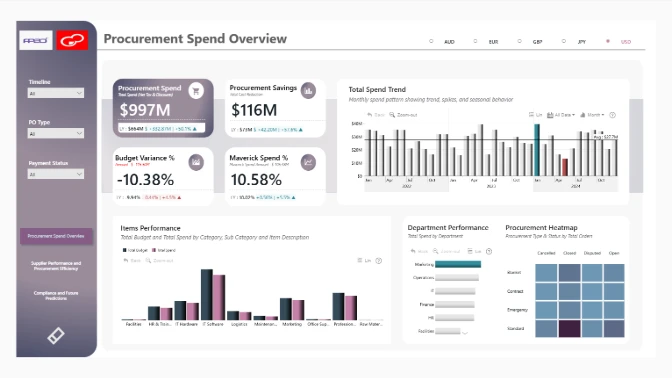
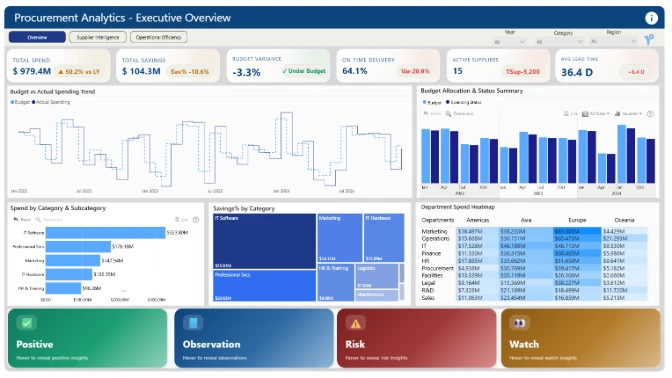
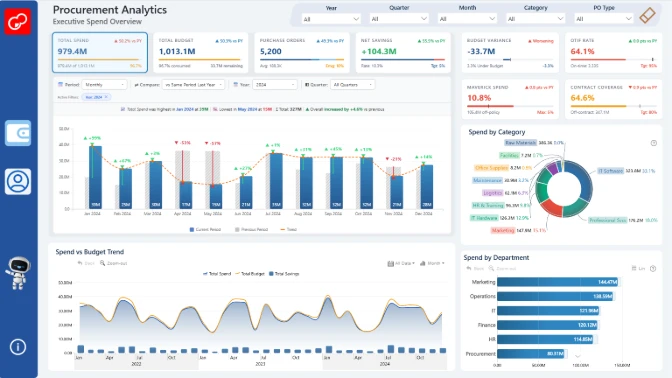
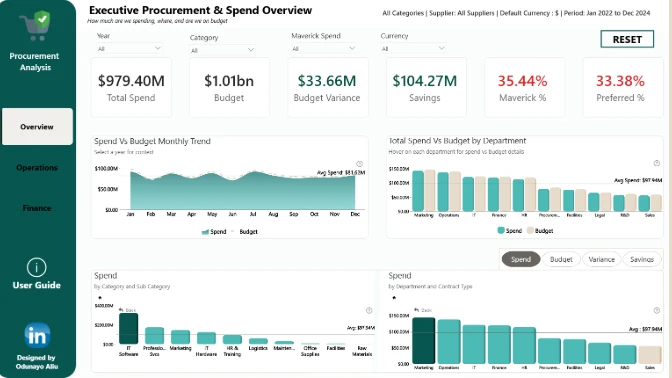
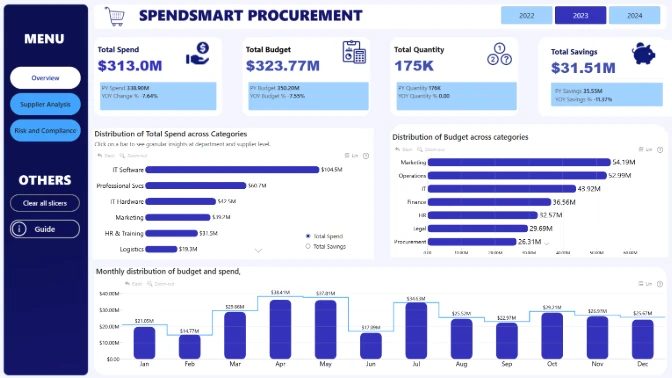
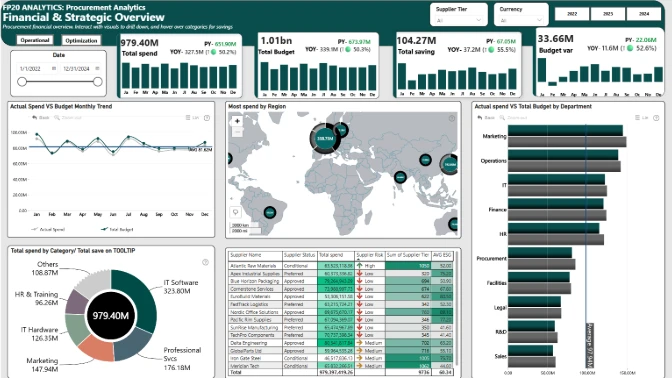
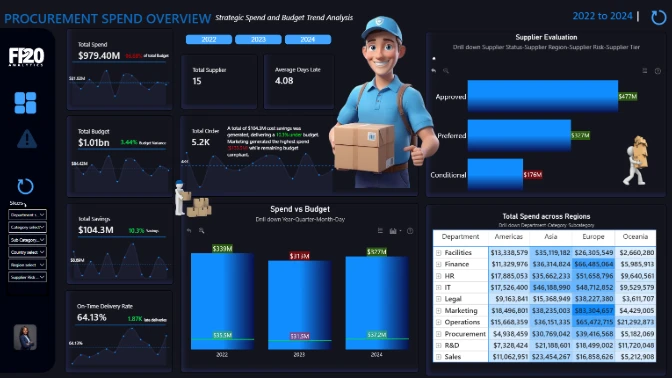
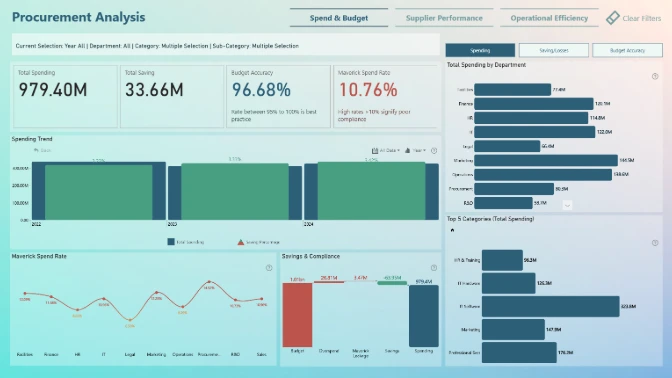
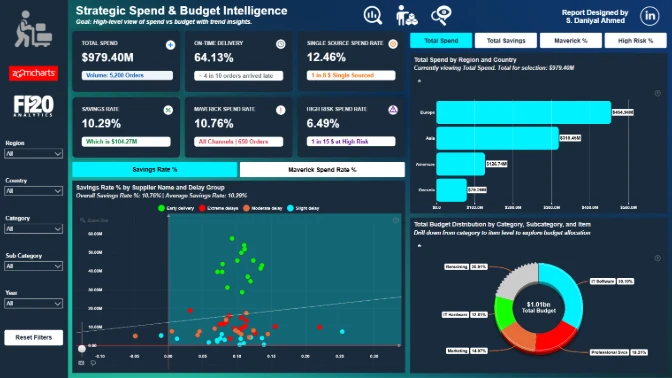
  • How has procurement spend changed over time?
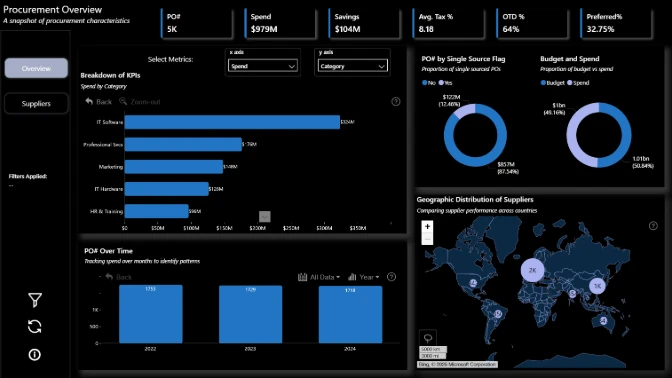
  • Which categories, departments, suppliers, or regions account for the highest spend?
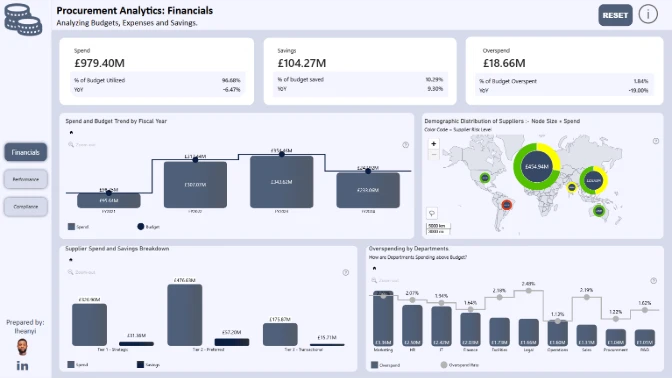
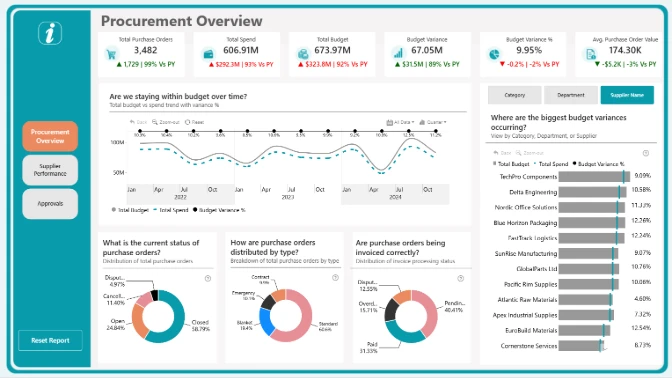
  • How does actual spend compare with budget?
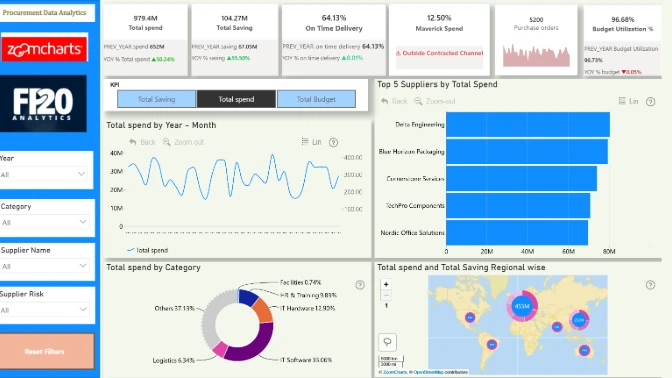
  • Where are the biggest savings being achieved?
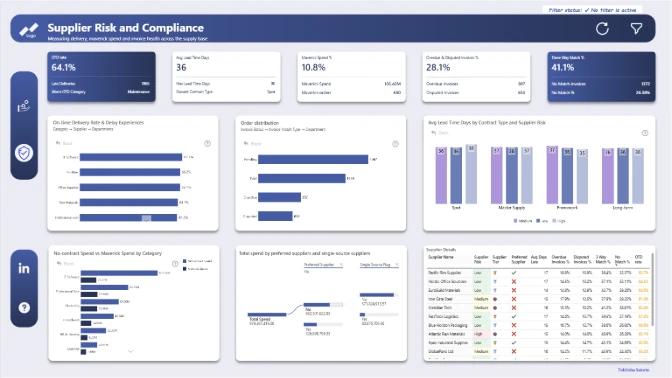
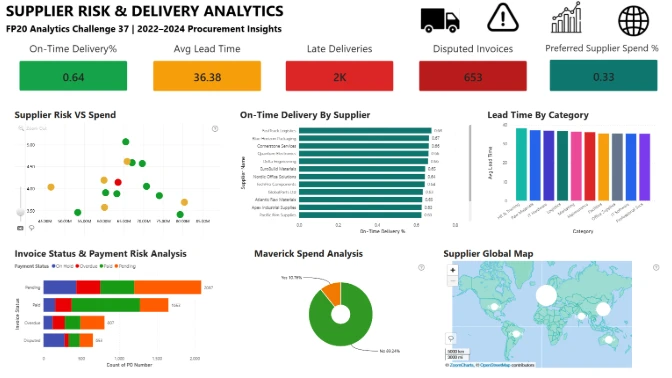
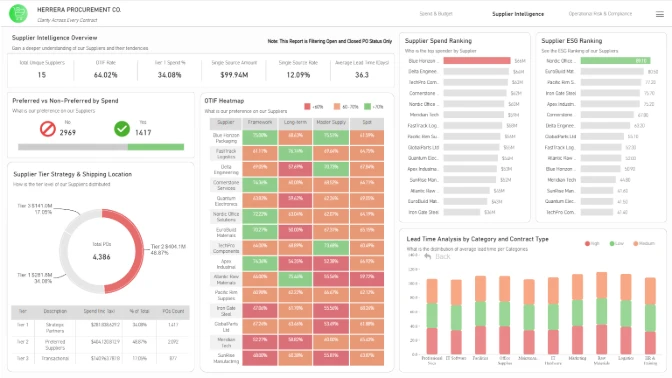
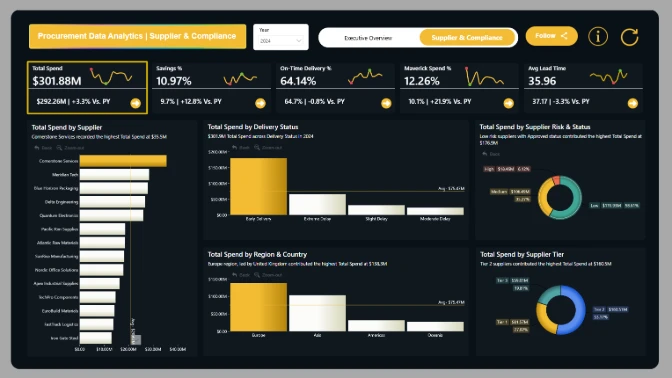
  • Which suppliers are associated with the most spend, and how do they compare by risk level, status, tier, region, and ESG score?
  • Are there differences in performance between preferred and non-preferred suppliers, and how much spend is concentrated in single-source suppliers?
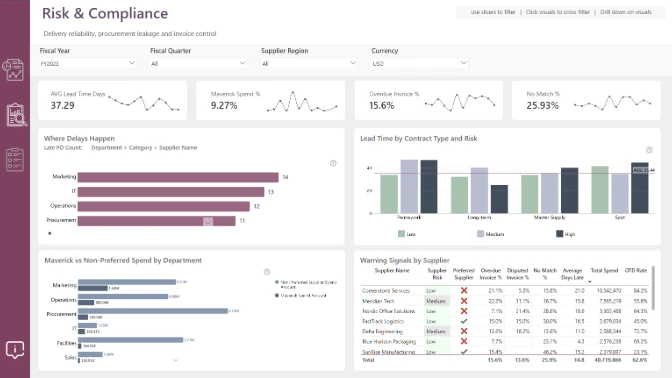
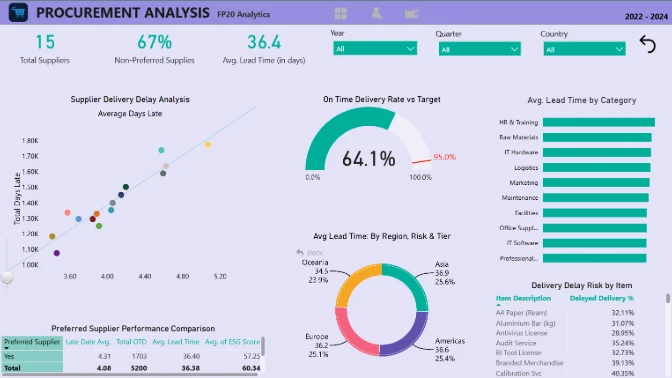
  • What is the on-time delivery rate, and which suppliers, categories, or departments experience the most delays?
  • How do lead times vary across supplier types or categories, and are delays linked to higher-risk suppliers or certain contract types?
  • How much maverick spend exists in the dataset, and how often are preferred suppliers not being used?

✨ Note: These questions are only suggestions. Feel free to explore the dataset creatively and uncover insights that support better procurement management and planning.


Your Objective

Create a Power BI report that helps analyze the procurement dataset. The report should enable users to track spending patterns, evaluate supplier performance, and compare actual spend against budget across categories, departments, and regions.

Judging criteria

Business users use reports to make data-driven decisions. That’s why reports are called effective if they enable users to drill down and filter data quickly and intuitively to find answers to any question they might have, and analyse data in all possible directions and dimensions.

Each report is evaluated based on three main criteria: intuitiveness, insightfulness, and interactivity. These factors ensure that the reports are not only accurate and functional, but also meet the target audience's needs and are ready to be presented to the end-users. 


  1. Intuitive: How clear and easy it is to understand the report at a glance? (max 15 points)
    • Is the report visually appealing?
    • Choice of charts and visual elements
    • Does the report tell a story?
    • Is it not overwhelming to the user?
    • Choice of tooltips, titles, and legends

  2. Interactive: How engaging and seamless is the report exploration and interaction with data? (max 15 points)
    • Clear navigation that allows user to explore the report
    • Use of slicers and other interactive elements
    • Smooth cross-chart integration
    • Is report optimized for touch devices?
    • Are tutorials and guiding elements helpful to the user?

  3. Insightful: How accurate, complete, and meaningful is the data in driving decisions? (max 15 points)
    • Depth of analysis
    • Data cleaning and preparation
    • Does data show up accurately in the report?
    • Is report optimized for quicker loading time?
    • Does the report provide deeper exploration of data (drill-down)?

Timeline

Registration Open

Registration Open

17 April | 07:00

-

Submissions Open

Submissions Open

17 April | 07:00

-

Workshop | Power BI Workshop: How to Visualize Procurement Data

Workshop | Power BI Workshop: How to Visualize Procurement Data

23 April | 08:00

-

1:1 Mentoring Sessions

1:1 Mentoring Sessions

23 April | 08:00

17 April - 18 May

Entry Submission Deadline

Entry Submission Deadline

18 May | 19:59

17 April - 18 May

Webinar | Explore the Top 5 Power BI Reports for Procurement Analysis

Webinar | Explore the Top 5 Power BI Reports for Procurement Analysis

22 May | 06:00

17 April - 18 May

Winner Announced

Winner Announced

22 May | 07:00

17 April - 18 May

Dataset

Get the dataset

See past FP20 Analytics April 2026 challenges

See past challenges

Your Drill Down Visuals Developers License

Use the email and password provided below to log in Power BI Desktop and access an account with a license to use all ZoomCharts Drill Down Visuals.

Upon logging in, you will need to change your password and enable two-factor authentication. If you encounter any problems, feel free to reach out to us via chat.

*This Developer License can be used to create a report for this ZoomCharts Mini Challenge or for your personal training purposes. Commercial use of this license is prohibited.

Upload failed
Attach file
File requirements: 16MB

Any questions? Feel free to use chat!

Are you sure you want to delete the report?

Activate your Drill Down visuals Developer License!

You can use these credential to access ZoomCharts visuals and create your report for this ZoomCharts Mini Challenge, or for your personal training purposes.


Get ZoomCharts Developer License Select this option if you already have a Microsoft work or school account to activate and use ZoomCharts visuals in Power BI Desktop.

Activate your free developer license to use Drill Down visuals in your challenge report.


Create a free Microsoft account To install ZoomCharts visuals from the Power BI marketplace, you need a Microsoft account.

Don’t have a Microsoft account yet? Create a free account to build reports and join challenges.


logo
[email protected]
+44 204 577 3993
logo

Products

Drill Down Bubble PRO Drill Down Line PRO Drill Down Network PRO Drill Down Waterfall PRO Drill Down Graph PRO Drill Down Combo PRO Drill Down Combo Bar PRO Drill Down Donut PRO Drill Down Pie PRO Drill Down TimeSeries PRO Drill Down Timeline PRO Drill Down Map PRO Drill Down Scatter PRO All Visuals

Resources

Report Examples Webinars Blog ZoomCharts Academy Visuals Gallery Documentation Custom Visual Development Subscribe to News

Solutions

Custom Visual Development

Company

Pricing About Us Partners Leave feedback Join PowerGroup EU Funding

Help

ZoomCharts Assistance Contact Sales Contact Support FAQ AI Information

Drill Down Line PRO Drill Down Bubble PRO Drill Down Network PRO Drill Down Waterfall PRO Drill Down Graph PRO Drill Down Combo PRO Drill Down Combo Bar PRO Drill Down Donut PRO Drill Down Pie PRO Drill Down TimeSeries PRO Drill Down Timeline PRO Drill Down Map PRO Drill Down Scatter PRO All Visuals

Report Examples Webinars Blog ZoomCharts Academy Visuals Gallery Documentation Custom Visual Development Subscribe to News

Custom Visual Development

Pricing About Us Partners Leave feedback Join PowerGroup EU Funding

ZoomCharts Assistance Contact Sales Contact Support FAQ AI Information
+44 204 577 3993
[email protected]

Ready to get in touch?

Contact our experts with any question about Power BI and ZoomCharts for Free!

Contact us

© 2026, Data Visualization Software Lab

U.S. Patents No. 11,645,343; 11,921,804; 12,346,389

Cookies
Privacy Policy
Global
Legal
Patent
warning

Error message

success

Success info: Done!

ZoomCharts AI Assistant

We noticed you're using an old OS version.

For the best experience, we recommend upgrading to ensure that all website features display correctly.

Cookie settings

We use necessary cookies for site functionality, as well as statistic, marketing, and preference cookies to enhance your experience. For more information and to manage your preferences, please visit our Cookie policy