408
Procurement Budget vs Actual Dashboard 2
Procurement Budget vs Actual Dashboard 2
More Report pages
Report Author: Akindele Omolayo
408
Share template with others
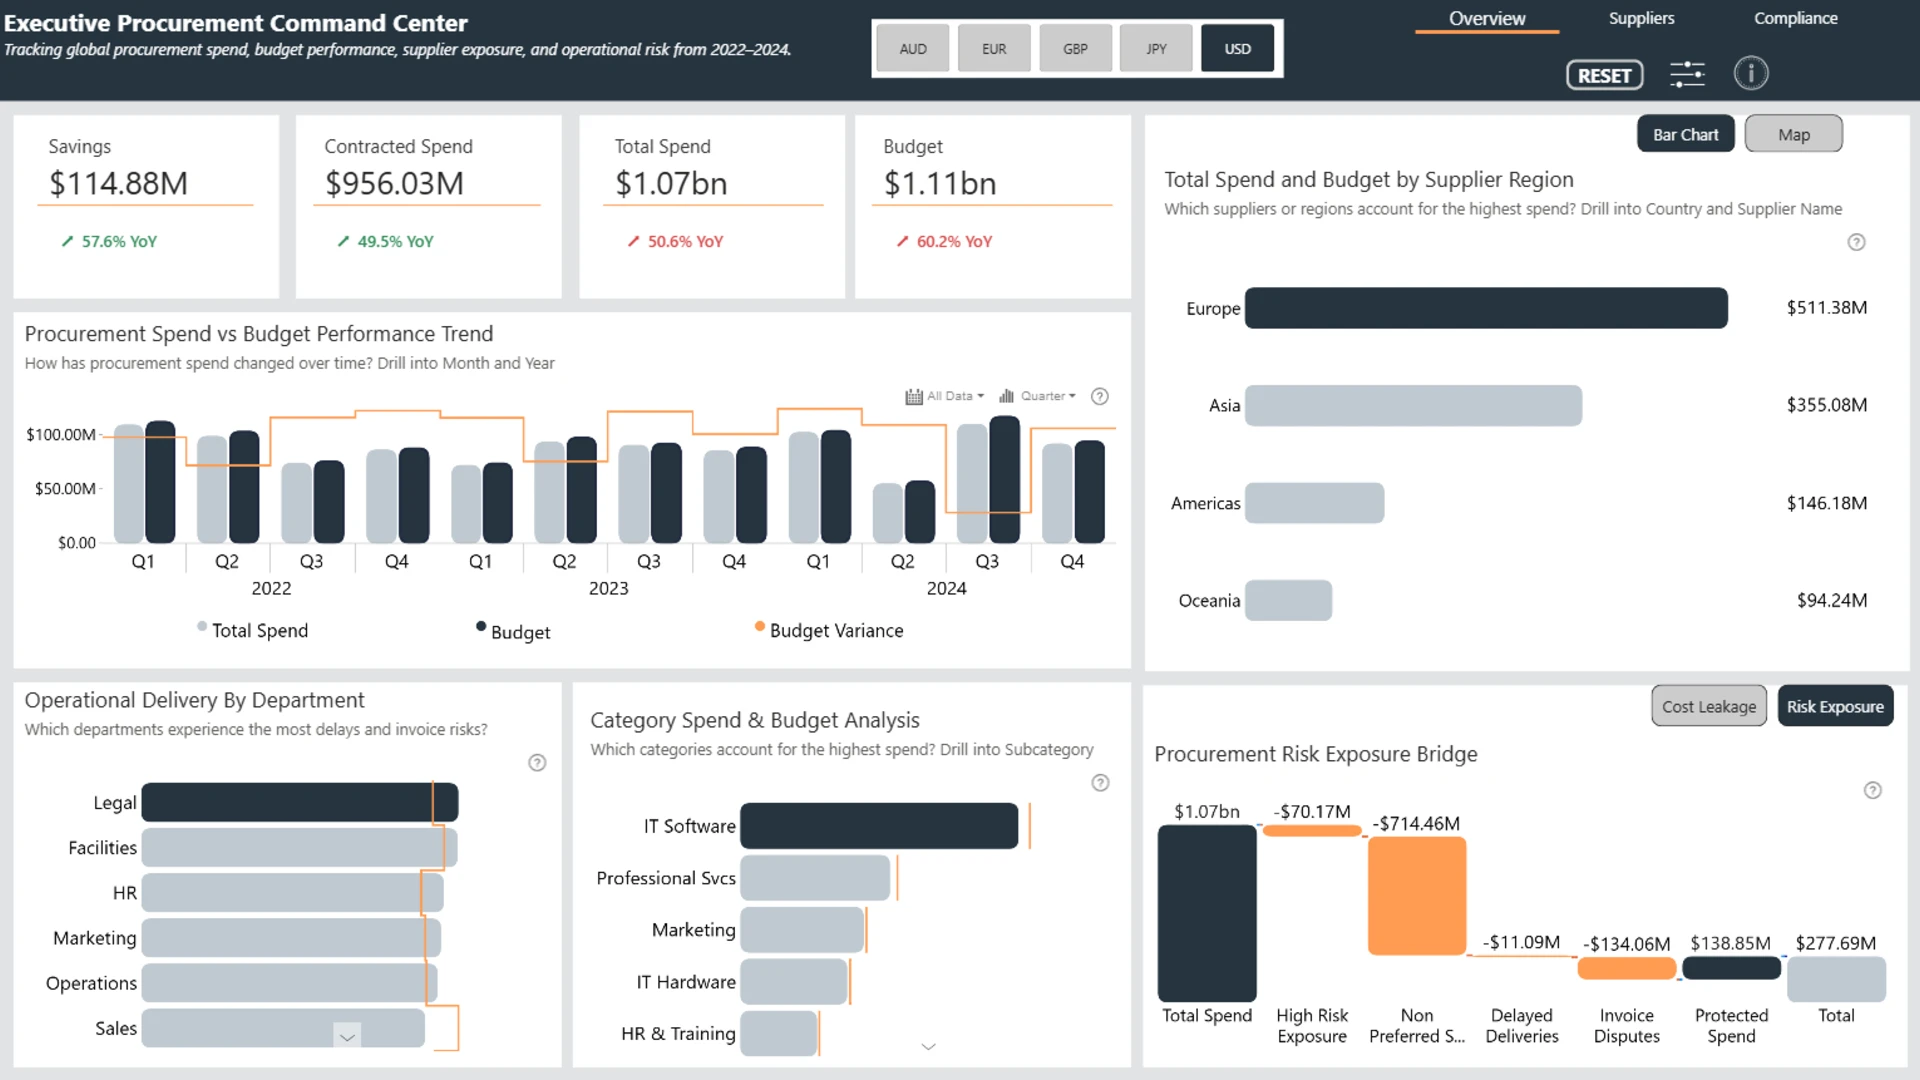
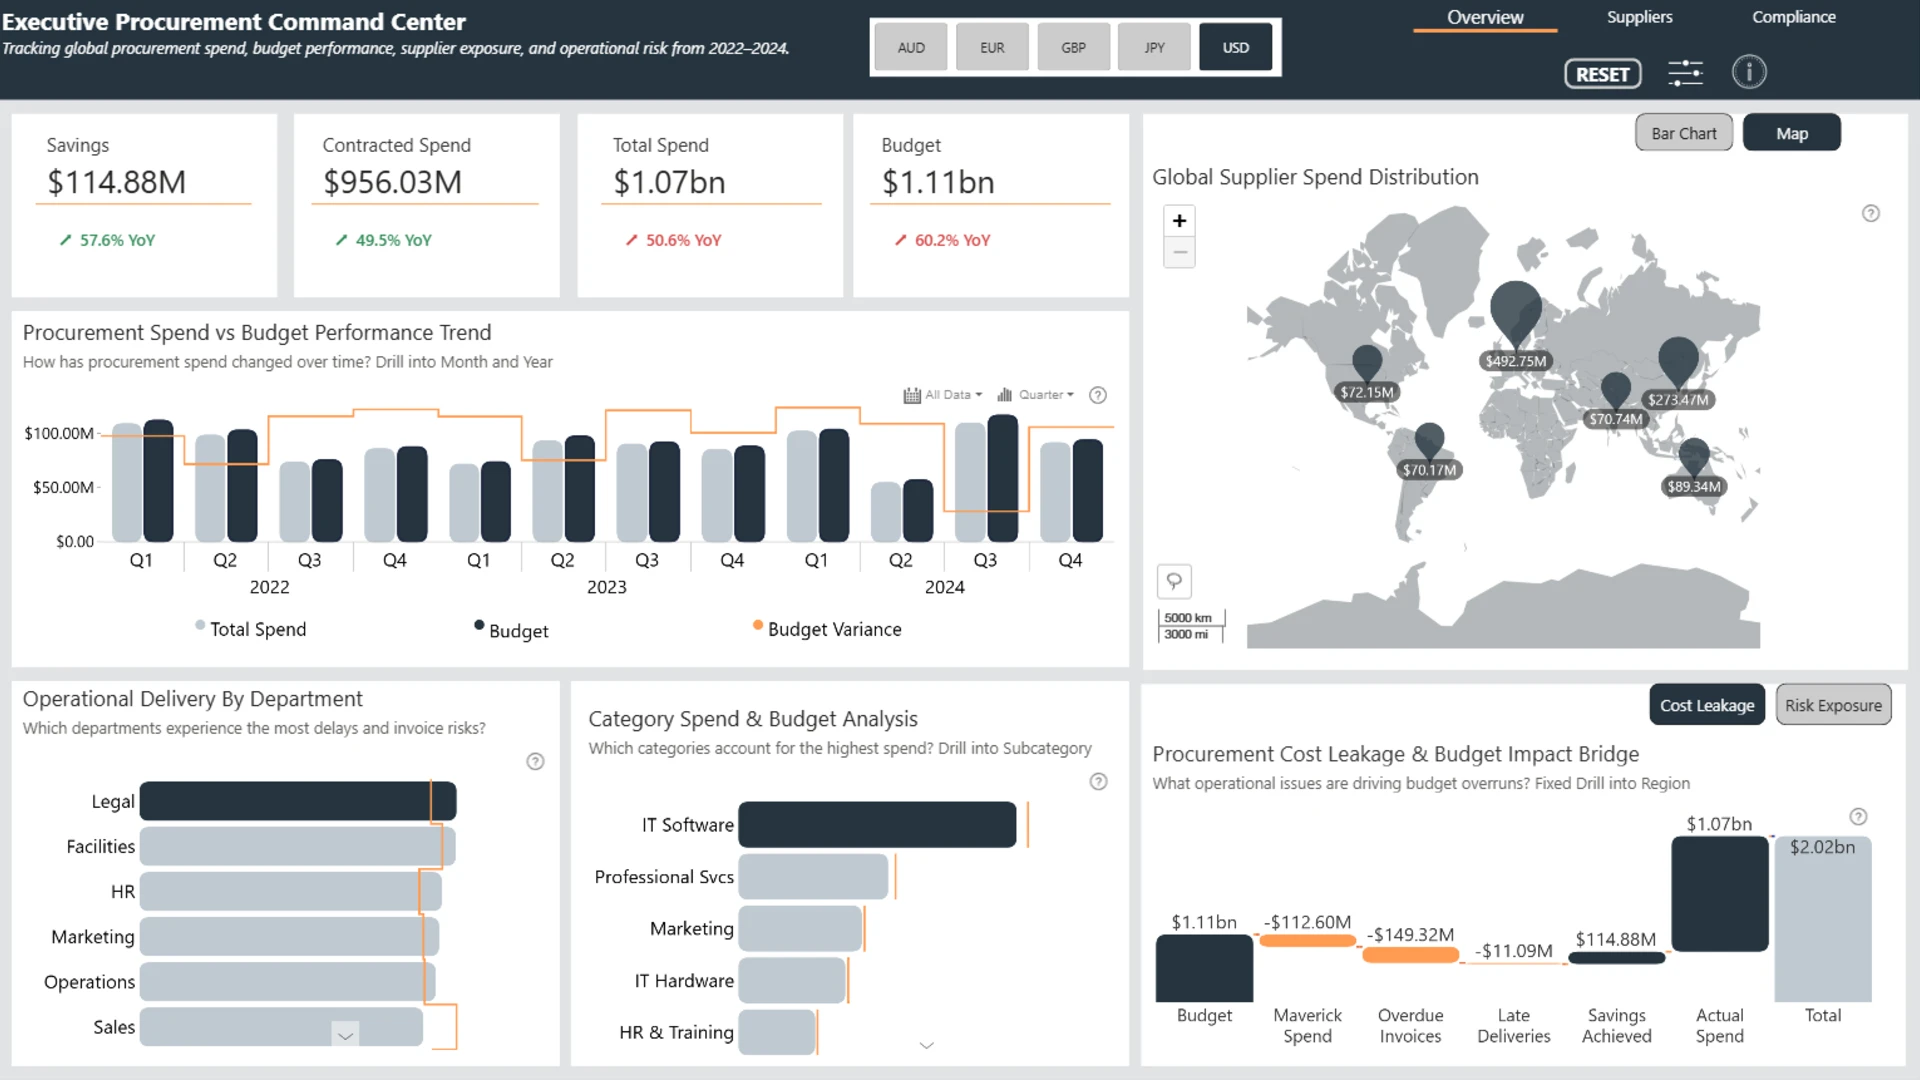
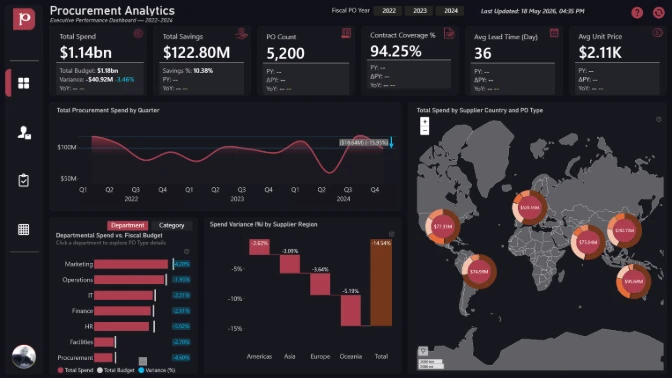
This interactive Power BI report explores the Procurement dataset using ZoomCharts Drill Down custom visuals and native Power BI visuals. It analyzes purchase order activity from 2022 to 2024, highlighting procurement spend, supplier performance, budget versus actuals, savings, delivery timelines, supplier risk, and maverick spend across categories, departments, regions, and suppliers.
The report helps users identify spending trends, compare supplier performance, monitor compliance, evaluate budget pressure, and uncover opportunities to improve procurement efficiency, reduce risk, and support better purchasing decisions.
The report was submitted to the FP20 Analytics ZoomCharts Data Challenge 37 (April-May 2026).
Author’s Description:
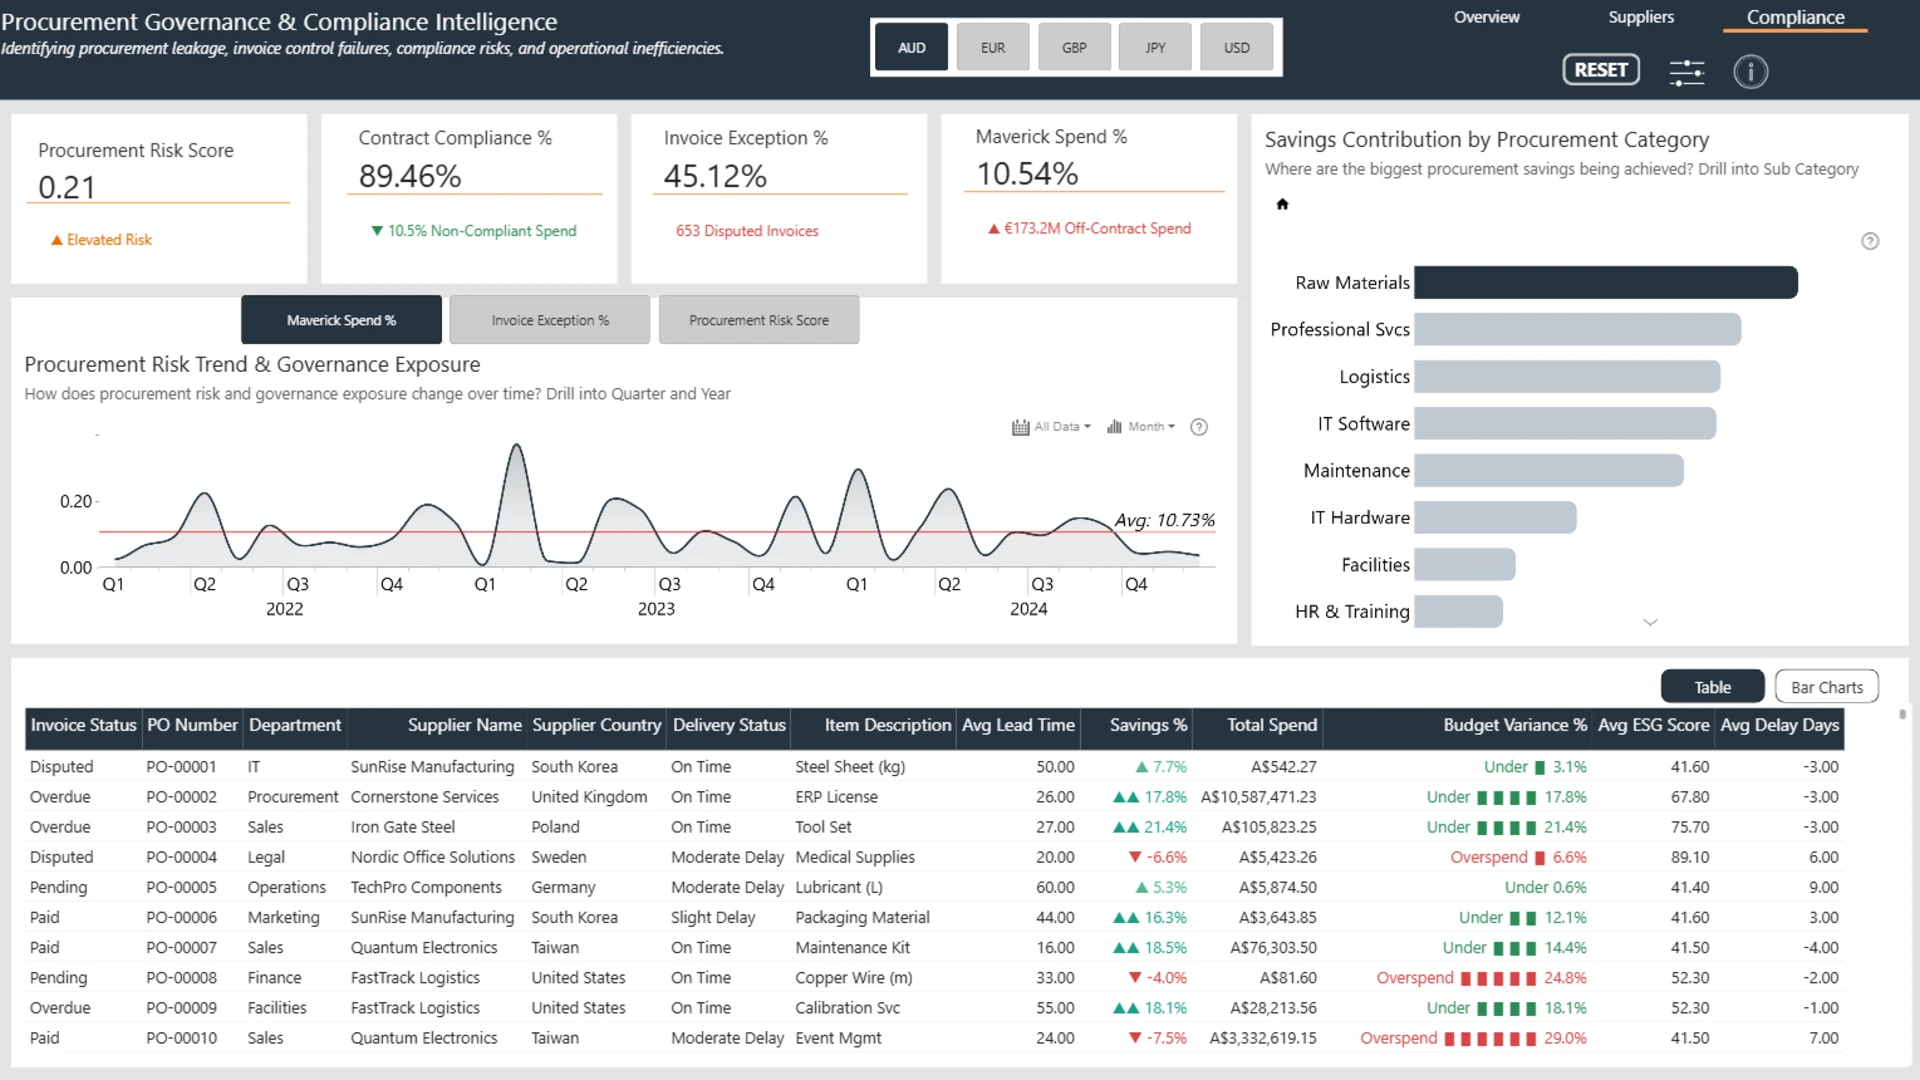
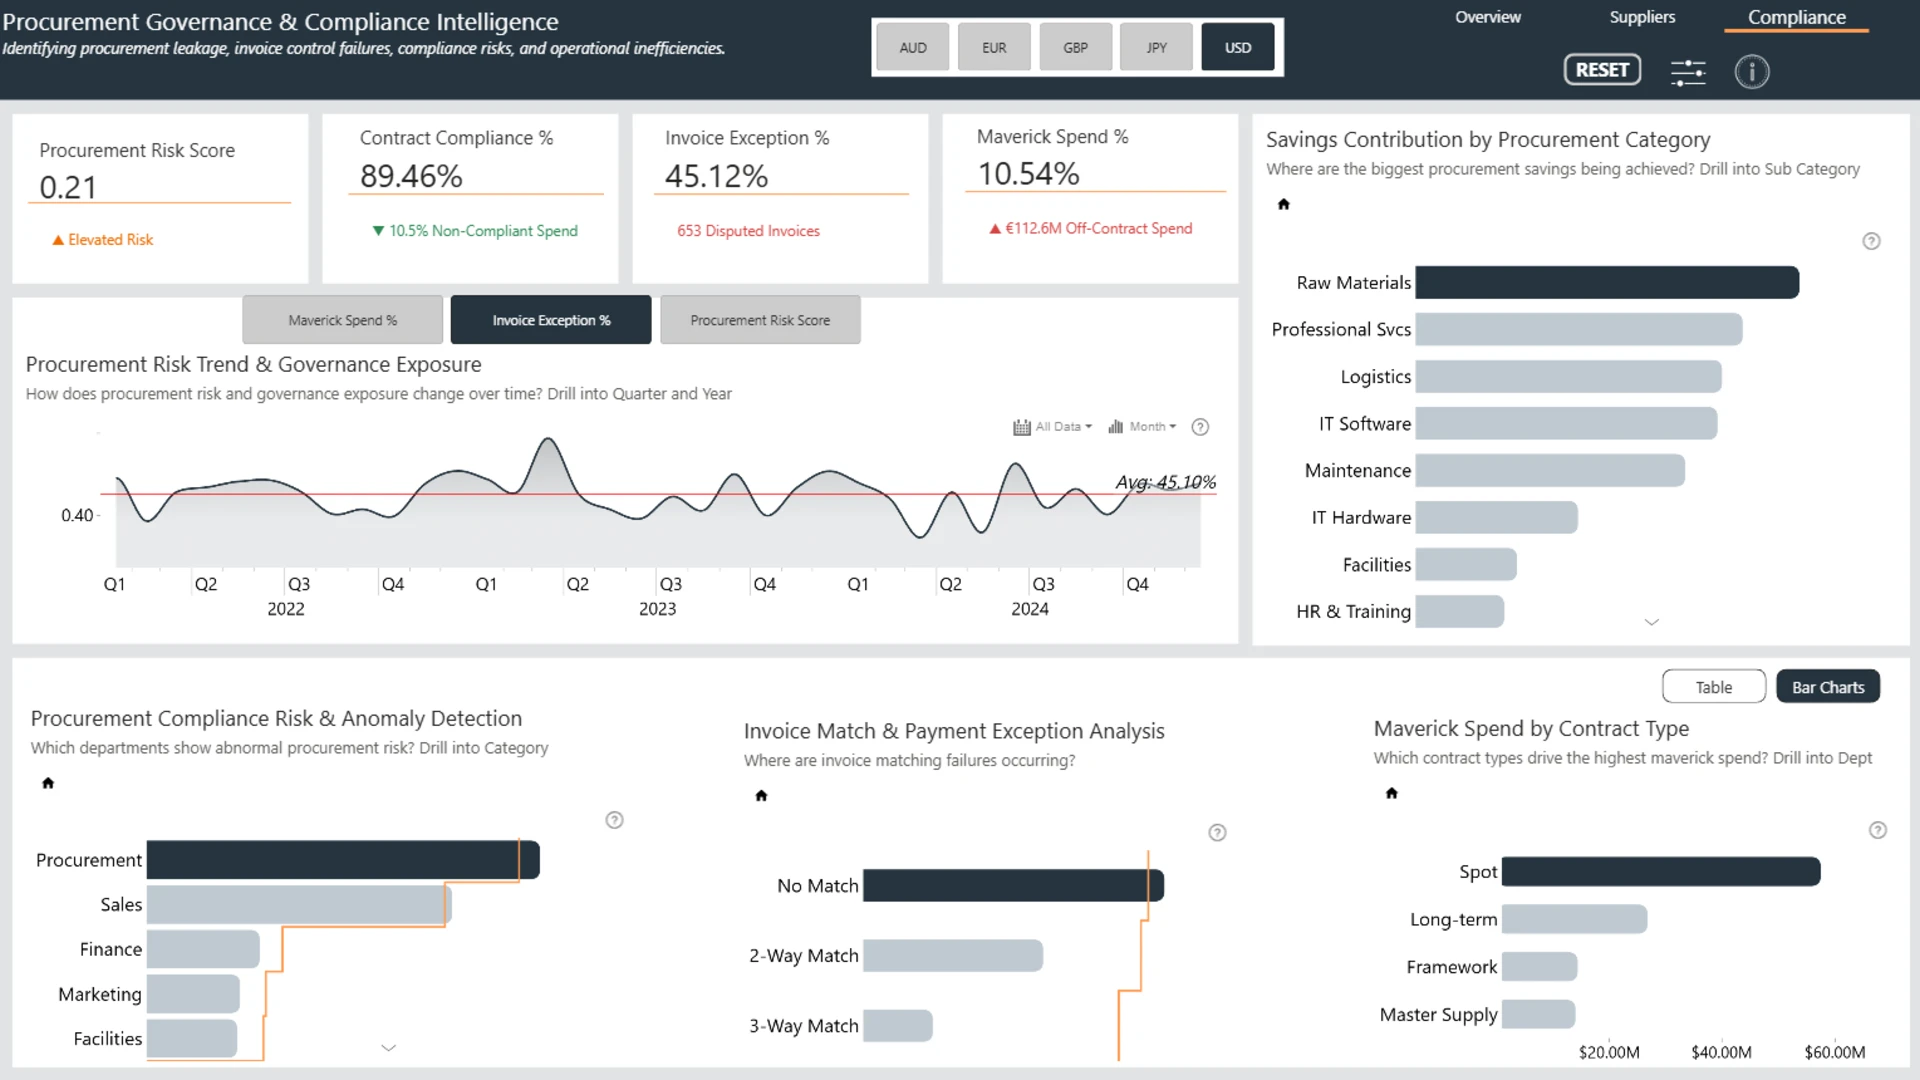
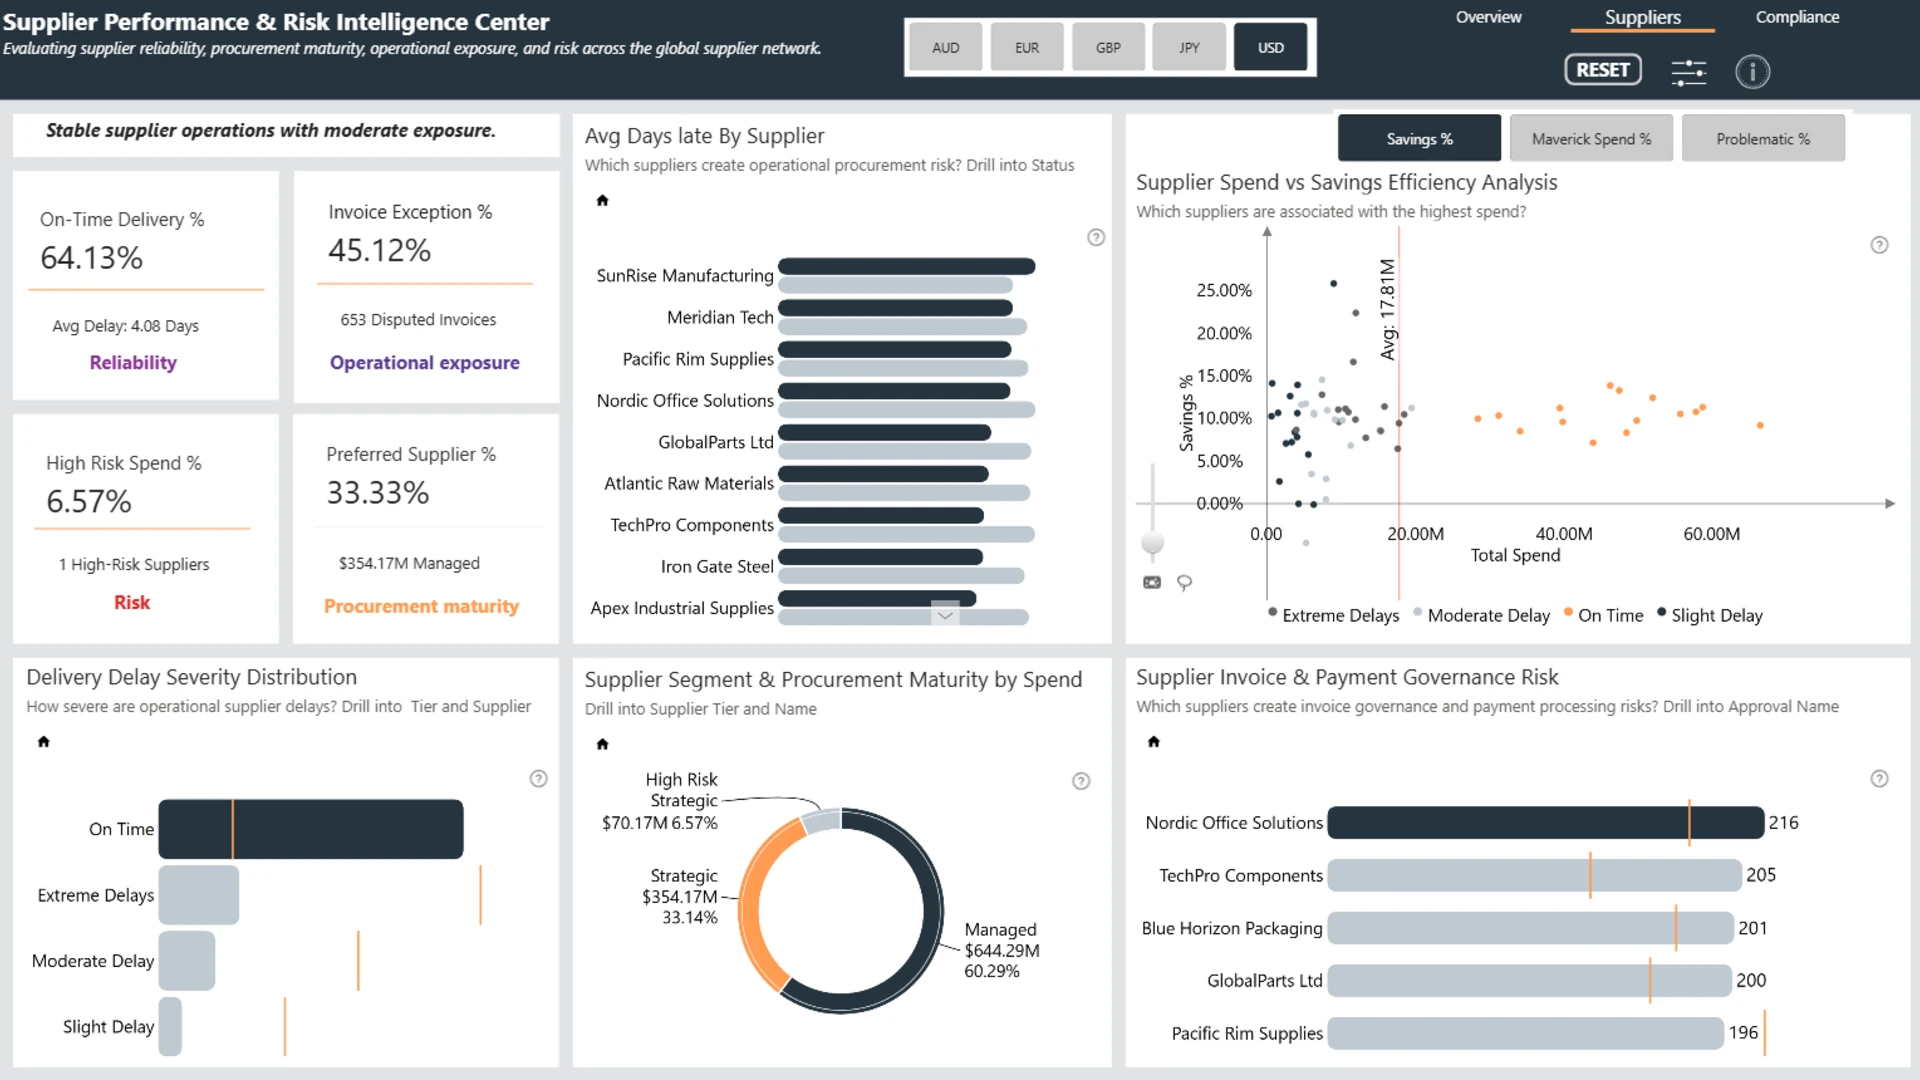
This report delivers a comprehensive analysis of procurement performance, supplier operations, and governance compliance across the organization. The dashboard evaluates spend trends, budget variance, savings efficiency, supplier reliability, invoice processing risks, procurement maturity, and maverick spending exposure.
Interactive drill-through visuals provide deeper insights into supplier performance, operational delays, contract compliance, and procurement risk anomalies, enabling decision-makers to identify inefficiencies, strengthen governance controls, reduce operational exposure, and improve strategic procurement performance.
ZoomCharts visuals used
4U Report Challenges
Participate in data challenges, build and submit reports to get free template downloads.
Join CommunityMobile view allows you to interact with the report. To Download the template please switch to desktop view.
Was this helpful? Thank you for your feedback!
Sorry about that.
How can we improve it?