What's New in Drill Down PRO visuals
This update addresses three everyday needs: faster chart configuration, more consistent visual design, and less friction when exploring data.
- Guided Line PRO setup provides chart-type selection and required-field validation.
- Donut PRO KPI opacity allows transparent or partially transparent KPI backgrounds.
- Blank KPI value text lets you replace empty KPI values without a separate DAX workaround.
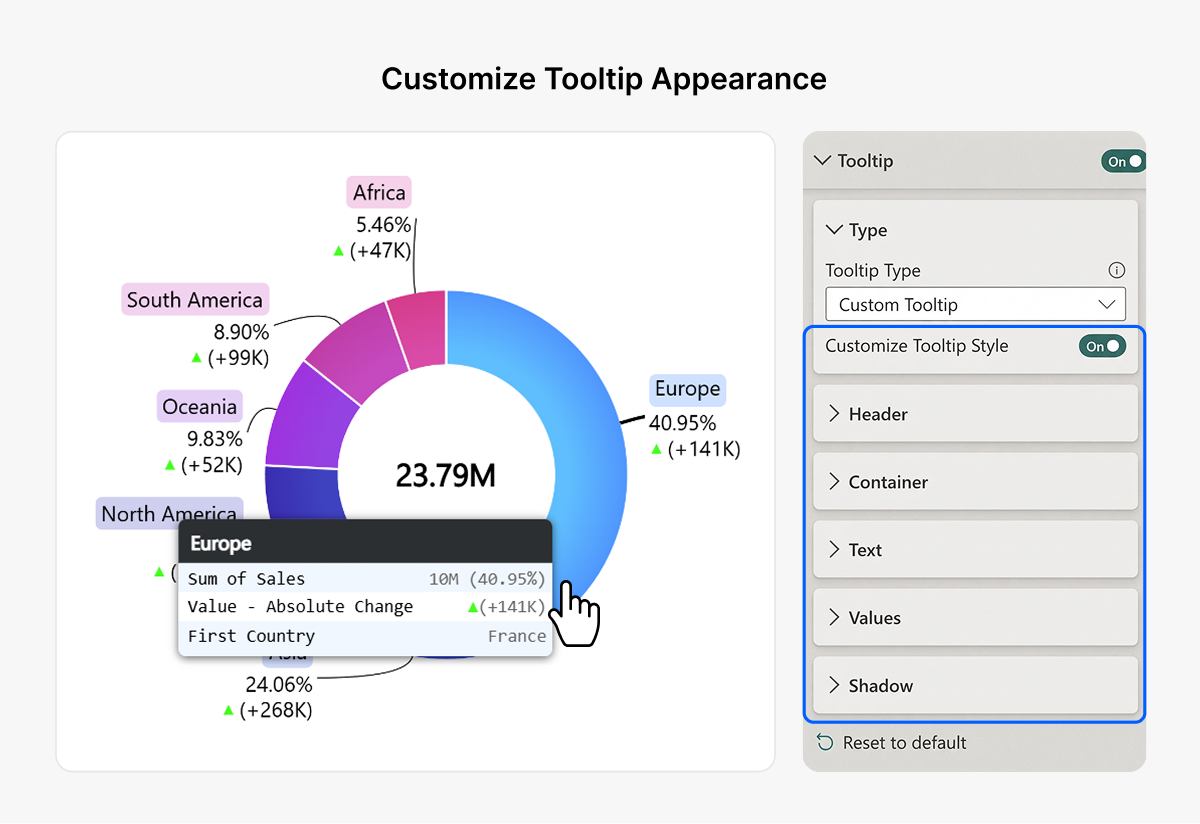
- Custom Donut and Pie tooltip styling adds detailed formatting for headers, rows, values, and shadows.
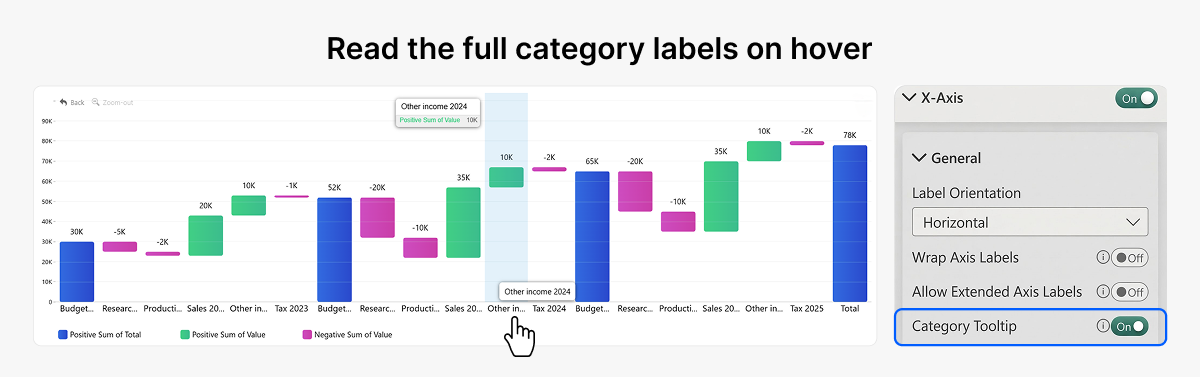
- Waterfall category tooltips reveal cropped X-axis labels.
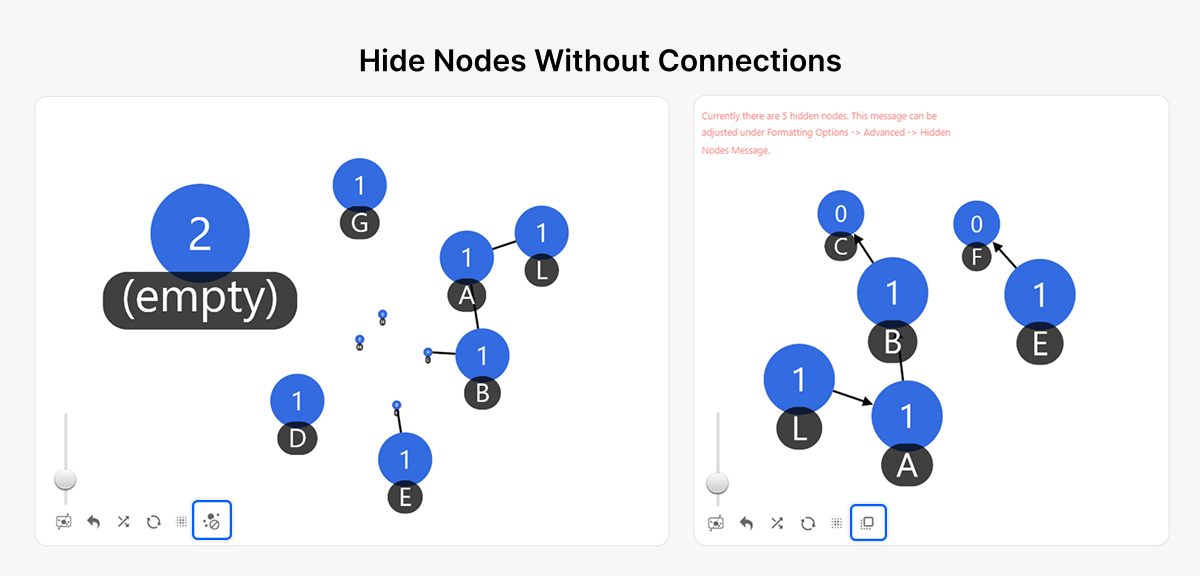
- Hide unconnected Graph nodes removes isolated nodes from the current graph view.
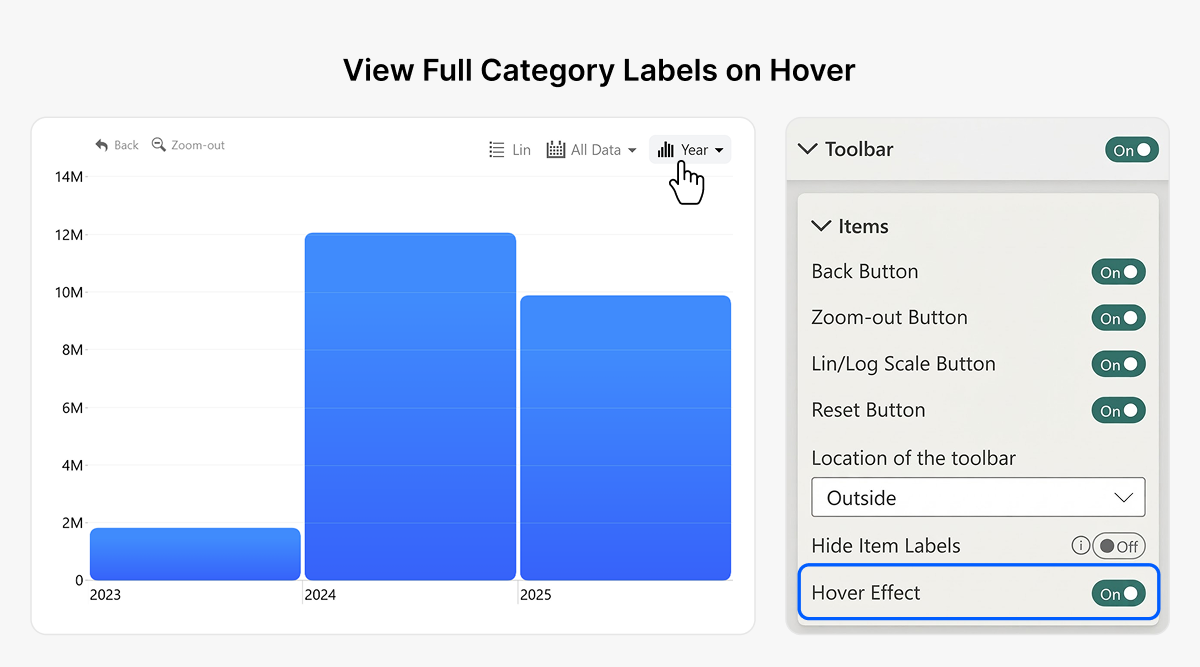
- Toolbar hover effects provide a clearer visual indication of interactive buttons.
1. Guided setup makes Line PRO easier to configure
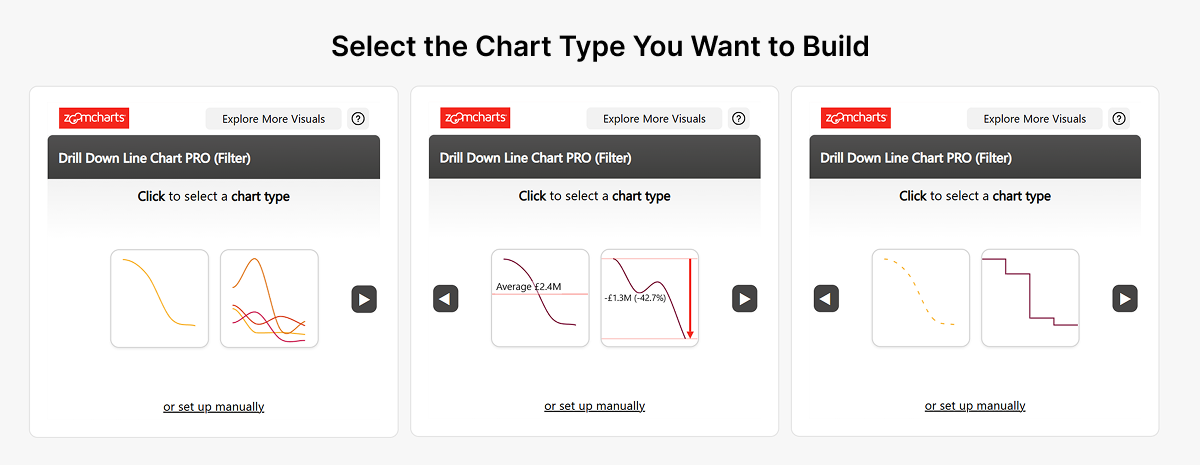
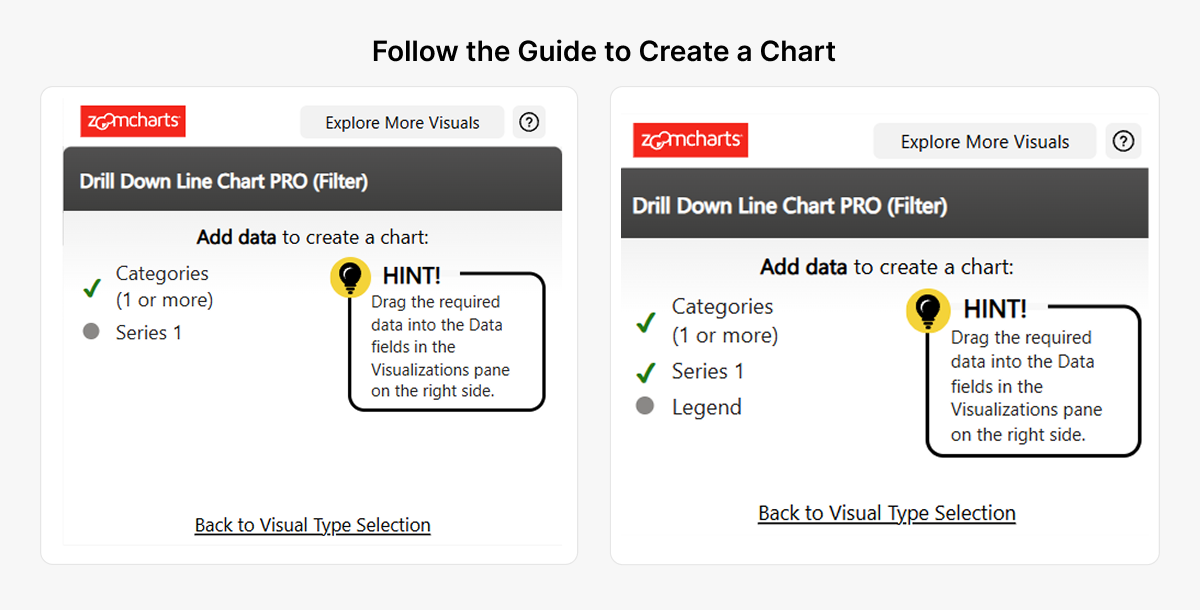
Drill Down Line PRO now offers a guided initial setup. Instead of starting with an empty visual and working out its required fields, choose from available line-chart configurations first.
The visual then identifies the required category and numeric-series fields. As you add data, checkmarks and other indicators show what is present or missing and whether the fields are valid. After all required data is added, the chart is generated and can be customized in the Power BI formatting pane.
How the guided setup works
- Add Drill Down Line PRO to a Power BI report.
- Select one of the available chart configurations.
- Review its required fields and add your categories and numerical series.
- Follow the field validation indicators until the necessary inputs are provided.
- Continue customizing the generated chart in the Format pane.
Manual Setup remains available for report creators who want to configure the chart from scratch.
Why this helps developers
A visual capable of displaying multiple independently configurable lines can take time to learn. Guided setup makes its data requirements visible early and helps new users move from selection to chart creation without experimenting blindly with the field wells.
2. Control the opacity of Donut PRO KPI cards
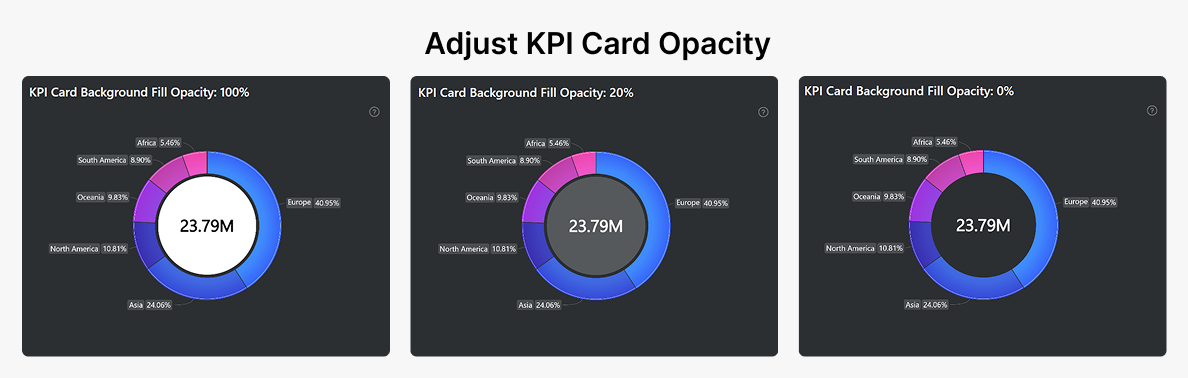
Drill Down Donut PRO can display a KPI card in the center of a donut chart. The new KPI Card > Card > Fill Color Opacity setting lets you control the card background separately from the donut segments.
- 0 means fully transparent.
- 100 means fully opaque.
- Values in between create a partially transparent background.
This is useful for dashboards with dark themes, branded backgrounds, or layouts where the center card should blend into the rest of the chart.
Why this is useful
Developers can keep the KPI visible while adjusting the background to fit the overall design, without covering the entire donut center with an opaque block.
3. Replace blank KPI values with useful text
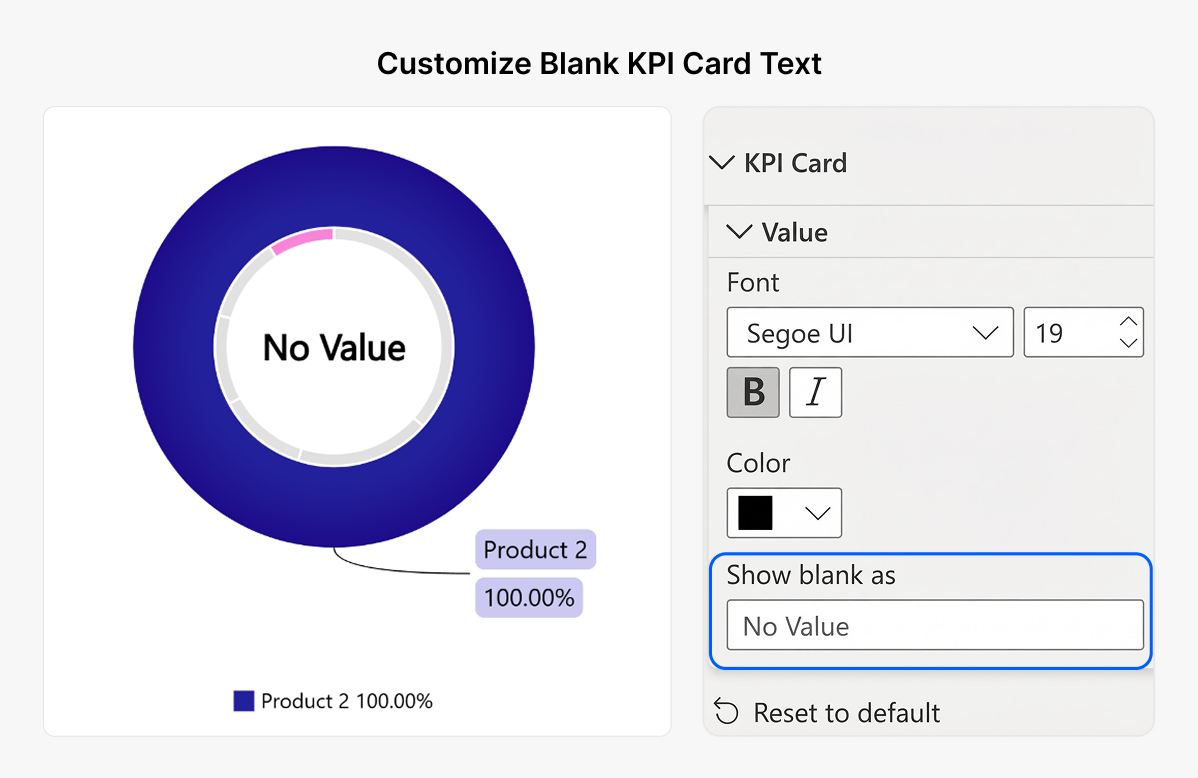
When a KPI measure returns a blank value, an empty card can be difficult to interpret. Drill Down Donut PRO now includes KPI Card > Value > Show Blank As, where you can type a custom replacement such as “No data”, “N/A”, or “Not available”.
Previously, developers might have created a separate DAX measure to convert blank values to a text label. This setting offers a direct alternative within the visual configuration.
Why this helps
Clear empty-state text communicates that no value is available, without leaving report users to guess what an empty KPI means or requiring additional DAX purely for display.
4. Customize Donut and Pie tooltip appearance
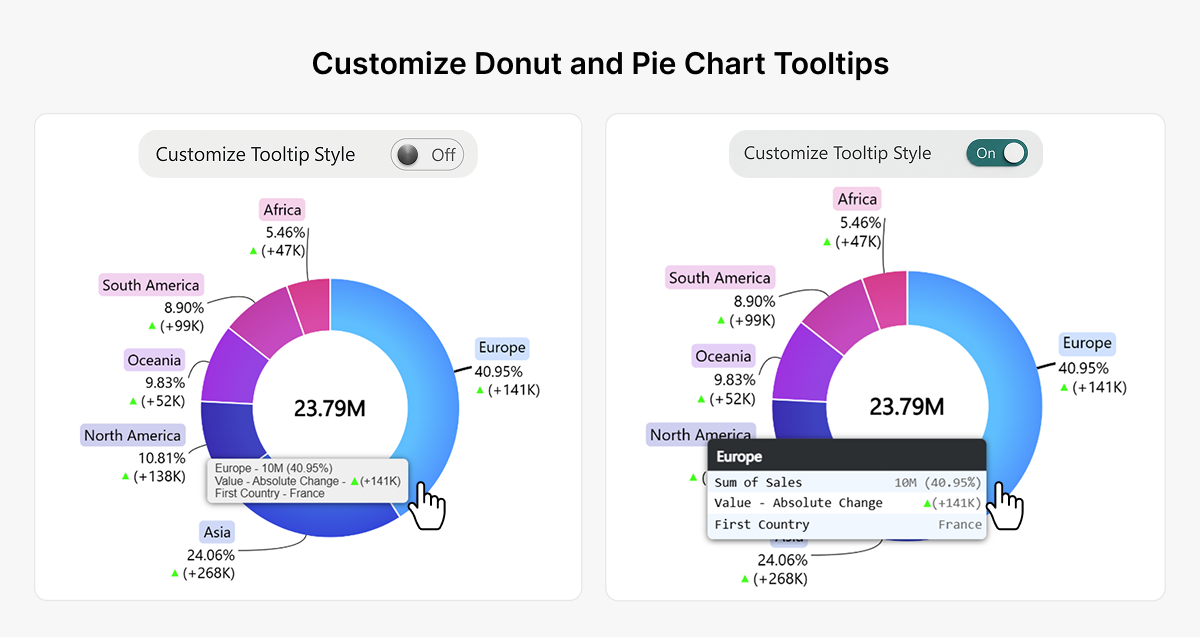
Drill Down Donut PRO and Drill Down Pie PRO now provide advanced styling for Custom Tooltip. Select Tooltip > Type > Custom Tooltip and enable Customize Tooltip Style to reveal additional groups of styling options.
These options can help tooltips match the rest of a Power BI report while keeping supporting values available on hover rather than adding more permanent text to the canvas.
Tooltip formatting options
| Settings group | What you can configure |
|---|---|
| Header | Background color and opacity; font family, size, style and color. |
| Container | Odd and even row background colors and opacities; rounded corners. |
| Text | Font family, size and style; item or series name font color and opacity. |
| Values | Display units; value decimals; percentage decimals; value font color and opacity; hide rows with no value. |
| Shadow | Color, color opacity, blur, and horizontal and vertical offsets. |
Why custom tooltips are useful
For example, a category-level sales tooltip can show quantity, sales, target, and another contextual field in readable rows. Alternating backgrounds, controlled display units and chosen text colors help viewers scan the values without expanding the report layout.
5. Read full Waterfall category labels on hover
In Drill Down Waterfall PRO, long X-axis labels can be cropped when the chart has limited horizontal space. The new X-Axis > General > Category Tooltip setting lets viewers hover over a truncated category label to see its full name.
This label tooltip works even when the main chart tooltip is disabled. You can turn the behavior on or off with the Category Tooltip toggle.
Why this improves readability
Financial waterfall charts frequently use descriptive labels such as revenue streams, expenses, or adjustment categories. Readers can inspect the entire label without requiring wider columns or reducing the font size across the chart.
6. Hide disconnected nodes in Graph PRO
Drill Down Graph PRO now provides a toolbar action for hiding nodes that have no connections to other nodes. In Toolbar > Enable Hide Nodes Without Connections, the report creator can make the action available to viewers.
When viewers use the action, isolated nodes are hidden from the current graph view so they can focus on connected relationships. This is an exploration control, not a change to the underlying dataset.
The feature is off by default and must be enabled in the Toolbar settings.
Why this is useful
In relationship maps, process networks and other node-link diagrams, disconnected elements can occupy valuable space. Hiding them reduces visual clutter and makes connected paths easier to follow.
7. Recognize toolbar actions more easily
Across ZoomCharts Drill Down Visuals, the new Toolbar Settings > Hover Effect adds a visible background to a toolbar item when the pointer moves over it.
Previously, hovering changed the icon color. With this setting enabled, the button background also changes, making the clickable control easier to recognize.
The setting is off by default. Report developers can enable it when they want stronger interaction feedback.
Why this matters for report users
Clear feedback can make controls like Reset, Back, and Zoom-out easier to identify, especially for people who are unfamiliar with the report.
Key takeaways for Power BI developers
- Guided setup makes it easier to get Line PRO charts running with the required data fields.
- Donut PRO KPI opacity and blank-value text give developers better display control and remove a common workaround.
- Donut and Pie tooltip formatting helps match report themes and present supporting metrics clearly.
- Waterfall category tooltips make cropped X-axis labels readable on hover.
- Graph PRO can hide disconnected nodes so users can focus on relationships.
- Toolbar hover effects provide clearer interaction feedback throughout the visual collection.
- Sixteen additional fixes improve formatting, rendering and behavior across the affected visuals.
Try the updated ZoomCharts Power BI visuals
These improvements make interactive Power BI reports easier to build and explore. Try the guided setup, KPI formatting and other interaction options in your own reports.