Quickstart
The purpose of a waterfall visual is to display each individual component that contributes to the final value. ZoomCharts Drill Down Waterfall PRO takes the traditional waterfall one step further by providing interactive drilldowns, smooth animations and rich customization options.
In addition, the visual introduces more freedom and flexibility when it comes to visualizing increases, decreases, and totals: you can add subtotals, change column sequence, hide Total column and customize change columns and totals separately.
Drill Down Waterfall PRO is also optimized to work on both desktop and mobile devices, providing intuitive data exploration experience for your Power BI Reports.
How to build a simple Drill Down Waterfall visual
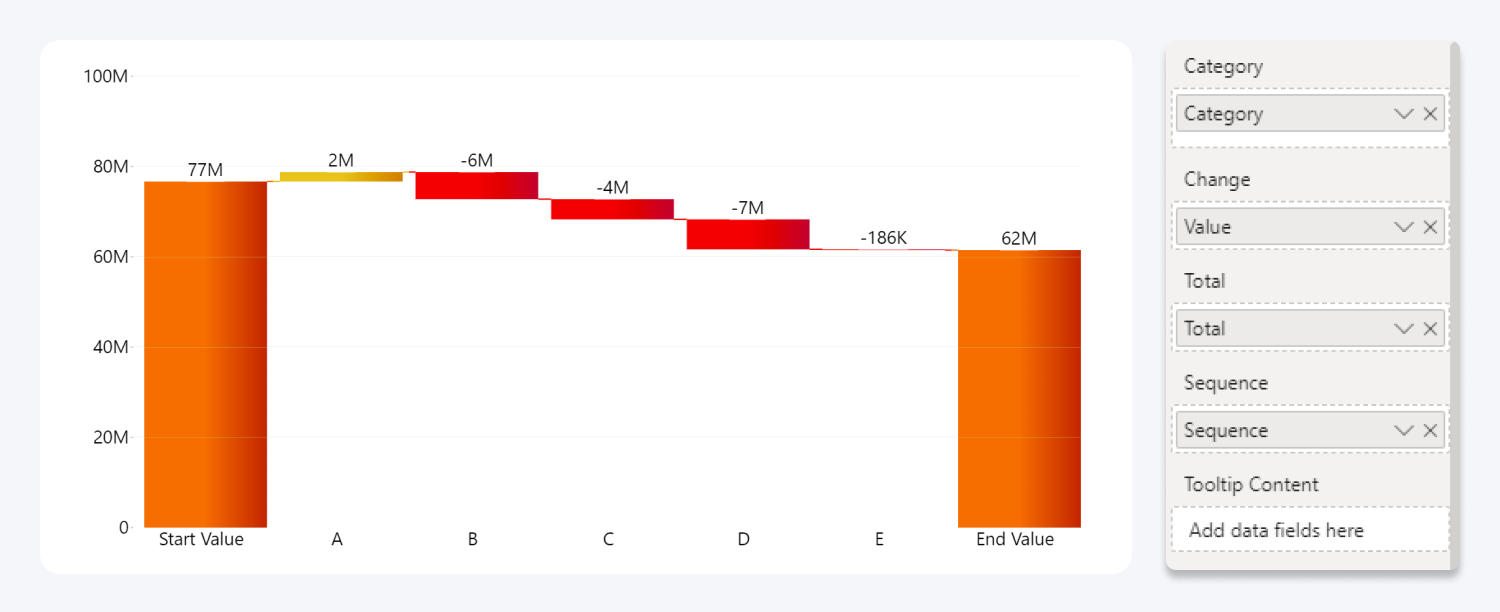
Simple waterfall visual requires 2 data columns – category and change value.
.webp)
Or you can take advantage of optional data fields (Total, Sequence and Tooltip Content ) to add additional information to the chart and set the sequence for the columns.

See the video series below for a detailed step by step guide.
Was this helpful? Thank you for your feedback!
Sorry about that.
How can we improve it?