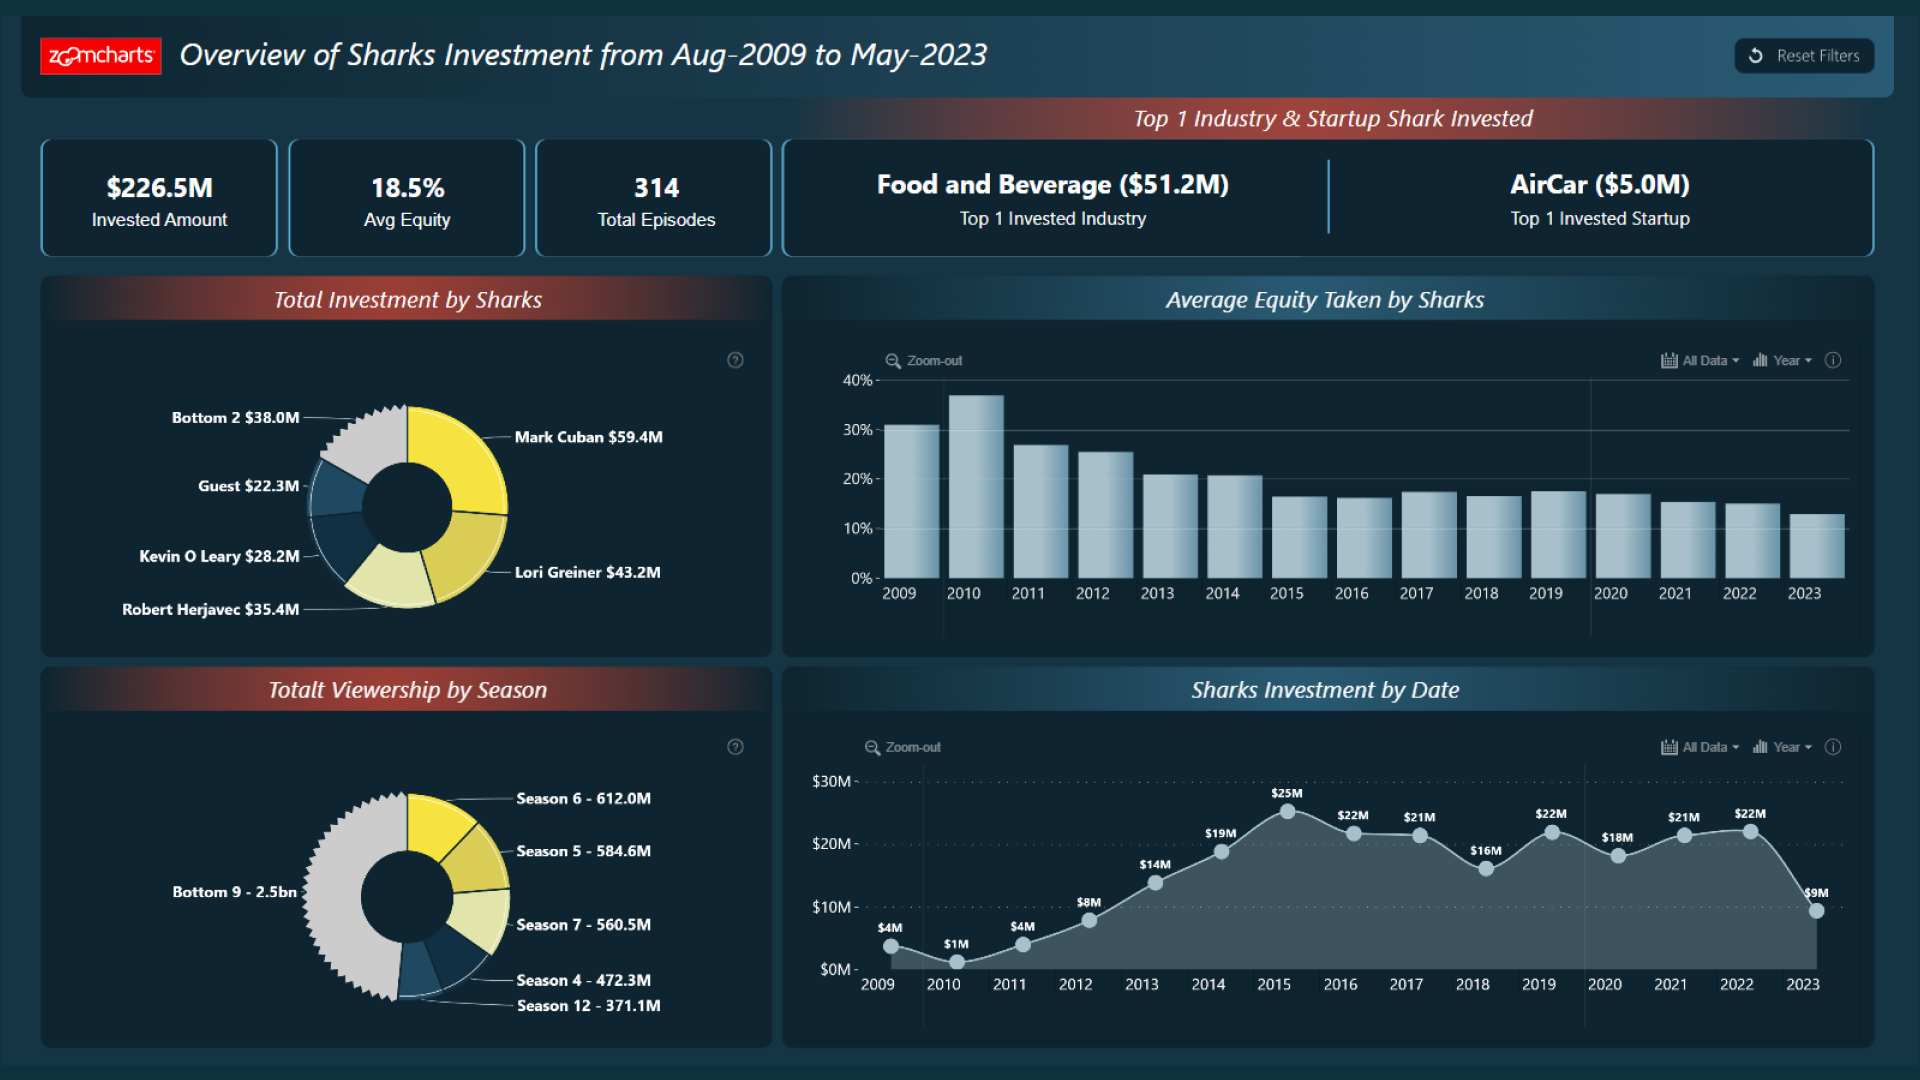
TV Show Data: 'Shark Tank' Visualized
This dashboard visualizes a dataset about the popular Shark Tank TV show. It shows various interesting insights about the TV show, such as viewership trends per season, or investment trends by the Sharks, and it also showcases how ZoomCharts interactions and cross-filtering could work with your real-life use case.
While this dashboard is built on the Microsoft Power BI platform, it utilizes ZoomCharts JS technology for some or all its visual components.