Retail Supply Chain Dashboard Example
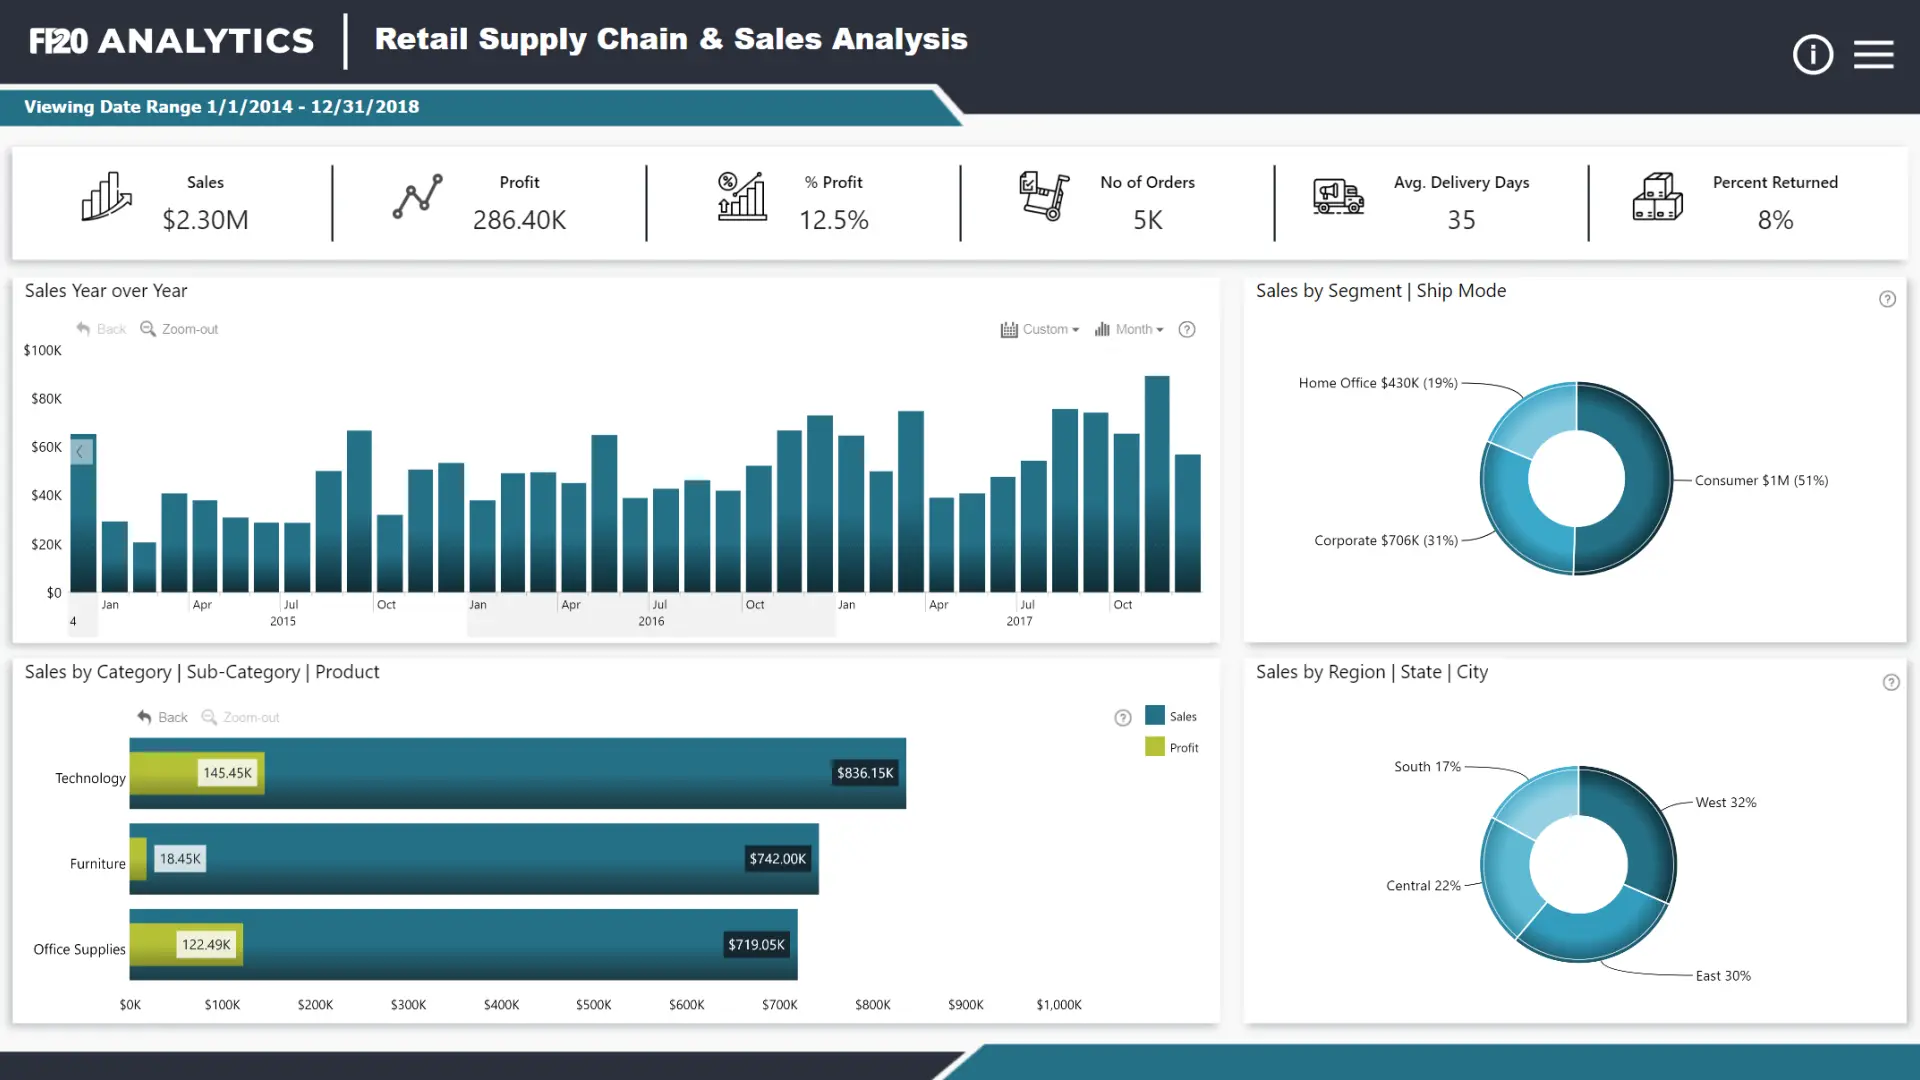
Clean and easy-to-read dashboard that provides the most important insights about retail supply chain & sales. The time chart, pie charts and facet chart can also be used to filter data across the entire dashboard - for example, select a time range to see data for that period in other visuals.
While this dashboard is built on the Microsoft Power BI platform, it utilizes ZoomCharts JS technology for some or all its visual components.