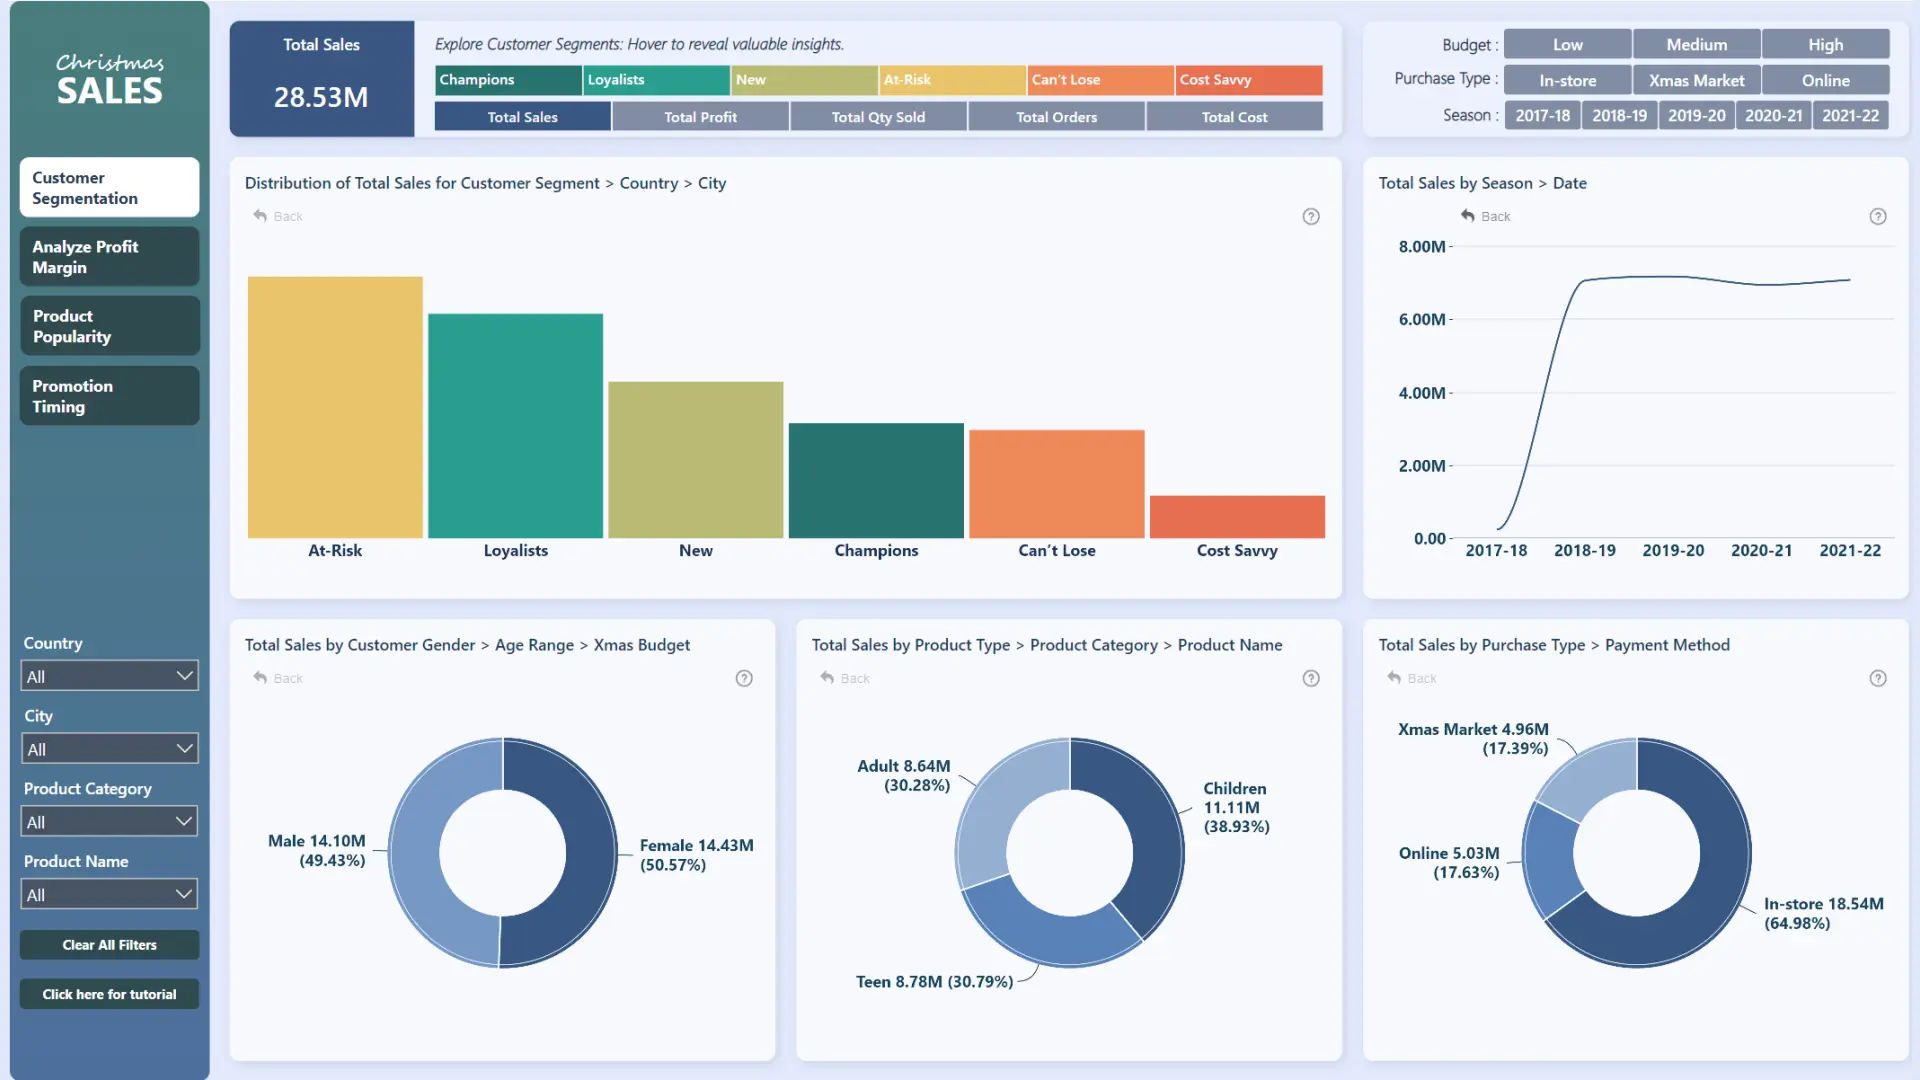
Christmas Gift Sales Dashboard Example
Track seasonal product sales with a focus on trends, top-performing items, and regional performance. Includes interactive visuals like time series, map chart, scatter chart, and column charts across multiple pages, each with cross-filtering.
While this dashboard is built on the Microsoft Power BI platform, it utilizes ZoomCharts JS technology for some or all its visual components.