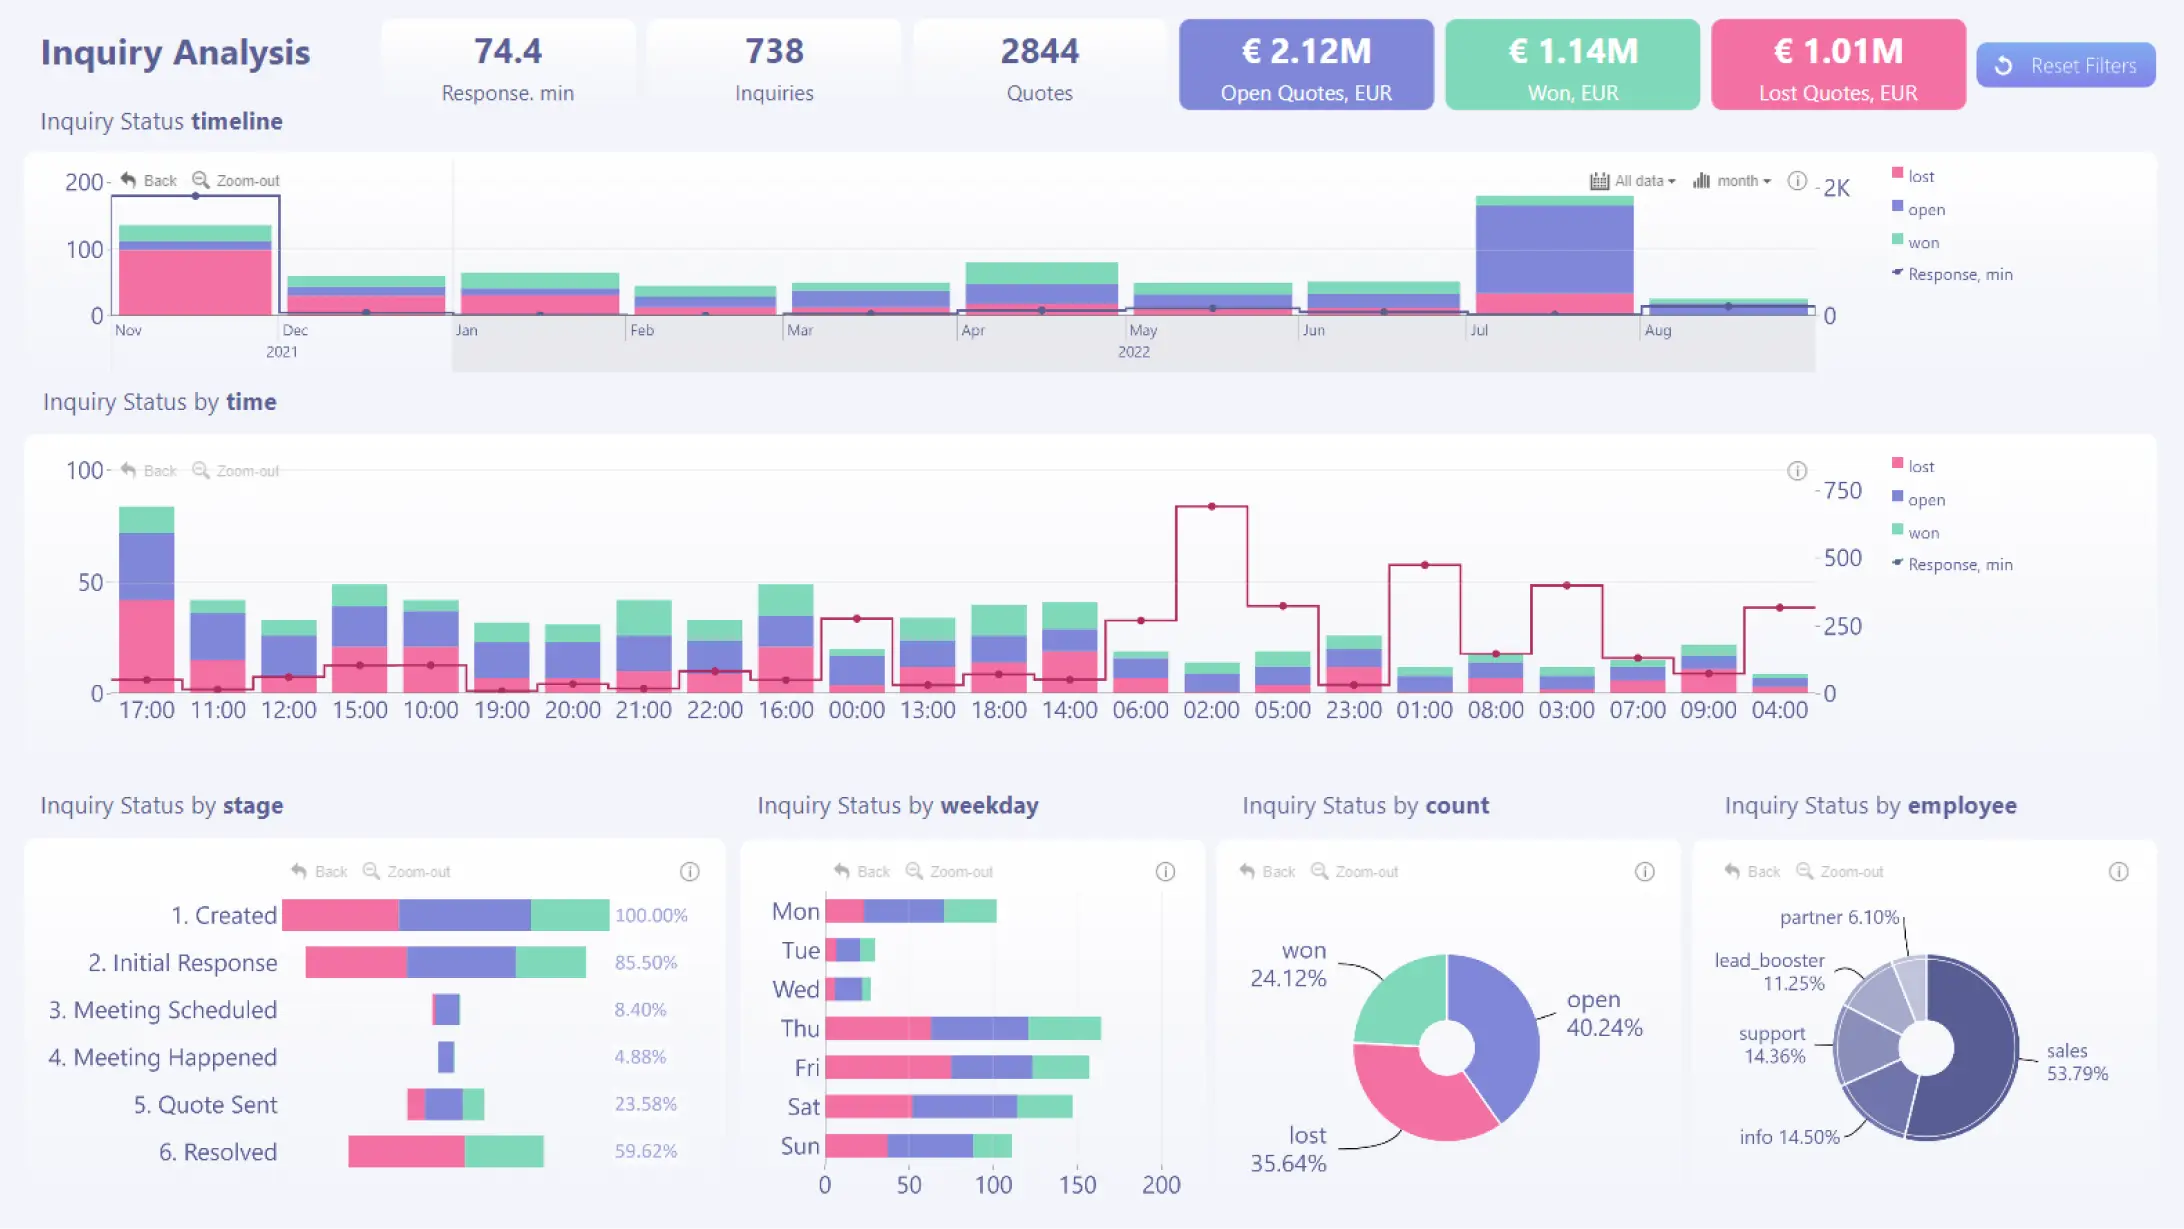
Customer Success Dashboard Example
Monitor your customer success performance and identify your response time, the best-performing days, hours or months in this dashboard example. The time chart on top shows all quotes on a timeline that initially shows months, but allows you to drill down to see specific days or even hours. Below, there's a facet chart that uses hours as the categories, allowing you to identify relation between performance and time of day. Similarly, the bar chart below does the same, but with weekdays. Lastly, you can use the two charts below as an interactive filter - click on a slice to instantly show only data for your selected quote status, category or employee.
While this dashboard is built on the Microsoft Power BI platform, it utilizes ZoomCharts JS technology for some or all its visual components.