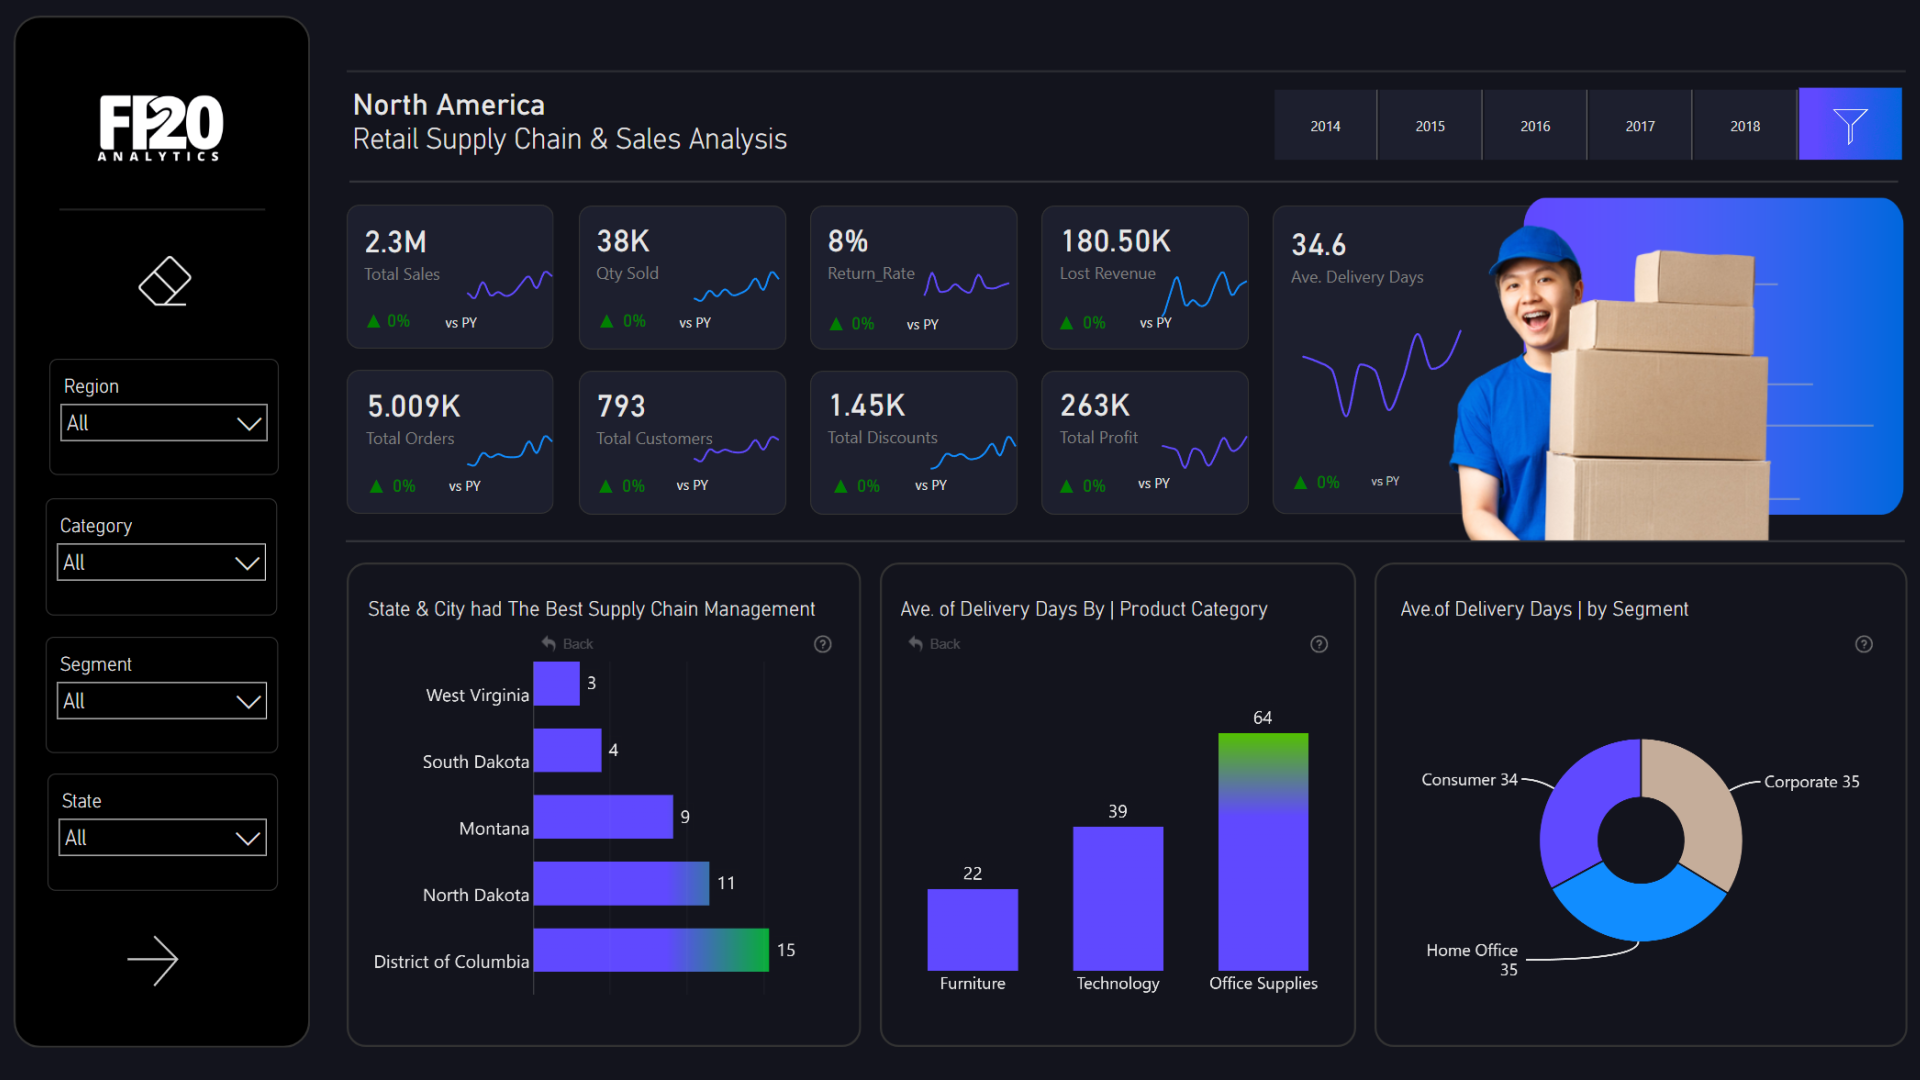
Retail Supply Chain Dashboard Example II
This is another supply chain dashboard example, and it showcases not just the functionality of ZoomCharts visuals, but also the configurability, allowing you to fully customize the appearance and adapt the visuals to your brand colors. Note the KPI cards here - they also have sparkline charts that are created with ZoomCharts time chart visual by disabling axis scales and labels.
While this dashboard is built on the Microsoft Power BI platform, it utilizes ZoomCharts JS technology for some or all its visual components.