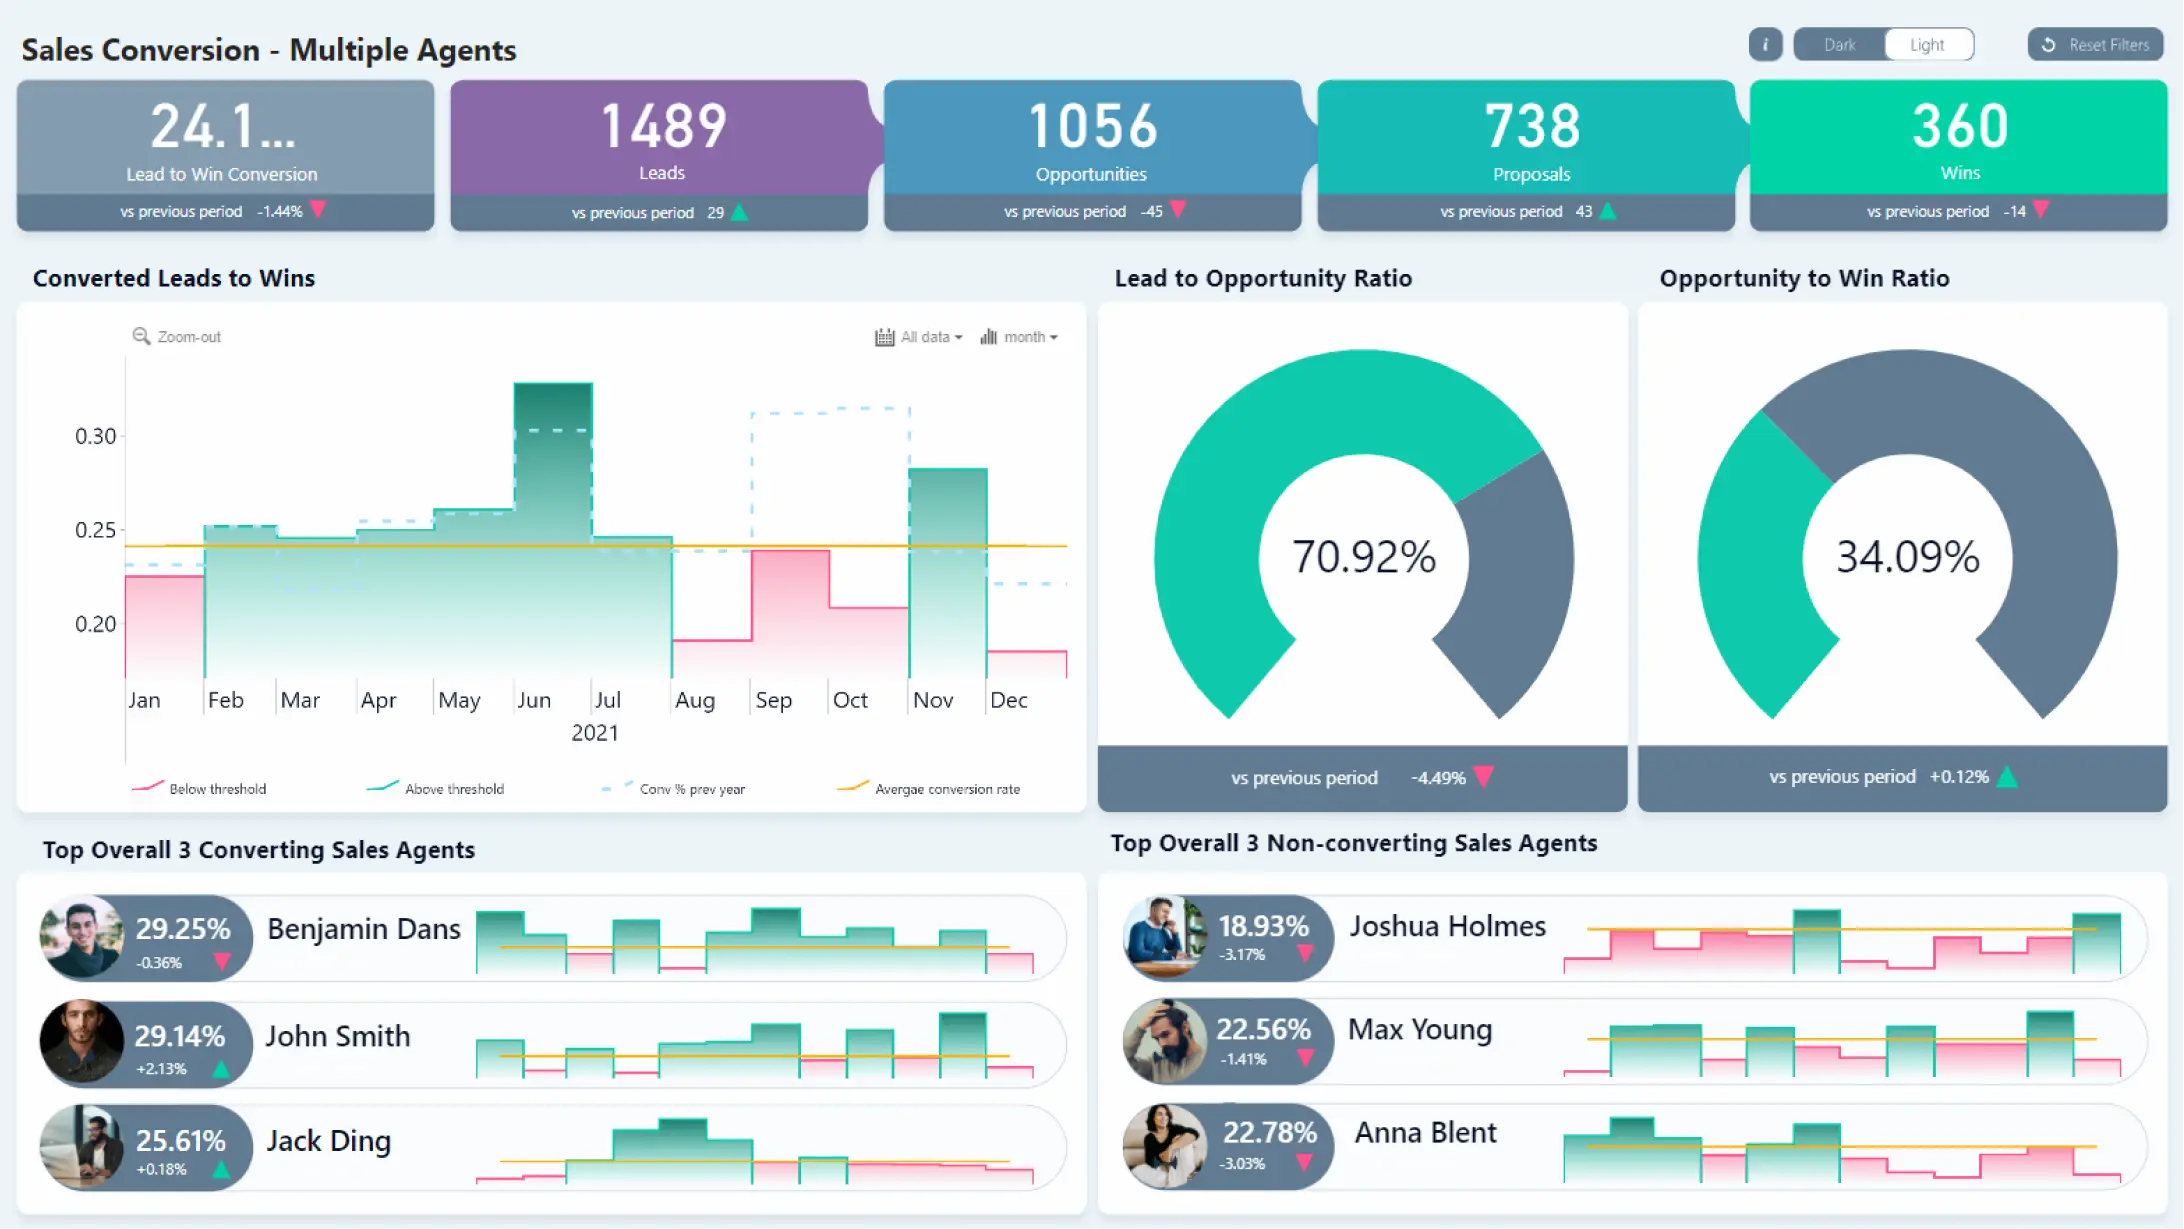
Sales Funnel Dashboard Example
Analyze conversion rate across the entire sales funnel and identify the best-performing sales agents. The main focus in this dashboard is the time series chart that displays conversion rate per month - selecting a time range will apply a filter to other visuals. Below, there are dynamically changing lists of Top 3 and Bottom 3 sales agents in the selected time period. Each agent also displays a column sparkiline - it is the same time chart visual as above, but with a smaller viewport and disabled axis scales and labels.
While this dashboard is built on the Microsoft Power BI platform, it utilizes ZoomCharts JS technology for some or all its visual components.